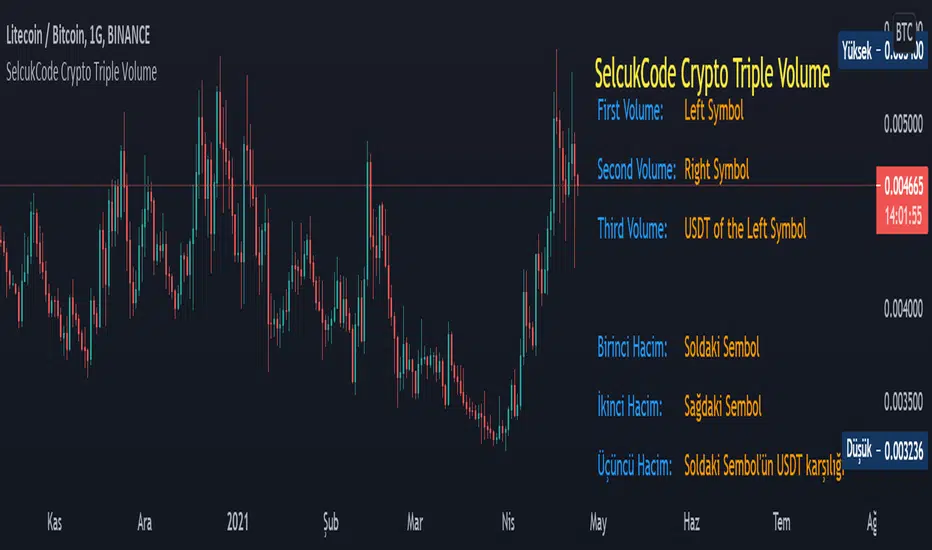
SelcukCode Crypto Triple VolumeThis is a volume indicator written for cryptocurrencies. The difference from the integrated indicator is that the left symbol of the cryptocurrency shows the volume as well as the right symbol. It also shows the volume of the pair in USDT. Thus, we see the USDT volume of each cryptocurrency pair. This standardizes our view of volume.
Bu, kripto paralar için yazılmış bir hacim indikatörüdür. Entegre indikatörden farkı, kripto paranın sol sembolünün hacmini göstermesinin yanı sıra sağ sembolün hacmini de gösterir. Ayrıca paritenin USDT olarak da hacmini gösterir. Böylelikle her kripto para çiftinin USDT hacmini görmüş oluruz. Bu bizim hacime bakış açımızı standartlaştırır.
Поиск скриптов по запросу "crypto"
OBV_RMA_CRYPTO Buy and Hold Destroyer free versionThis is a free version which use part of the logic that I am applying on my destroyer/annihilation series of strategies.
This version its made for 8-12h and works amazingly on the ETH pairs. Can be adapted to others as well
For this example, I used an initial 1$ account, using always full capital on each trade(without using any leverage), together with a 0.1% commission/fees for each deal, on Coinbase broker.
For risk management, we have a hard stop loss on the equity of 25%.
The components for the inside of the strategy are the next one :
1. OBV- SoftKill Version adapted to cryptos
2. ATR - SoftKill Version adapted to cryptos
3. RMA Rolling moving average
The rules here are simple we check for the trend direction with ATR and then we check for cross up or above on OBV and RMA moving average. Based on this we enter long or short.
RISK WARNING
Trading on any financial market involves a risk of loss. Please consider carefully if such trading is appropriate for you. Past performance is not indicative of future results.
If you have any questions or you are interested in trying it, private message me and I will give you as soon as I see the message a trial for it.

GreenCrypto PR Strategy for Swing TradesThis is a very good strategy for Swing Trading, I have been using this strategy for very long time and made good amount of profit using this. This works great for both long trades and short trades, Stop loss and Take profit target is must while entering the trade, this make sure that the trade ends up in good profit and in case if the market revers, ends in only small loss.
This strategy works using the pivot points, we calculate the pivot point using the number of candles mentioned in the input field "leftBars" and "rightBars", if you add more number of bars then the frequency of the trade decreases. for example with the leftBars as 4 you will get less trades than the leftBar=2. Every trade entry is represented using "Buy" and "Sell" signals, whenever there is a new signal chart shows buy/sell signal for limit price, you need to add a limit order for the same price.
Parameters:
LeftBars = Number of left bars should be used for calculating the pivot pints, (more bars means less frequent trades)
RightBars = Number of right candle bars used for calculating the pivot points (more bars means less frequent trades)
Date/month/day : for selecting the right backtesting the period (currently it set to Jan 2018 to current day )
for this backtesting i have used 1000$ capital and with 10% capital used for each trade, free to modify it as per your needs.
This strategy works best on 4H time frame but you can also try backtesting on other time periods.
The default parameters present in the strategy is works best for most of famous cryptocurrencies on 4H time period.
Please DM me if you would like to tryout 7 Days free trail.

ETS Trending ArrowsThis indicator is the end result of years of trial and error to create an indicator that aims to mimic market entry points that a professional trader would take.
It has arrows that clearly show potential market entry points, and suggested stop-loss levels. What I like about it is that it generally responds as fast to market changes as a good trader would, leaving you enough time to still validate the move before taking it.
This basically levels the playing field, because even if you're a rookie trader, or maybe an experienced trader in a slump, this indicator can help you to identify possible trading entry points that is responsive to market moves, and that can be used on different timeframes based on how you want to trade. And if you're an experienced trader, this indicator will help you like a good trading buddy to make good trading decisions.
What Makes It So Powerful?
- Give you a signal as early as possible and does not "repaint" once the bar completes
- Reacts to fast market direction changes like a master trader
- Is super easy to understand and implement in your trading
- Can be used for Forex, Stocks and Crypto
- Works on all timeframes
How To Use The ETS Trending Arrows Indicator
1. Add the indicator to any chart you wish to trade, Crypto, Forex or Stocks and set it to the timeframe you prefer. For instance, I use it on 1 minute and 5 minute charts for daytrading Stocks. For Forex I generally use a 15 minute chart, and longer timeframes for Crypto.
2. Open the Settings and change values to suit your requirements:
2.1. "Early Trigger Live Signals / Stable Signals" - When you select "Stable Signals", the arrows will appear once the bar closes, on the new bar. Selecting "Early Trigger" will signal instantly and can give you an early entry, but may update in some cases as conditions change.
2.2 "Show More Signals" - This pretty much does what it says. If you don't want all possible signals, this will scale things back a bit and give you fewer signals.
2.3. "Show 20, 50, 200 Moving Averages" - This is just a convenience, and is provided to help you exit trades, which I typically do when price crosses back over the 9 EMA or 20 EMA.
2.4. "Show 9 Expo Moving Average" - Also provided for convenience, and separate in case you don't want this level of detail.
2.5. "Show Immediate Reversals" - Personally I don't use this setting, but someone requested that I add it. What it will do is if there is a signal, which then immediately passes the "stoploss" dotted line, this will immediately give a signal in the opposite direction.
2.6. "Show Bollinger Bands" - This is also only provided for convenience, I use Bollinger Bands to determine where the market move is in relation to the average deviation.
2.7. "Bollinger Bands Length" - Simply the regular BB length setting.
2.8. "Bollinger Bands Deviation" - I use a 2.5 setting by default in order to better identify areas where the price action is really far beyond where it should be.
3. Now that you've set things up, all you need to do is to wait for a signal. As mentioned earlier, the signals will react differently based on whether you chose "Early Trigger Live Signals" or "Stable Signals". If you opt for "Early Trigger Live Signals", like I do, you should pay attention to where the market currently is in relation to the closest moving average, like the 9 EMA or 20 EMA. Keep in mind that price will often signal a new move, but then first move back to the average, before continuing in the new direction identified by the trading arrow.
4. These signals are intended to identify new trending moves, and for that reason, if the market moves against the signal, you should not hold on to your position hoping that it will turn in your favor.
5. When the market is moving in your favor, resist the urge to exit quickly, and use either (or both) the 9 EMA and 20 EMA to exit your trades. A good approach is to use the 9 EMA to exit a portion (maybe 50%) of your trade, and exit out of the rest once price closes above or below the 20 EMA depending on the direction of your trade.
This is an "invite only" script, which means that you will need to let me know that you're interested in it before you can get access to it. This is a paid script, please follow the link in my profile to get the details or ask me directly. It may take up to 48 hours for me to respond, but I do my best to respond as quickly as possible. You will get 7 days to test it for yourself on all your charts with no restrictions.

Tether Market Cap - {Cross-Exchange} Tether Market Cap Indicator
Keep track of tether movements cross exchange & total market cap in real-time.
Never miss a movement in the Tether market.
How it works
Starts by selecting the security "CRYPTOCAP:USDT" with, period, close,
The script will then call on each exchange listed to get the usdt_supply from each exchange.
It will then print the data to the indicator as such:
Yellow = Total Tether Market Cap
Orange = Kraken Supply USDT
Red = Poloniex Supply USDT
Green = Bitfinex Supply USDT

Strategy BTBTBTBT — strategy for only long positional trading of top cryptocurrencies. BTCUSD and ETHUSD are best suited for this strategy.
The main idea of the strategy is to buy cryptocurrency with a leverage of up to 1: 3 when the market is growing, and get rid of cryptocurrency when the market is not growing or falling.
The strategy is working on a daily timeframe .
To determine the trend, the strategy uses a combination of indicators MA25 and MA99.
To determine overbought (pump) and oversold (dump), the strategy uses the oscillator "SPPO".
The strategy has three trading conditions:
1) SPPO SPPOoverBought - "pump" market. Close all long positions or leave a position with a micro-leverage of 1: 0.1 for a period of 28 days.
3) Closing> MA25 > MA99 - uptrend in the market. We open the "long" position with a leverage of 1: 3.
If market conditions do not meet the above criteria, then the strategy does not have open positions.
Input parameters
Recommended timeframe D1.
FastLength - period for fast MA. Default = 25.
SlowLength - period of slow MA. Default = 99.
SPPOoverSold - trigger for determining the dump in the market. Default = -30.
SPPOoverBought - trigger to determine the pump in the market. Default = 35.
SPPOmaxForLong - the maximum value of SPPO for opening a long position. Default = 10.
LeverageLong - leverage when entering the market with a "long" signal. Default = 3.
LeveragePamp - the amount of leverage when entering the market with a "pump" signal. Default = 0.1.
LeverageDamp - the amount of leverage when entering the market with a "dump" signal. Default = 1.
Log equity chart - If true, use a logarithmic scale for a graph of equity. Default = false.

REAL STRATEGY : Dow_Factor_MFI/RSI_DVOG_StrategyI'm actually one of those who think it's more important to extract clues from indicators than strategy, but I wanted to test the data about the probability and dow factor I've shared for a long time.
Usually, Bitcoin is used as an eye stain for strategy success, since the graph has increased significantly from the beginning.
To prevent this, I used a commission and in the last lines of document I shared Bitmex's Bitcoin and Ethereum 1W test results.
I don't think there's a factor to repaint. ( Warn me if u see or observe )
I considered Bitcoin because I found working with liquid parities much more realistic.
Ethereum and Bitmex have been featured as a spot and may soon find a place at the CME , so I've evaluated the Ethereum .
But since the Ethereum Bitmex was also spot new, I deleted results that were less than 10 closed trades.
Since the Dow Theory also looks at the harmony in the indices, just try it in the Cryptocurrency market.
Use as indicator in other markets. Support with channels, trend lines with big periods and other supportive indicators.
And my personal suggestion : Use this script and indicator TF : 4H and above.
Specifications :
Commission. ( % 0.125 )
Switchable Methods ( Relative Strength Index / Money Flow Index )
Alarms. (Buy / Sell )
Position closure when horizontal market rates weighs.
Progressive gradual buy/sell alarms.
Clean code layout that will not cause repaint. (Caution : source = close )
Switchable barcolor option (I / 0 )
*****Test results :*****
drive.google.com
Summary:
It was a realistic test.
It has achieved great success in some markets, but as I mentioned earlier, use it only to gain insight into the price movements of cryptos.
Use as indicator in other markets.
This code is open source under the MIT license. If you have any improvements or corrections to suggest, please send me a pull request via the github repository : github.com
Stay tuned ! Noldo.

Various Volume RSI (USDT PRO)RSI that displays USDT (Tether) of various cryptocurrency exchanges together.
色々な暗号通貨取引所のUSDT(Tether)をまとめて表示するRSIです。
CRYPTOCAP:USDT
CRYPTOCAP:USDT.D
BINANCE
BITFINEX
POLONIEX
KRAKEN
BITTREX
HITBTC
HUOBI
詳細などはこちらにて
note.mu

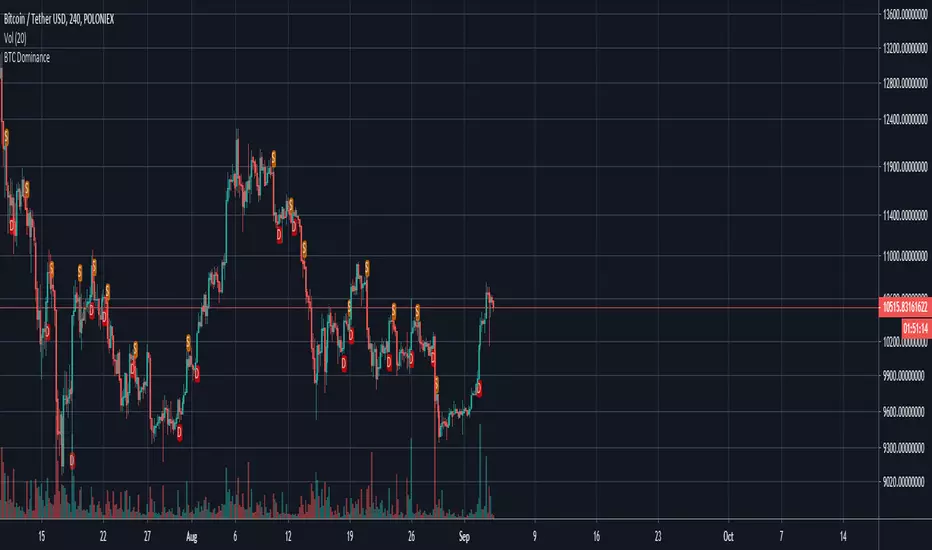
BTC Dominance IndicatorThis script calculates the BTC dominance and adds markers as overlays on top of your crypto chart.
A red "D" means "BTC dominating" and an orange "S" means "BTC submissive". In both cases further price actions are imminent.
You can use this script for any crypto asset to see how it performs while btc is dominating.
If you are for example trading a BTC paired asset, then this can give you a warning if BTC starts to dominate (BTC paired assets tend to dump if BTC dominates).
On the other hand, you can use this as signal on USD paired cryptos if BTC dominates as USD paired cryptos tend to go with BTC.
It is recommended to use additional indicators with this as it is not meant as buy/sell signalling tool.
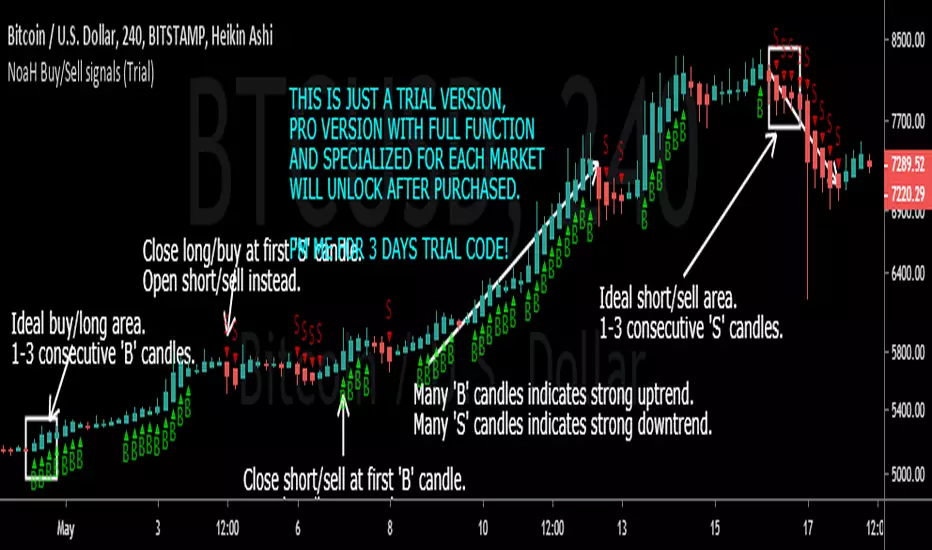
NoaH Buy/Sell signals Indicator (all market, all timeframes)Noah Crypto introduces a miracle 'Buy/Sell signal' indicator that gives huge positive profit on all markets:
- This indicator works on all markets, from stocks to forex, from commodity to crypto. You can applied it on all pairs, all timeframes.
- This indicator was optimized for Heikin Ashi chart, so please use it on Heikin Ashi charts only .
- This indicator shows best performance at M30, H4 and D1 timeframes, other timeframes are good also but the performance will not quite good in comparision to M30, H4 and D1 timeframes.
- This is just a demo version, PRO version specialized for each market will be provided after purchased.
Performance backtest shows on the following comments.
How to exploit this indicator:
A LONG/BUY ORDER:
- Good buy zone are 3 first candles marked with 'B' letter.
- Close/exit order on first 'S' candle confirmed.
- PRO version will show sell targets.
A SHORT/SELL ORDER:
- Good entry is 3 first candles marked with 'S' letter.
- Close/exit order on first 'B' candle confirmed.
- PRO version will show buy/sell targets.
Backtest settings:
- For crypto market: Initial capital $10,000, order size $3,000 (30% of max capital), pyramiding 1 order, commission excluded.
- For stocks market: Initial capital $100,000, order size $30,000 (30% of max capital), pyramiding 1 order, commission excluded.
- For forex market: Initial capital $1,000,000, order size $300,000 (30% of max capital), pyramiding 1 order, commission excluded.
Comment here or PM me for 3 days trial. PM me if you want bactest result for any specific pairs, those one must have data on tradingview.
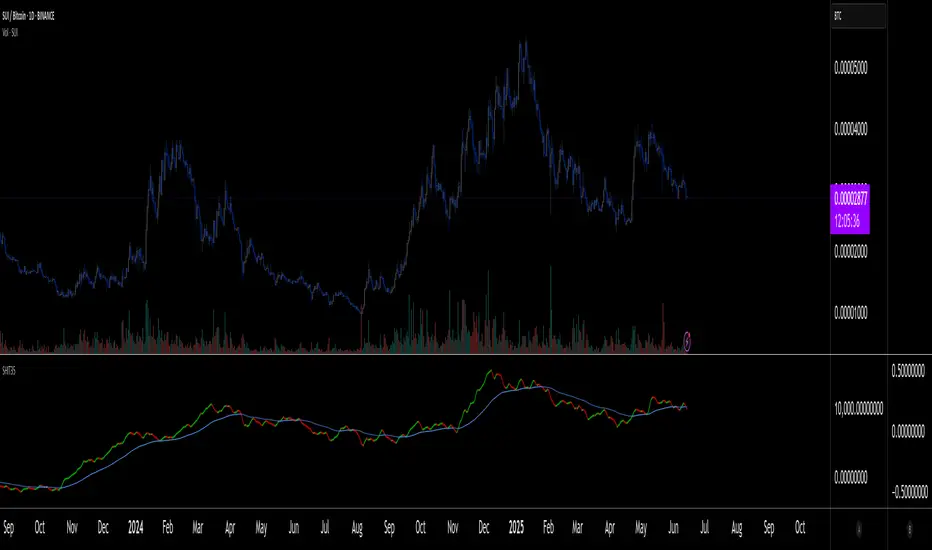
SHIT35 Alt Index (ROC or Volume) [LucF]SHIT35 is an index of 35 Binance alt/BTC pairs. It provides traders with a more reliable read of BTC pairs price movement than the often uncorrelated USD market cap standard.
Because it must read data coming from 35 markets, SHIT35 is painfully slow and should be kept hidden most of the time. Its features will hopefully seduce traders in using it nonetheless for market analysis.
Features
The Index can be calculated using 4 different modes:
1. Total of instant rate of change for all 35 markets ,
2. Cumulative total of ROCs,
3. Average of ROCs,
4. Plus/Minus volume (an aggregate OBV, if you will).
Select only one of the methods at a time to prevent confusion between modes.
An option allows showing the correlation between the Index as it is configured, and another instrument (CRYPTOCAP:TOTAL2 by default).
Markers can be used to identify abnormal movements in the Index. They are generated using Index exits from Bollinger bands.
The chart shows the Index with, from top to bottom, the default mode with BTC pairs, with USDT pairs, then mode 2 and 4 for BTC pairs.
Index Components
The Index is not weighed. The 35 instruments composing the index all have equivalents in the USDT quote currency on Binance, so you can easily change to those pairs using the Settings. Choosing another exchange or quote currency will require modifications to the list of instruments in the indicator’s code, since if one of the markets cannot be found, the indicator will not work. If the instrument exists but has no history for some bars, zero values will be used for them.
Watchlists
I have created a watchlist for the 35 markets in each of the BTC and USDT quote currencies. To import the watchlists, save the text you’ll find at these links in a file named the way you want your watchlist to be named and import them using the “Import Watchlist…” function.
BTC Watchlist: pastebin.com
USDT Watchlist: pastebin.com
Alerts
You can define alerts on any combination of markers you configure. After defining the markers you want the alert to trigger on, make sure you are on the interval you want the alert to be monitoring at, then create the alert, select the indicator, use the default alert condition and choose your triggering window (usually “Once Per Bar Close”). Once the alert is created, you can change the indicator's inputs with no effect on the alert.
MACD + Stochastic + RSI StrategyMy strategy uses a combination of three indicators MACD Stochastic RSI.
The Idea is to buy when (MACD > Signal and RSI > 50 and Stochastic > 50) occures at the same time
This strategy works well on stocks and cryptos especially during market breaking up after consolidation
The best results are on Daily charts, so its NOT a scalping strategy. But it can work also on 1H charts.
The strategy does not have any stops and profit targets, so we can take all the market can give us at the moment.
The exit point only when MACD goes under Signal
Its Preformance is quite stable.
So, use it, trade it.
If it will help you to imprive your trading results, please donate me
BTC: 12kd1F8buWisUBdq27BBwRkUvzW7Ey3og5

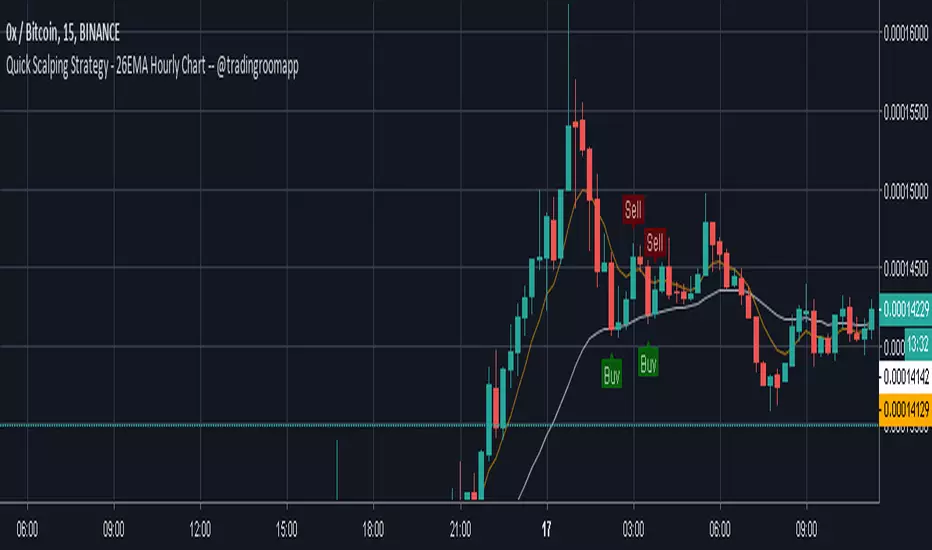
Quick Scalping Strategy - 26EMA Hourly Chart -- @tradingroomappQuick Scalping Strategy around 26EMA and 7EMA published by @TradingRoomApp twitter.com
and brought into TV by myself.
It will give you a quick Buy and Sell opportunity based on crypto price spikes.
If you want access to the tool feel free to send me a DM or contact me through twitter (@CryptoNTez)
Happy Trading!
-- Simple and Profitable Cryptocurrency Trading Strategy --Script based on this strategy:
Based on 8EMA Close and Open with Weis Wave Volume by Lazybear indicator.
The script will let you know when to Long or Short the market.

EdgeAnalysisGroup: Fibbonaci BarsPrivate Message me for more info and EAG Scripts
-------------------------------------------
Colored bars based on EAG Fib MA script.
Potentials:
colorA changes to colorB going down = Open Short or Short Continuation
colorA changes to colorB going up = Open Long or Long Continuation
colorA changes to colorB and the next bar is colorA = Reversal Pattern
Based if used with the Yume Wave or a crypto modified RSI indicator
to determine the likelyhood of color reverse or breakout

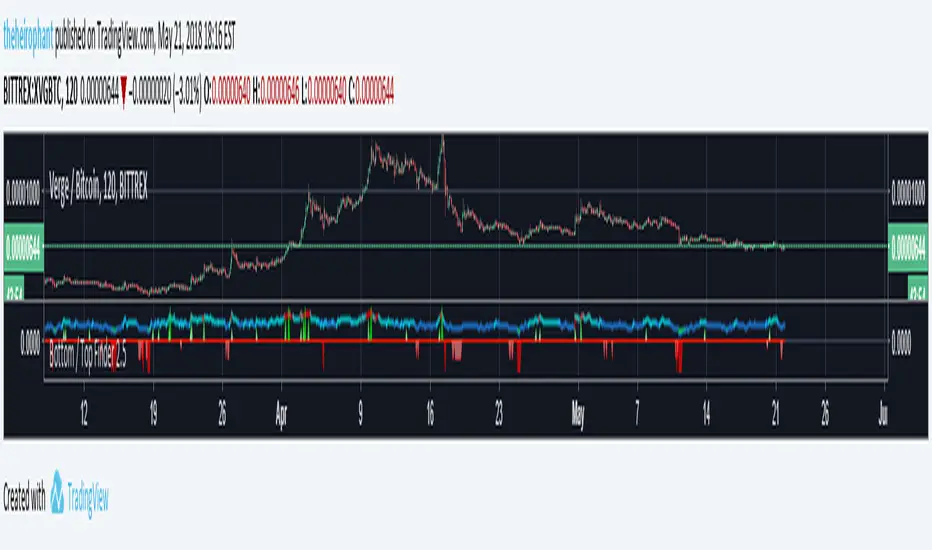
Bottom & Top Finder v2.5Bottom & Top Finder are an automated cryptocurrency signals and analysis tool. It uses a complex algorithm involving multiple indicators, trends, divergences and cross-overs - including proprietary formulas developed in-house. It will predict the bottom / top price of cryptocurrencies. It also works well on stocks, gold , oil, and forex!
24 Hour trials are available upon request if you would like more information please pm me!
Top Finder 1.1Top Finder is an automated cryptocurrency signals and analysis tool which uses a complex algorithm involving multiple indicators, trends, and cross-overs including proprietary formulas developed in-house to predict the top or near top price of cryptocurrencies. It also works well on stocks, gold, oil and forex, even soybeans!
Top Finder is the sister indicator to Bottom Finder (check my other scripts).
Signal strength is represented by height/color of the signal. (Taller signal = stronger signal).

Bottom Finder 2.2Release 2.2
Bottom Finder is an automated cryptocurrency signals and analysis tool which uses a complex algorithm involving multiple indicators, trends, and cross-overs including proprietary formulas developed in-house to predict the bottom price of cryptocurrencies. It also works well on stocks, gold, oil and forex!
Future updates will be included onto this script.
Tip #1: In a bear market, the Half height (fuchsia colored) signals should be ignored by the risk averse trader. In a bull market feel free to buy on both the signals.
Tip #2: In a bear market, use a smaller percent gain instead of TSSL to set your exit targets. In a bull do the opposite, using TSSL (or method of your choice) to exit.

Bottom Finder 2.1Release 2.1 Final!
Bottom Finder is an automated cryptocurrency signals and analysis tool which uses a complex algorithm involving multiple indicators, trends, and cross-overs including proprietary formulas developed in-house to predict the bottom price of cryptocurrencies. It also works well on stocks, gold, oil and forex!

[Strategy] CoinDog - colored bars, RSI & EMA buy entry - v0.2Proof of Concept for algorithmic trading with Cryptocurrencies.
Could be used manually as swiss knife for trading or as automatic trading system for trade automation.
Main features:
has collored candle bars
draws main MAs - EMA for 10, 20, 60, SMA for 200
draws custom Boilinger Bands
draws RSI undersold, overbought
draws price change more then delta
draws volume change more then delta and xyz BTC

Bitfinex Margin VolumesQuick view on longs/short margin positions on Bitfinex for current Crypto Symbol.

Multi-Timeframe Crypto Market Trend Detector — Bull, Bear, or NeThis indicator is designed to help traders quickly identify whether the crypto market is in a Bullish, Bearish, or Neutral phase by combining trend analysis across multiple timeframes.
📊 How it works:
Uses 200-period SMA as the primary trend reference.
Evaluates Weekly (1W) and Daily (1D) trends separately.
Confirms the trend direction with RSI and an optional Fear & Greed Index value.
Shows a color-coded table on the chart for quick visual identification of the market phase.
✅ Trend logic:
Bullish = Price above SMA200 + RSI > 50 or Fear & Greed > 50
Bearish = Price below SMA200 + RSI < 50 or Fear & Greed < 50
Otherwise → Neutral
🛠 Features:
Dual timeframe analysis (1W macro trend + 1D current trend)
Clean visual table in the top-right corner
Supports manual input of the Fear & Greed Index (update daily from alternative.me)
Works on any crypto pair, including BTC, ETH, and altcoins
⚡ Use case: Align your trades with the macro and daily trends. If both timeframes point in the same direction, signals have higher probability.
Tip: Use this tool alongside volume analysis and support/resistance levels for better accuracy.
👌 If you find this script useful, don’t forget to give it a 👍 and add it to your favorites!

Hilly 2.0 Advanced Crypto Scalping Strategy - 1 & 5 Min ChartsHow to Use
Copy the Code: Copy the script above.
Paste in TradingView: Open TradingView, go to the Pine Editor (bottom of the chart), paste the code, and click “Add to Chart.”
Check for Errors: Verify no errors appear in the Pine Editor console. The script uses Pine Script v5 (@version=5).
Select Timeframe:
1-Minute Chart: Use defaults (emaFastLen=7, emaSlowLen=14, rsiLen=10, rsiOverbought=80, rsiOversold=20, slPerc=0.5, tpPerc=1.0, useCandlePatterns=false).
5-Minute Chart: Adjust to emaFastLen=9, emaSlowLen=21, rsiLen=14, rsiOverbought=75, rsiOversold=25, slPerc=0.8, tpPerc=1.5, useCandlePatterns=true.
Apply to Chart: Use a liquid crypto pair (e.g., BTC/USDT, ETH/USDT on Binance or Coinbase).
Verify Signals:
Green “BUY” or “EMA BUY” labels and triangle-up arrows below candles.
Red “SELL” or “EMA SELL” labels and triangle-down arrows above candles.
Green/red background highlights for signal candles.
Arrows use size.normal for consistent visibility.
Backtest: Use TradingView’s Strategy Tester to evaluate performance over 1–3 months, checking Net Profit, Win Rate, and Drawdown.
Demo Test: Run on a demo account to confirm signal visibility and performance before trading with real funds.
