TraderFa Automatic FVGhe Fair Value Gap (FVG) indicator is a powerful technical analysis tool that identifies market inefficiencies by highlighting Fair Value Gaps across multiple timeframes. Discover key trading zones where institutions might be active—don’t miss your edge!
Introduction to the FVG Indicator
The Fair Value Gap indicator is designed to automatically detect areas of price imbalance—commonly referred to as Fair Value Gaps (FVGs)—directly on your chart. These zones occur when price moves aggressively in one direction, leaving behind a gap that represents a lack of order matching, and often becomes a magnet for future price action.
The concept is widely used by professional traders and is deeply rooted in liquidity-based analysis and institutional trading logic.
Key Features
Multi-timeframe FVG detection (up to 4 timeframes simultaneously):
Gain a layered perspective by monitoring price gaps on different timeframes all at once.
Automatic detection of bullish and bearish FVGs:
Highlighted zones where price surged or dropped too quickly—potential reaction areas.
Option to display or hide mitigated gaps:
You can choose to keep showing gaps that have already been filled or remove them from view.
Custom color settings for each timeframe:
Assign different colors for bullish and bearish gaps in each timeframe for better visual clarity.
How the Indicator Works
Utilizing the capabilities of Pine Script, the indicator fetches data such as high, low, open, and time from higher timeframes and compares it with current candles to detect valid FVGs.
The detection logic is based on:
A bullish FVG forms when the low of the current candle is higher than the high of two candles ago.
A bearish FVG forms when the high of the current candle is lower than the low of two candles ago.
These gaps are then visualized using boxes and labels, and updated or removed depending on whether the price has returned to fill the gap.
Use Cases in Trading
Reveal hidden liquidity zones:
Institutional traders often place orders around FVGs. Identifying these can help pinpoint high-probability entries.
Set precise entry, exit, or target zones:
Use gaps to identify potential reversal or continuation zones with minimal risk exposure.
Optimize multi-timeframe confluence:
Seeing FVGs from various timeframes simultaneously allows you to discover overlapping zones—excellent for timing trades with confidence.
Customizable Settings :
Enable/disable each of the four timeframes independently
Select your desired timeframe for each layer
Pick unique colors for bullish and bearish gaps
Show or hide mitigated (filled) gaps based on strategy
F inal Thoughts
The FVG indicator is a refined, high-precision tool built for traders who use price action and liquidity principles. Whether you're scalping or trading swing setups, this indicator offers an edge by visually representing inefficiencies in price—helping you anticipate where price is likely to react.
Ready to see the market through the lens of institutional behavior? Add the FVG indicator to your chart today and start spotting the gaps that really matter.
Поиск скриптов по запросу "gaps"

IU Gap Fill StrategyThe IU Gap Fill Strategy is designed to capitalize on price gaps that occur between trading sessions. It identifies gaps based on a user-defined percentage threshold and executes trades when the price fills the gap within a day. This strategy is ideal for traders looking to take advantage of market inefficiencies that arise due to overnight or session-based price movements. An ATR-based trailing stop-loss is incorporated to dynamically manage risk and lock in profits.
USER INPUTS
Percentage Difference for Valid Gap - Defines the minimum gap size in percentage terms for a valid trade setup. ( Default is 0.2 )
ATR Length - Sets the lookback period for the Average True Range (ATR) calculation. (default is 14 )
ATR Factor - Determines the multiplier for the trailing stop-loss, helping in risk management. ( Default is 2.00 )
LONG CONDITION
A gap-up occurs, meaning the current session opens above the previous session’s close.
The price initially dips below the previous session's close but then recovers and closes above it.
The gap meets the valid percentage threshold set by the user.
The bar is not the first or last bar of the session to avoid false signals.
SHORT CONDITION
A gap-down occurs, meaning the current session opens below the previous session’s close.
The price initially moves above the previous session’s close but then closes below it.
The gap meets the valid percentage threshold set by the user.
The bar is not the first or last bar of the session to avoid false signals.
LONG EXIT
An ATR-based trailing stop-loss is set below the entry price and dynamically adjusts upwards as the price moves in favor of the trade.
The position is closed when the trailing stop-loss is hit.
SHORT EXIT
An ATR-based trailing stop-loss is set above the entry price and dynamically adjusts downwards as the price moves in favor of the trade.
The position is closed when the trailing stop-loss is hit.
WHY IT IS UNIQUE
Precision in Identifying Gaps - The strategy focuses on real price gaps rather than minor fluctuations.
Dynamic Risk Management - Uses ATR-based trailing stop-loss to secure profits while allowing the trade to run.
Versatility - Works on stocks, indices, forex, and any market that experiences session-based gaps.
Optimized Entry Conditions - Ensures entries are taken only when the price attempts to fill the gap, reducing false signals.
HOW USERS CAN BENEFIT FROM IT
Enhance Trade Timing - Captures high-probability trade setups based on market inefficiencies caused by gaps.
Minimize Risk - The ATR trailing stop-loss helps protect gains and limit losses.
Works in Different Market Conditions - Whether markets are trending or consolidating, the strategy adapts to potential gap fill opportunities.
Fully Customizable - Users can fine-tune gap percentage, ATR settings, and stop-loss parameters to match their trading style.

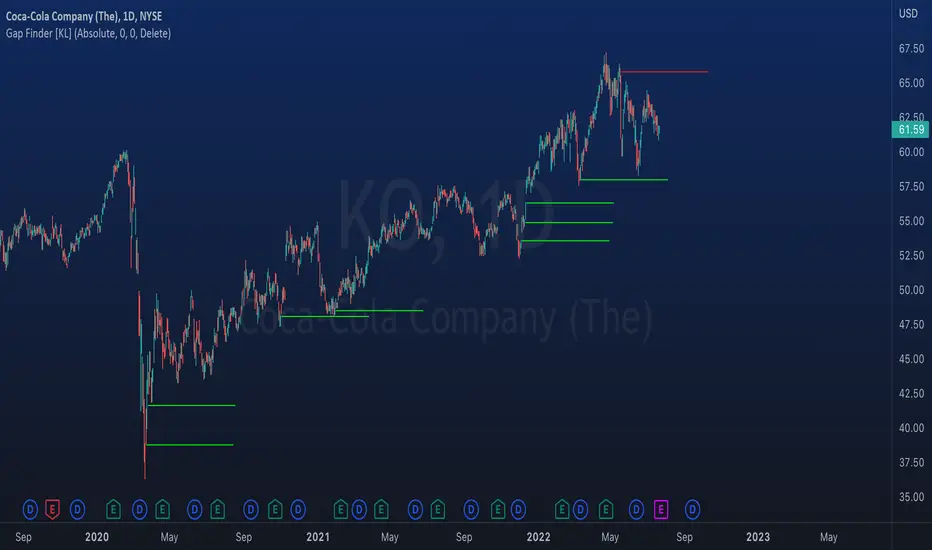
Indicator: Gap Finder [KL]
About gaps:
A gap is a “jump” in a security’s price between the Open and the Prior Close . Gaps are very common in stocks during opening hours, especially when accompanied by catalysts.
What this indicator does:
This script will identify gaps that remained unfilled for at least one candle.
It is very common for gaps to be filled on the first candle, these gaps are arguably less meaningful, so they are ignored by the indicator to reduce the number of lines drawn.
Applications:
Since most gaps eventually get filled, the question is a matter of when . If going with the trend, a trader will open a long/short position when seeing an up/down gap. When going against the trend, then short/long the stock on up/down gaps and consider taking profits when price returns to where the gap originally occurred.
Originally intended for 1D timeframes, but gaps can occur in all timeframes. Applications are limitless.
Liquidity Pools Smart Entry + Multi-TF Targets + VWAPOverview
This indicator is designed to help traders identify high-probability institutional-style entries using concepts from ICT (Inner Circle Trader) methodology. It combines liquidity pool detection, fair value gaps (FVG), swing levels, killzones, ATR-based targets, VWAP bias, and optional multi-timeframe analysis.
The script provides visual trade signals and a green-light confirmation system to streamline decision-making and reduce overtrading.
Key Features
Market Structure
Detects CHoCH (Change of Character) and BOS (Break of Structure).
Marks bullish and bearish breaks with labels on the chart.
Liquidity & Swings
Highlights Swing High/Low liquidity zones (SSL/BSL).
Shows horizontal swing lines for reference.
Fair Value Gap (FVG) Detection
Bullish and bearish gaps are plotted as shaded boxes.
Identifies potential institutional entry zones.
Killzones
Highlights London and New York sessions.
Helps align trades with high liquidity periods.
VWAP Filter
Plots the intraday VWAP.
Optional VWAP bias filter ensures trades follow intraday institutional flow.
Multi-Timeframe Confirmation
Supports 5-minute entry confirmation.
Shows SL/TP for both current TF and 5-min TF signals.
ATR-Based Stops & Targets
Entry signals automatically calculate SL (1.5 ATR) and TP (ATR x multiplier).
Customizable ATR multiplier.
Trade Light System
Visual green/red/gray indicators:
🟢 Green: All bullish conditions aligned → LONG allowed.
🔴 Red: All bearish conditions aligned → SHORT allowed.
⚪ Gray: Wait → conditions not aligned.
Inputs
Input Description
Show CHoCH/BOS Toggle structure labels on/off
Show Killzones Toggle session backgrounds on/off
Show Swing Liquidity Show SSL/BSL swing points
Show Horizontal Lines Extend swing lines horizontally
Show FVG Zones Show Fair Value Gaps
Show VWAP Display intraday VWAP
Swing Length Number of bars to calculate swing pivots
ATR Target Multiplier Multiplies ATR for TP calculation
Use HTF 200 EMA Filter Filter entries with higher timeframe trend
Use RSI Filter Filter entries using RSI 14
Use Volume Filter Filter entries with high volume confirmation
Use ATR Filter Filter entries based on ATR expansion
Use VWAP Filter Only allow trades in VWAP direction
How to Read the Chart
Structure Labels
BOS ↑ / BOS ↓: Breaks of structure showing trend direction.
Swing Liquidity
SSL (blue): Bullish swing low liquidity.
BSL (red): Bearish swing high liquidity.
FVG Zones
Green boxes: Potential bullish liquidity gaps.
Red boxes: Potential bearish liquidity gaps.
Killzones
Green background: London session.
Blue background: New York session.
VWAP
Purple line: Intraday volume-weighted average price.
Trade Lights
🟢 Green: All bullish conditions met — LONG ready.
🔴 Red: All bearish conditions met — SHORT ready.
⚪ Gray: Wait — conditions not aligned.
Entry Labels
Shows Entry price, SL, TP.
Separate labels for current TF and 5-min confirmation.
How to Use
Step 1: Identify Market Bias
Check HTF EMA: price above → bullish trend, below → bearish trend.
Check VWAP (if enabled): trade in direction of VWAP for institutional alignment.
Check Killzones: prefer entries during London or New York sessions.
Step 2: Confirm Entry Conditions
Wait for BOS / CHoCH to align with your trend.
Look for FVG zone and SSL/BSL liquidity.
Ensure RSI, ATR, Volume, VWAP filters (if enabled) all confirm.
Green/red Trade Light should be active.
Step 3: Place Trade
Use Entry Label price as reference.
SL: 1.5 ATR away.
TP: ATR x multiplier away.
Optional: check 5-min multi-TF confirmation label for additional confidence.
Step 4: Manage Trade
Follow ATR-based SL/TP.
Move stop to break-even after partial target if desired.
Only take trades when Trade Light is GREEN (LONG) or RED (SHORT).
Best Practices
Combine with volume profile or order block analysis for higher precision.
Avoid trading outside killzones.
Use multi-TF confirmation for safer entries.
Adjust ATR multiplier according to market volatility.

FVG Matrix - Orderblock, Expansion & Rejection(@JP7FX)FVG Matrix (JP7FX)
FVG Matrix detects and displays multiple types of Fair Value Gaps. It gives traders a clear view of imbalance behaviour without manual marking.
FVG Types
The indicator identifies five categories of FVGs:
• Standard FVGs
Three candle price inefficiencies.
• Orderblock FVGs
Gaps that form near orderblocks.
• Expansion FVGs
Imbalances created during strong impulsive moves.
• Consolidation FVGs
Gaps within tight ranges.
• Rejection FVGs
Gaps that show rejection behaviour when price returns.
Each type can be enabled, disabled or recoloured.
Features
• Multi type FVG detection across all timeframes.
• 50 percent mitigation tracking to show partial fills.
• Alerts for FVG creation and mitigation.
• Control over whether mitigated FVGs remain on the chart.
• Full colour and visibility customisation.
Alerts
The indicator includes alert conditions for new FVG creation and FVG mitigation.
Users can choose which FVG types trigger alerts.
Use Cases
Suitable for traders who track imbalance behaviour or follow Smart Money concepts. The indicator reduces chart work by automating the identification and organisation of Fair Value Gaps.

Smart Structure Pro - Market Structure & Smart Money Concepts═══════════════════════════════════════════════════════════════════════════════
SMART STRUCTURE PRO
═══════════════════════════════════════════════════════════════════════════════
A comprehensive market structure analysis tool that identifies institutional trading
patterns and smart money concepts for improved trade timing and decision-making.
═══════════════════════════════════════════════════════════════════════════════
📊 WHAT IT DOES
═══════════════════════════════════════════════════════════════════════════════
This indicator automatically detects and visualizes key market structure elements:
🔹 BOS (Break of Structure)
- Identifies trend continuation patterns
- Marks when price breaks above previous highs (bullish) or below previous lows (bearish)
- Confirms trend strength and momentum
🔹 CHoCH (Change of Character)
- Detects potential trend reversals
- Alerts when market structure shifts from bullish to bearish or vice versa
- Helps identify early reversal opportunities
🔹 Order Blocks
- Highlights institutional entry zones
- Identifies the last opposite candle before a structure break
- Shows areas where smart money likely entered positions
🔹 Fair Value Gaps (FVG)
- Detects price imbalances and inefficiencies
- Shows areas where price moved rapidly leaving gaps
- Often act as support/resistance when retested
🔹 Liquidity Zones
- Marks swing high and low levels
- Identifies areas where stop losses likely cluster
- Shows potential stop hunt and liquidity grab zones
═══════════════════════════════════════════════════════════════════════════════
🎯 HOW TO USE
═══════════════════════════════════════════════════════════════════════════════
BULLISH SETUP:
1. Wait for Bullish CHoCH (trend reversal signal) or BOS ↑ (continuation)
2. Look for price to pull back into an Order Block or Fair Value Gap
3. Enter long when price bounces from these zones
4. Place stop loss below the Order Block
5. Target the next liquidity zone or resistance level
BEARISH SETUP:
1. Wait for Bearish CHoCH (trend reversal signal) or BOS ↓ (continuation)
2. Look for price to retrace into an Order Block or Fair Value Gap
3. Enter short when price rejects from these zones
4. Place stop loss above the Order Block
5. Target the next liquidity zone or support level
DASHBOARD INTERPRETATION:
• Trend: Current market direction (Bullish/Bearish)
• Volume: Confirmation strength (High volume = stronger signals)
• Signal: Latest structure break detected
• Key High/Low: Critical levels for the current trend
• Position: Price location (Premium = expensive, Discount = cheap)
═══════════════════════════════════════════════════════════════════════════════
⚙️ SETTINGS GUIDE
═══════════════════════════════════════════════════════════════════════════════
STRUCTURE DETECTION:
• Pivot Length (Default: 10)
- Lower values = More signals but potentially weaker
- Higher values = Fewer signals but stronger/more reliable
- Recommended: 8-12 for intraday, 10-15 for higher timeframes
• Structure Line Extension
- Visual preference for how far lines extend
- Does not affect signal detection
SMART MONEY CONCEPTS:
• Order Block Extension: How long OB boxes remain visible
• FVG Extension: How long gap boxes remain visible
• Min FVG Size: Filter out small gaps (0 = show all)
- Set to 10-20% to reduce noise
- Set to 0 to see all gaps
VOLUME FILTER:
• Volume Confirmation (Recommended: ON)
- Filters weak signals without volume support
- Reduces false breakouts
• Volume Multiplier (Default: 1.5)
- Higher = Stricter filtering (fewer but stronger signals)
- Lower = More signals (but may include weak ones)
DISPLAY:
• Dashboard: Toggle information panel
• Trend Background: Subtle color tint showing current trend
• Dashboard Position: Choose corner placement
═══════════════════════════════════════════════════════════════════════════════
🔔 ALERTS
═══════════════════════════════════════════════════════════════════════════════
Available alert conditions:
✓ Bullish BOS - Uptrend continuation confirmed
✓ Bearish BOS - Downtrend continuation confirmed
✓ Bullish CHoCH - Reversal to uptrend detected
✓ Bearish CHoCH - Reversal to downtrend detected
✓ Structure Break - Any significant market structure change
To set up alerts:
1. Click the "⏰" alert icon
2. Select "Smart Structure Pro"
3. Choose your desired condition
4. Configure notification method
5. Click "Create"
═══════════════════════════════════════════════════════════════════════════════
⚠️ IMPORTANT DISCLOSURES
═══════════════════════════════════════════════════════════════════════════════
REPAINTING BEHAVIOR:
• Pivot points WILL repaint until confirmed (this is by design and unavoidable)
• Structure breaks (BOS/CHoCH) use CLOSED candles and do NOT repaint after confirmation
• Order Blocks and FVGs are drawn on confirmed signals and do NOT repaint
• All signals wait for candle close before triggering
BEST PRACTICES:
• Use on higher timeframes (15min+) for more reliable signals
• Combine with other analysis (support/resistance, volume profile, etc.)
• Wait for candle close confirmation before acting on signals
• Use proper risk management - this is not a standalone trading system
• Backtest on your preferred instrument and timeframe
PERFORMANCE:
• Limited to 100 boxes, 100 lines, 100 labels for optimal performance
• Older objects automatically removed as new ones appear
• Works on all markets (Forex, Crypto, Stocks, Indices, Commodities)
═══════════════════════════════════════════════════════════════════════════════
📚 CONCEPTS EXPLAINED
═══════════════════════════════════════════════════════════════════════════════
MARKET STRUCTURE:
Market structure refers to the pattern of price movements creating swing highs
and lows. Understanding structure helps identify trend direction and potential
reversal points.
SMART MONEY CONCEPTS:
These are trading techniques based on tracking institutional order flow and
understanding where large players (banks, funds, institutions) enter and exit
positions.
ORDER BLOCKS:
The last opposing candle before a strong directional move. Institutions often
leave unfilled orders in these zones, which can act as support/resistance when
price returns.
FAIR VALUE GAPS:
Areas where price moved so quickly that it left an imbalance. These gaps often
get "filled" as price returns to find equilibrium, creating trading opportunities.
═══════════════════════════════════════════════════════════════════════════════
🎓 EDUCATIONAL VALUE
═══════════════════════════════════════════════════════════════════════════════
This indicator helps traders:
✓ Understand market structure mechanics
✓ Identify institutional trading patterns
✓ Improve trade timing and entry precision
✓ Recognize trend continuation vs reversal
✓ Learn smart money concepts through visualization
═══════════════════════════════════════════════════════════════════════════════
📋 TECHNICAL DETAILS
═══════════════════════════════════════════════════════════════════════════════
• Version: 1.0.0
• Pine Script Version: 5
• Indicator Type: Overlay
• No Repainting: Structure breaks use confirmed candles
• Performance Optimized: Limited drawing objects
• Works On: All markets and timeframes
• Alerts: Yes, fully customizable
═══════════════════════════════════════════════════════════════════════════════
👤 AUTHOR
═══════════════════════════════════════════════════════════════════════════════
Created by: Zakaria Safri
Original Work: All code and concepts are original implementations
Based On: ICT (Inner Circle Trader) educational concepts
License: © 2024 Zakaria Safri - Personal Use Only
═══════════════════════════════════════════════════════════════════════════════
⚖️ DISCLAIMER
═══════════════════════════════════════════════════════════════════════════════
This indicator is for educational and informational purposes only. It does not
constitute financial advice. Trading involves substantial risk of loss. Past
performance does not guarantee future results. Always conduct your own research
and consult with a licensed financial advisor before making trading decisions.
The author is not responsible for any losses incurred from using this indicator.
═══════════════════════════════════════════════════════════════════════════════
If you find this indicator helpful, please:
👍 Like and favorite
⭐ Leave a review
📢 Share with other traders
💬 Comment with feedback or suggestions
Happy Trading! 📈

Nexus One v1.1Introduction
My Order Block Indicator is THE cutting-edge trading tool designed to offer traders an unparalleled edge in the markets. This unique indicator combines order blocks, fair value gaps, exponential moving averages (EMAs), and vector candles into a cohesive Nexus strategy. Unlike traditional indicators, this tool leverages the synergistic effects of these components to identify high-probability trading setups.
How It Works
Order Blocks: At the heart of our indicator are pivot-based order blocks. These are price levels or ranges that are significant due to past market activity. Our algorithm identifies these blocks based on historical pivot points, considering both the price's reaction to these levels and their recurrence over time. This method helps in pinpointing areas where institutional orders are likely to be placed.
Fair Value Gaps: Alongside, our indicator detects fair value gaps - regions where price has moved too swiftly, leaving a gap in the market's valuation. By identifying these gaps, the tool helps traders anticipate areas where price might return to fill the gap, offering strategic entry and exit points.
EMAs and Vector Candles: To refine our signals, the indicator utilizes a combination of exponential moving averages and vector candles. EMAs help in determining the market's trend direction, while vector candles offer insights into the momentum and strength of price movements. The integration of these elements enables our tool to filter out lower probability setups, focusing on those with higher chances of success.
Originality and Usefulness
My Order Block Indicator is not merely a combination of existing tools. It represents a novel approach to market analysis, integrating various components into a single, comprehensive trading strategy. The methodology behind combining real time order blocks with fair value gaps and EMAs, supplemented by the unique use of vector candles, is proprietary and designed to offer original insights into market dynamics.
This tool is invaluable for traders looking to enhance their market analysis, providing a deeper understanding of price movements and potential reversal points. Whether for scalping, day trading, or swing trading, our indicator offers versatile applications, helping traders to navigate the complexities of various market conditions with greater confidence.
How to Use
To make the most of my Order Block Indicator:
Setup: Apply the indicator to any chart or time frame, tailoring the EMA settings according to your trading style.
Interpretation: Look for confluences between real time order blocks and fair value gaps as high-probability entry points. EMAs will guide you on the trend's direction, while vector candles highlight momentum strength.
Application: Use the indicator to identify potential reversal zones, entry, and exit points. Combine it with The Nexus risk management strategy to optimize your trading performance.
Conclusion
My Order Block Indicator is crafted for traders who demand depth, precision, and originality in their tools. It stands out by providing a multifaceted approach to market analysis, backed by a proprietary integration of critical trading concepts. This tool is not just an indicator; it's a comprehensive strategy designed to elevate your trading journey.

WVAD with Gap Compensation**Indicator Name:** WVAD with Gap Compensation
**Purpose:** Enhances the classic Williams Vix Fix (WVAD) by incorporating the impact of price gaps (jump ups/downs) in its calculation.
**Key Features:**
1. **Gap Detection:** Automatically identifies significant gaps (default: >0.5% from prior bar's high/low).
2. **Gap Compensation:** Adjusts the WVAD calculation by adding the gap size to the daily price change.
3. **Dynamic Weighting:** Applies a multiplier (1.2x or 1.5x) to the WVAD value on days with medium/large gaps (based on ATR).
4. **Visualization:**
- Plots the enhanced WVAD line (blue) and optionally the original WVAD (gray circles).
- Marks gap events with colored arrows (green ▲ for gap up, red ▼ for gap down) and connects the gap's impact with dashed lines.
- Includes a zero line for reference.
**Use Cases:**
- Gauges the true strength of money flow by accounting for gaps.
- Identifies potential trend shifts around gap events.
- Filters noise by focusing on significant gaps.
**Parameters:**
- `Accumulation Period`: Number of days to sum WVAD (default: 12).
- `Gap Threshold (%)`: Minimum gap size to trigger compensation (default: 0.5%).
- `Show Original WVAD`: Toggles display of the classic WVAD.
**Version:** Pine Script® v6

Smarter Money Concepts - FVGs [PhenLabs]📊 Smarter Money Concepts - FVGs
Version: PineScript™ v6
📌 Description
Smarter Money Concepts - FVGs is a sophisticated indicator designed to identify and track Fair Value Gaps (FVGs) in price action. These gaps represent market inefficiencies where price moves quickly, creating imbalances that often attract subsequent price action for mitigation. By highlighting these key areas, traders can identify potential zones for reversals, continuations, and price targets.
The indicator employs volume filtering ideology to highlight only the most significant FVGs, reducing noise and focusing on gaps formed during periods of higher relative volume. This combination of price structure analysis and volume confirmation provides traders with high-probability areas of interest that institutional smart money may target during future price movements.
🚀 Points of Innovation
Volume-Filtered Gap Detection : Eliminates low-significance FVGs by requiring a minimum volume threshold, focusing only on gaps formed with institutional participation
Equilibrium Line Visualization : Displays the midpoint of each gap as a potential precision target for trades
Automated Gap Mitigation Tracking : Monitors when price revisits and mitigates gaps, automatically managing visual elements
Time-Based Gap Management : Intelligently filters gaps based on a configurable timeframe, maintaining chart clarity
Dual Direction Analysis : Simultaneously tracks both bullish and bearish gaps, providing a complete market structure view
Memory-Optimized Design : Implements efficient memory management for smooth chart performance even with numerous FVGs
🔧 Core Components
Fair Value Gap Detection : Identifies price inefficiencies where the current candle’s low is higher than the previous candle’s high (bearish FVG) or where the current candle’s high is lower than the previous candle’s low (bullish FVG).
Volume Filtering Mechanism : Calculates relative volume compared to a moving average to qualify only gaps formed during significant market activity.
Mitigation Tracking : Continuously monitors price action to detect when gaps get filled, with options to either hide or maintain visual representation of mitigated gaps.
🔥 Key Features
Customizable Gap Display : Toggle visibility of bullish and bearish gaps independently to focus on your preferred market direction
Volume Threshold Control : Adjust the minimum volume ratio required for gap qualification, allowing fine-tuning between sensitivity and significance
Flexible Mitigation Methods : Choose between “Wick” or “Close” methods for determining when a gap has been mitigated, adapting to different trading styles
Visual Customization : Full control over colors, transparency, and style of gap boxes and equilibrium lines
🎨 Visualization
Gap Boxes : Rectangular highlights showing the exact price range of each Fair Value Gap. Bullish gaps indicate potential upward price targets, while bearish gaps show potential downward targets.
Equilibrium Lines : Dotted lines running through the center of each gap, representing the mathematical midpoint that often serves as a precision target for price movement.
📖 Usage Guidelines
General Settings
Days to Analyze : Default: 15, Range: 1-100. Controls how many days of historical gaps to display, balancing between comprehensive analysis and chart clarity
Visual Settings
Bull Color : Default:(#596fd33f). Color for bullish Fair Value Gaps, typically using high transparency for clear chart visibility
Bear Color : Default:(#d3454575). Color for bearish Fair Value Gaps, typically using high transparency for clear chart visibility
Equilibrium Line : Default: Enabled. Toggles visibility of the center equilibrium line for each FVG
Eq. Line Color : Default: Black with 99% transparency. Sets the color of equilibrium lines, usually kept subtle to avoid chart clutter
Eq. Line Style : Default: Dotted, Options: Dotted, Solid, Dashed. Determines the line style for equilibrium lines
Mitigation Settings
Mitigation Method : Default: Wick, Options: Wick, Close. Determines how gap mitigation is calculated - “Wick” uses high/low values while “Close” uses open/close values for more conservative mitigation criteria
Hide Mitigated : Default: Enabled. When enabled, gaps become transparent once mitigated, reducing visual clutter while maintaining historical context
Volume Filter
Volume Filter : Default: Enabled. When enabled, only shows gaps formed with significant volume relative to recent average
Min Ratio : Default: 1.5, Range: 0.1-10.0. Minimum volume ratio compared to average required to display an FVG; higher values filter out more gaps
Periods : Default: 15, Range: 5-50. Number of periods used to calculate the average volume baseline
✅ Best Use Cases
Identifying potential reversal zones where price may react after extended moves
Finding precise targets for take-profit placement in trend-following strategies
Detecting institutional interest areas for potential breakout or breakdown confirmations
Plotting significant support and resistance zones based on structural imbalances
Developing fade strategies at key market structure points
Confirming trade entries when price approaches significant unfilled gaps
⚠️ Limitations
Works best on higher timeframes where gaps reflect more significant market inefficiencies
Very choppy or ranging markets may produce small gaps with limited predictive value
Volume filtering depends on accurate volume data, which may be less reliable for some symbols
Performance may be affected when displaying a very large number of historical gaps
Some gaps may never be fully mitigated, particularly in strongly trending markets
💡 What Makes This Unique
Volume Intelligence : Unlike basic FVG indicators, this script incorporates volume analysis to identify the most significant structural imbalances, focusing on quality over quantity.
Visual Clarity Management : Automatic handling of mitigated gaps and memory management ensures your chart remains clean and informative even over extended analysis periods.
Dual-Direction Comprehensive Analysis : Simultaneously tracks both bullish and bearish gaps, providing a complete market structure picture rather than forcing a directional bias.
🔬 How It Works
1. Gap Detection Process :
The indicator examines each candle in relation to previous candles, identifying when a gap forms between the low of candle and high of candle (bearish FVG) or between the high of candle and low of candle (bullish FVG). This specific candle relationship identifies true structural imbalances.
2. Volume Qualification :
For each potential gap, the algorithm calculates the relative volume compared to the configured period average. Only gaps formed with volume exceeding the minimum ratio threshold are displayed, ensuring focus on institutionally significant imbalances.
3. Equilibrium Calculation :
For each qualified gap, the script calculates the precise mathematical midpoint, which becomes the equilibrium line - a key target that price often gravitates toward during mitigation attempts.
4. Mitigation Tracking :
The indicator continuously monitors price action against existing gaps, determining mitigation based on the selected method (wick or close). When price reaches the equilibrium point, the gap is considered mitigated and can be visually updated accordingly.
💡 Note:
Fair Value Gaps represent market inefficiencies that often, but not always, get filled. Use this indicator as part of a complete trading strategy rather than as a standalone system. The most valuable signals typically come from combining FVG analysis with other confirmatory indicators and overall market context. For optimal results, start with the default settings and gradually adjust parameters to match your specific trading timeframe and style.

Crodl Market StructureCrodl Market Structure | FVG | MFI | EMA
The Crodl Market Structure indicator is a powerful trading tool designed to help traders identify key price movements, trend direction, and potential liquidity zones. It combines Fair Value Gaps (FVGs), Money Flow Index (MFI) Trend Filters, and Exponential Moving Averages (EMAs) to provide a structured market view.
Features:
Exponential Moving Averages (EMAs) – Trend Confirmation
Tracks EMA 20, EMA 50, and EMA 200 to identify trend direction.
EMAs change color dynamically based on price action.
Helps traders determine uptrends, downtrends, and potential reversals.
Money Flow Index (MFI) – Trend Strength & Exhaustion
Uses MFI to detect overbought (80) and oversold (20) levels.
Confirms trend exhaustion and highlights potential reversals.
Works with EMAs to generate high-confidence entry signals.
Fair Value Gap (FVG) – Liquidity & Price Imbalance
Identifies Fair Value Gaps (price imbalances) based on 3 consecutive bullish or bearish candles.
Marks liquidity zones where price may return for mitigation.
Toggle ON/OFF to show/hide Fair Value Gaps on the chart.
Smart Buy & Sell Signals
🔺 Bullish Entry Signal: Price crosses above EMA 20 after oversold MFI & downtrend.
🔻 Bearish Entry Signal: Price crosses below EMA 20 after overbought MFI & uptrend.
Helps confirm trend continuation or reversal opportunities.
🔹 How to Use:
1️⃣ Trend Analysis – Check EMAs alignment to identify the overall trend.
2️⃣ Momentum Confirmation – Use MFI to spot trend exhaustion before price reverses.
3️⃣ Liquidity Gaps – Watch for Fair Value Gaps (FVGs) to anticipate price retracements.
🔹 Settings:
EMA Settings: Enable/Disable EMAs, adjust lengths (20, 50, 200).
MFI Trend Filter: Enable/Disable trend signals, customize MFI levels.
Fair Value Gaps: Show/Hide FVGs, adjust extension & colors.

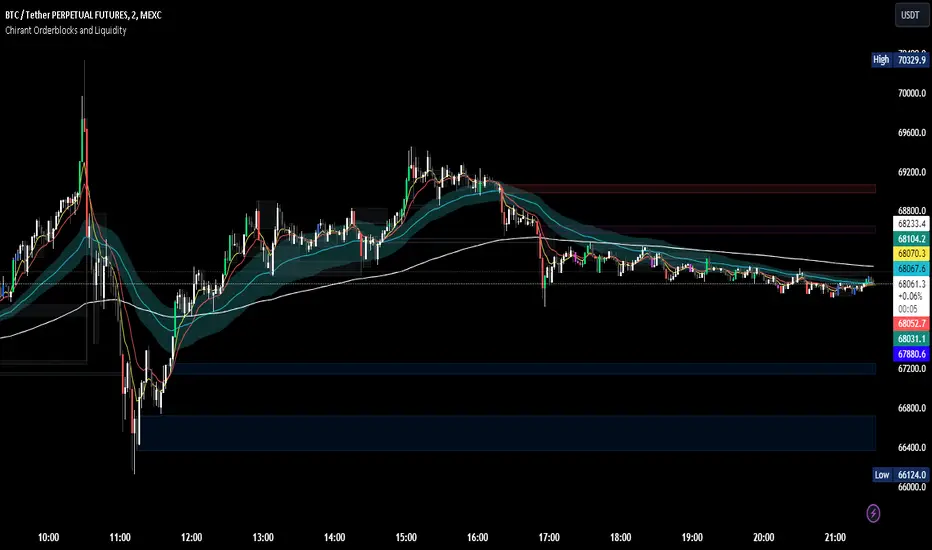
Chirant Orderblocks and LiquidityIntroduction
Our Pivot-Based Order Block Indicator is a cutting-edge trading tool designed to offer traders an unparalleled edge in the markets. This unique indicator combines pivot-based order blocks, fair value gaps, exponential moving averages (EMAs), and vector candles into a cohesive strategy. Unlike traditional indicators, this tool leverages the synergistic effects of these components to identify high-probability trading setups.
How It Works
Pivot-Based Order Blocks: At the heart of our indicator are pivot-based order blocks. These are price levels or ranges that are significant due to past market activity. Our algorithm identifies these blocks based on historical pivot points, considering both the price's reaction to these levels and their recurrence over time. This method helps in pinpointing areas where institutional orders are likely to be placed.
Fair Value Gaps: Alongside, our indicator detects fair value gaps - regions where price has moved too swiftly, leaving a gap in the market's valuation. By identifying these gaps, the tool helps traders anticipate areas where price might return to fill the gap, offering strategic entry and exit points.
EMAs and Vector Candles: To refine our signals, the indicator utilizes a combination of exponential moving averages and vector candles. EMAs help in determining the market's trend direction, while vector candles offer insights into the momentum and strength of price movements. The integration of these elements enables our tool to filter out lower probability setups, focusing on those with higher chances of success.
Originality and Usefulness
Our Pivot-Based Order Block Indicator is not merely a combination of existing tools. It represents a novel approach to market analysis, integrating various components into a single, comprehensive trading strategy. The methodology behind combining pivot-based order blocks with fair value gaps and EMAs, supplemented by the unique use of vector candles, is proprietary and designed to offer original insights into market dynamics.
This tool is invaluable for traders looking to enhance their market analysis, providing a deeper understanding of price movements and potential reversal points. Whether for scalping, day trading, or swing trading, our indicator offers versatile applications, helping traders to navigate the complexities of various market conditions with greater confidence.
How to Use
To make the most of our Pivot-Based Order Block Indicator:
Setup: Apply the indicator to any chart or time frame, tailoring the EMA settings according to your trading style.
Interpretation: Look for confluences between pivot-based order blocks and fair value gaps as high-probability entry points. EMAs will guide you on the trend's direction, while vector candles highlight momentum strength.
Application: Use the indicator to identify potential reversal zones, entry, and exit points. Combine it with your risk management strategy to optimize your trading performance.
Conclusion
Our Pivot-Based Order Block Indicator is crafted for traders who demand depth, precision, and originality in their tools. It stands out by providing a multifaceted approach to market analysis, backed by a proprietary integration of critical trading concepts. This tool is not just an indicator; it's a comprehensive strategy designed to elevate your trading journey.
Smarter Money Concepts - MTF IFVGs [PhenLabs]📊 Smarter Money Concepts - MTF IFVG
Version: PineScript™ v6
📌 Description
This multi-timeframe indicator identifies Inverse Fair Value Gaps (IFVGs) and their inversions across simultaneous chart intervals, helping traders spot liquidity voids and potential reversal zones. By analyzing price action through the lens of institutional order flow patterns, it solves the problem of manual gap tracking across timeframes while incorporating volatility-adjusted parameters and psychological level analysis for higher-probability setups.
🚀 Points of Innovation
• Multi-Timeframe Engine - Simultaneous analysis of 3 higher timeframes
• Adaptive Parameters - Auto-adjusts to market volatility conditions
• Quality Scoring System - Ranks gaps using RVI strength and size metrics
• Inversion Tracking - Monitors failed gaps for counter-trend signals
• Render Optimization - Prevents chart clutter with smart gap management
🔧 Core Components
FVG Detection Logic: Identifies gaps using customizable price source (Close/Wick)
Inversion Tracker: Manages failed gaps and generates counter signals
Multi-Timeframe Engine: Processes 3 independent higher timeframe analyses
Dashboard System: Real-time display of active gaps across all timeframes
🔥 Key Features
• Volatility-adjusted gap size filters (ATR-based)
• Customizable timeframe confluence analysis
• Color-coded quality scoring
• Non-repainting inversion signals
• Mobile-optimized visual rendering
🎨 Visualization
• Colored Boxes: Translucent zones show active gaps (green/bullish, red/bearish)
• Midline Plot: Dashed gray line marks gap midpoint for price targets
• Inversion Markers: Intense colors show failed gaps (dark red/bullish failure, bright green/bearish failure)
• HTF Differentiation: Higher timeframe gaps shown in blue/teal hues
📖 Usage Guidelines
Multi-Timeframe Settings
• Higher Timeframe 1
Default: 30 | Range: Any > Chart TF | Controls primary confluence timeframe
• Show All Timeframes
Default: True | Toggles multi-TF gap displays
Gap Settings
• Source
Default: Close | Options: | Determines gap measurement method
• RVI Period
Default: 14 | Range: 1-50 | Sets momentum confirmation sensitivity
• RVI Value
Default 0.1 | 0 to see all IFVGs | Increase min RVI to see the most powerful IFVGs
✅ Best Use Cases
• Identifying confluence across timeframes
• Spotting institutional order blocks
• High-probability reversal trading
• Trend continuation confirmation
• Volatility breakout setups
⚠️ Limitations
• Repaints historical gap zones
• Requires understanding of FVG concepts
• Higher timeframe data latency
• Quality scores rely on RVI/ATR settings
💡 What Makes This Unique
First FVG indicator with true multi-timeframe processing
Adaptive parameters that auto-adjust to volatility
Quantifiable quality scoring system
Professional-grade dashboard with HTF tracking
🔬 How It Works
Gap Detection: Identifies FVGs using price relationships and RVI confirmation
Inversion Tracking: Monitors price breaches to flag failed gaps
Quality Assessment: Scores gaps based on size, momentum, and location
Adaptive Filtering: Adjusts parameters using ATR-based volatility analysis
Multi-TF Synthesis: Correlates gaps across user-selected timeframes
Visual Rendering: Displays only relevant, active gaps to prevent clutter
💡 Note:
Start with default settings and gradually adjust parameters after observing market interactions. Focus on gaps with quality scores above 7 that align with higher timeframe trends. Combine with price action at psychological levels for highest-probability setups. Remember that higher timeframe gaps generally carry more significance than current chart gaps.

ORB Fusion ML AdaptiveORB FUSION ML - ADAPTIVE OPENING RANGE BREAKOUT SYSTEM
INTRODUCTION
ORB Fusion ML is an advanced Opening Range Breakout (ORB) system that combines traditional ORB methodology with machine learning probability scoring and adaptive reversal trading. Unlike basic ORB indicators, this system features intelligent breakout filtering, failed breakout detection, and complete trade lifecycle management with real-time visual feedback.
This guide explains the theoretical concepts, system components, and educational examples of how the indicator operates.
WHAT IS OPENING RANGE BREAKOUT (ORB)?
Core Concept:
The Opening Range Breakout strategy is based on the observation that the first 15-60 minutes of trading often establish a range that serves as support/resistance for the remainder of the session. Breakouts beyond this range have historically indicated potential directional moves.
How It Works:
Range Formation: System identifies high and low during opening period (default 30 minutes)
Breakout Detection: Monitors price for confirmed breaks above/below range
Signal Generation: Generates signals based on breakout method and filters
Target Projection: Projects extension targets based on range size
Why ORB May Be Effective:
Opening period often represents institutional positioning
Range boundaries historically act as support/resistance
Breakouts may indicate strong directional bias
Failed breakouts may signal reversal opportunities
Note: Historical patterns do not guarantee future occurrences.
SYSTEM COMPONENTS
1. OPENING RANGE DETECTION
Primary ORB:
Default: First 30 minutes of regular trading hours (9:30-10:00 AM ET)
Configurable: 5, 15, 30, or 60-minute ranges
Precision: Optional lower timeframe (LTF) data for exact high/low detection
LTF Precision Mode:
When enabled, system uses 1-minute data to identify precise range boundaries, even on higher timeframe charts. This may improve accuracy of breakout detection.
Session ORBs (Optional):
Asian Session: Typically 00:00-01:00 UTC
London Session: Typically 08:00-09:00 UTC
NY Session: Typically 13:30-14:30 UTC
These provide additional reference levels for 24-hour markets.
2. INITIAL BALANCE (IB)
The Initial Balance concept extends ORB methodology:
Components:
A-Period: First 30 minutes (9:30-10:00)
B-Period: Second 30 minutes (10:00-10:30)
IB Range: Combined high/low of both periods
IB Extensions:
System projects multiples of IB range (0.5×, 1.0×, 1.5×, 2.0×) as potential targets and key reference levels.
Historical Context:
IB methodology was popularized by traders observing that the first hour often establishes the day's trading range. Extensions beyond IB may indicate trend day development.
3. BREAKOUT CONFIRMATION METHODS
The system offers three confirmation methods:
A. Close Beyond Range (Default):
Bullish: Close > ORB High
Bearish: Close < ORB Low
Most balanced approach - requires bar to close beyond level.
B. Wick Beyond Range:
Bullish: High > ORB High
Bearish: Low < ORB Low
Most sensitive - any touch triggers. May generate more signals but higher false breakout rate.
C. Body Beyond Range:
Bullish: Min(Open, Close) > ORB High
Bearish: Max(Open, Close) < ORB Low
Most conservative - entire candle body must be beyond range.
Volume Confirmation:
Optional requirement that breakout occurs on above-average volume (default 1.5× 20-bar average). May filter weak breakouts lacking institutional participation.
4. MACHINE LEARNING PROBABILITY SCORING
The system's key differentiator is ML-based breakout filtering using logistic regression.
How It Works:
Feature Extraction:
When breakout candidate detected, system calculates:
ORB Range / ATR (range size normalization)
Volume Ratio (current vs. average)
VWAP Distance × Direction (alignment)
Gap Size × Direction (overnight gap influence)
Bar Impulse (momentum strength)
Probability Calculation:
pContinue = Probability breakout continues
pFail = Probability breakout fails and reverses
Calculated via logistic regression:
P = 1 / (1 + e^(-z))
where z = β₀ + β₁×Feature₁ + β₂×Feature₂ + ...
Coefficient Examples (User Configurable):
pContinue Model:
Intercept: -0.20 (slight bearish bias)
ORB Range/ATR: +0.80 (larger ranges favored)
Volume Ratio: +0.60 (higher volume increases probability)
VWAP Alignment: +0.50 (aligned with VWAP helps)
pFail Model:
Intercept: -0.30 (assumes most breakouts valid)
Volume Ratio: -0.50 (low volume increases failure risk)
VWAP Alignment: -0.90 (breaking away from VWAP risky)
ML Gating:
When enabled, breakout only signaled if:
pContinue ≥ Minimum Threshold (default 55%)
pFail ≤ Maximum Threshold (default 35%)
This filtering aims to reduce false breakouts by requiring favorable probability scores.
Model Training:
Users should backtest and optimize coefficients for their specific instrument and timeframe. Default values are educational starting points, not guaranteed optimal parameters.
Educational Note: ML models assume past feature relationships continue into the future. Market conditions may change in ways not captured by historical data.
5. FAILED BREAKOUT DETECTION & REVERSAL TRADING
A unique feature is automatic detection of failed breakouts and generation of counter-trend reversal setups.
Detection Logic:
Failure Conditions:
For Bullish Breakout that fails:
- Initially broke above ORB High
- After N bars (default 3), price closes back inside range
- Must close below (ORB High - Buffer)
- Buffer = ATR × 0.1 (default)
For Bearish Breakout that fails:
- Initially broke below ORB Low
- After N bars, price closes back inside range
- Must close above (ORB Low + Buffer)
Automatic Reversal Entry:
When failure detected, system automatically:
Generates reversal entry at current close
Sets stop loss beyond recent extreme + small buffer
Projects 3 targets based on ORB range multiples
Target Calculations:
For failed bullish breakout (now SHORT):
Entry = Close (when failure confirmed)
Stop = Recent High + (ATR × 0.10)
T1 = ORB High - (ORB Range × 0.5) // 50% retracement
T2 = ORB High - (ORB Range × 1.0) // Full retracement
T3 = ORB High - (ORB Range × 1.5) // Beyond opposite boundary
Trade Lifecycle Management:
The system tracks reversal trades in real-time through multiple states:
State 0: No trade
State 1: Breakout active (monitoring for failure)
State 2: Breakout failed (not used currently)
State 3: Reversal entry taken
State 4: Target 1 hit
State 5: Target 2 hit
State 6: Target 3 hit
State 7: Stopped out
State 8: Complete
Real-Time Tracking:
MFE (Maximum Favorable Excursion): Best price achieved
MAE (Maximum Adverse Excursion): Worst price against position
Dynamic Lines & Labels: Visual updates as trade progresses
Color Coding: Green for hit targets, gray for stopped trades
Visual Feedback:
Entry line (solid when active, dotted when stopped)
Stop loss line (red dashed)
Target lines (green when hit, gray when stopped)
Labels update in real-time with status
This complete lifecycle tracking provides educational insight into trade development and risk/reward realization.
Educational Context: Failed breakouts are a recognized pattern in technical analysis. The theory is that trapped traders may need to exit, creating momentum in the opposite direction. However, not all failed breakouts result in profitable reversals.
6. EXTENSION TARGETS
System projects Fibonacci-based extension levels beyond ORB boundaries.
Bullish Extensions (Above ORB High):
1.272× (ORB High + ORB Range × 0.272)
1.5× (ORB High + ORB Range × 0.5)
1.618× (ORB High + ORB Range × 0.618)
2.0× (ORB High + ORB Range × 1.0)
2.618× (ORB High + ORB Range × 1.618)
3.0× (ORB High + ORB Range × 2.0)
Bearish Extensions (Below ORB Low):
Same multipliers applied below ORB Low
Visual Representation:
Dotted lines until reached
Solid lines after price touches level
Color coding (green for bullish, red for bearish)
These serve as potential profit targets and key reference levels.
7. DAY TYPE CLASSIFICATION
System attempts to classify trading day based on price movement relative to Initial Balance.
Classification Logic:
IB Extension = (Current Price - IB Boundary) / IB Range
Day Types:
Trend Day: Extension ≥ 1.5× IB Range
- Strong directional movement
- Price extends significantly beyond IB
Normal Day: Extension between 0.5× and 1.5×
- Moderate movement
- Some extension but not extreme
Rotation Day: Price stays within IB
- Range-bound conditions
- Limited directional conviction
Historical Context:
Day type classification comes from market profile analysis, suggesting different trading approaches for different conditions. However, classification is backward-looking and may change throughout the session.
8. VWAP INTEGRATION
Volume-Weighted Average Price included as institutional reference level.
Calculation:
VWAP = Σ(Typical Price × Volume) / Σ(Volume)
Typical Price = (High + Low + Close) / 3
Standard Deviation Bands:
Band 1: VWAP ± 1.0 σ
Band 2: VWAP ± 2.0 σ
Usage:
Alignment with VWAP may indicate institutional support
Distance from VWAP factored into ML probability scoring
Bands suggest potential overbought/oversold extremes
Note: VWAP is widely used by institutional traders as a benchmark, but this does not guarantee its predictive value.
9. GAP ANALYSIS
Tracks overnight gaps and fill statistics.
Gap Detection:
Gap Size = Open - Previous Close
Classification:
Gap Up: Gap > ATR × 0.1
Gap Down: Gap < -ATR × 0.1
No Gap: Otherwise
Gap Fill Tracking:
Monitors if price returns to previous close
Calculates fill rate over time
Displays previous close as reference level
Historical Context:
Market folklore suggests "gaps get filled," though statistical evidence varies by market and timeframe.
10. MOMENTUM CANDLE VISUALIZATION
Optional colored boxes around candles showing position relative to ORB.
Color Coding:
Blue: Inside ORB range
Green: Above ORB High (bullish momentum)
Red: Below ORB Low (bearish momentum)
Bright Green: Breakout bar
Orange: Failed breakout bar
Gray: Stopped out bar
Lime: Target hit bar
Provides quick visual context of price location and key events.
DISPLAY MODES
Three complexity levels to suit different user preferences:
SIMPLE MODE
Minimal display focusing on essentials:
✓ Primary ORB levels (High, Low, Mid)
✓ Basic breakout signals
✓ Essential dashboard metrics
✗ No session ORBs
✗ No IB analysis
✗ No extensions
Best for: Clean charts, beginners, focus on core ORB only
STANDARD MODE
Balanced feature set:
✓ Primary ORB levels
✓ Initial Balance with extensions
✓ Session ORBs (Asian, London, NY)
✓ VWAP with bands
✓ Breakout and reversal signals
✓ Gap analysis
✗ Detailed statistics
Best for: Most traders, good balance of information and clarity
ADVANCED MODE
Full feature set:
✓ All Standard features
✓ ORB extensions (1.272×, 1.5×, 1.618×, 2.0×, etc.)
✓ Complete statistics dashboard
✓ Detailed performance metrics
✓ All visual enhancements
Best for: Experienced users, research, full analysis
DASHBOARD INTERPRETATION
Main Dashboard Sections:
ORB Status:
Status: Complete / Building / Waiting
Range: Actual range size in price units
Trade State:
State: Current trade status (see 8 states above)
Vol: Volume confirmation (Confirmed / Low)
Targets (when reversal active):
T1, T2, T3: Hit / Pending / Stopped
Color: Green = hit, Gray = pending or stopped
ML Section (when enabled):
ML: ON Pass / ON Reject / OFF
pC/pF: Probability scores as percentages
Setup:
Action: LONG / SHORT / REVERSAL / FADE / WAIT
Grade: A+ to D based on confidence
Status: ACTIVE / STOPPED / T1 HIT / etc.
Conf: Confidence percentage
Context:
Bias: Overall market direction assessment
VWAP: Above / Below / At VWAP
Gap: Gap type and fill status
Statistics (Advanced Mode):
Bull WR: Bullish breakout win rate
Bear WR: Bearish breakout win rate
Rev WR: Reversal trade win rate
Rev Count: Total reversals taken
Narrative Dashboard:
Plain-language interpretation:
Phase: Building ORB / Trading Phase / Pre-market
Status: Current market state in plain English
ML: Probability scores
Setup: Trade recommendation with grade
All metrics based on historical simulation, not live trading results.
USAGE GUIDELINES - EDUCATIONAL EXAMPLES
Getting Started:
Step 1: Chart Setup
Add indicator to chart
Select appropriate timeframe (1-5 min recommended for ORB trading)
Choose display mode (start with Standard)
Step 2: Opening Range Formation
During first 30 minutes (9:30-10:00 ET default)
Watch ORB High/Low levels form
Note range size relative to ATR
Step 3: Breakout Monitoring
After ORB complete, watch for breakout candidates
Check ML scores if enabled
Verify volume confirmation
Step 4: Signal Evaluation
Consider confidence grade
Review trade state and targets
Evaluate risk/reward ratio
Interpreting ML Scores:
Example 1: High Probability Breakout
Breakout: Bullish
pContinue: 72%
pFail: 18%
ML Status: Pass
Grade: A
Interpretation:
- High continuation probability
- Low failure probability
- Passes ML filter
- May warrant consideration
Example 2: Rejected Breakout
Breakout: Bearish
pContinue: 48%
pFail: 52%
ML Status: Reject
Grade: D
Interpretation:
- Low continuation probability
- High failure probability
- ML filter blocks signal
- Small 'X' marker shows rejection
Note: ML scores are mathematical outputs based on historical data. They do not guarantee outcomes.
Reversal Trade Example:
Scenario:
9:45 AM: Bullish breakout above ORB High
9:46 AM: Price extends to +0.8× ORB range
9:48 AM: Price reverses, closes back below ORB High
9:49 AM: Failure confirmed (3 bars inside range)
System Response:
- Marks failed breakout with 'FAIL' label
- Generates SHORT reversal entry
- Sets stop above recent high
- Projects 3 targets
- Trade State → 3 (Reversal Active)
- Entry line and targets display
Potential Outcomes:
- Stop hit → State 7 (Stopped), lines gray out
- T1 hit → State 4, T1 line turns green
- T2 hit → State 5, T2 line turns green
- T3 hit → State 6, T3 line turns green
All tracked in real-time with visual updates.
Risk Management Considerations:
Position Sizing Example:
Account: $25,000
Risk per trade: 1% = $250
Stop distance: 1.5 ATR = $150 per share
Position size: $250 / $150 = 1.67 shares (round to 1)
Stop Loss Guidelines:
Breakout trades: ORB midpoint or opposite boundary
Reversal trades: System-provided stop (recent extreme + buffer)
Never widen system stops
Target Management:
Consider scaling out at T1, T2, T3
Trail stops after T1 reached
Full exit if stopped
These are educational examples, not recommendations. Users must develop their own risk management based on personal tolerance and account size.
OPTIMIZATION SUGGESTIONS
For Stock Indices (ES, NQ):
Suggested Settings:
ORB Timeframe: 30 minutes
Confirmation: Close
Volume Filter: ON (1.5×)
ML Filter: ON
Display Mode: Standard
Rationale:
30-min ORB standard for equity indices
Close confirmation balances speed and reliability
Volume important for institutional participation
ML helps filter noise
Historical Observation:
Indices often respect ORB levels during regular hours.
For Individual Stocks:
Suggested Settings:
ORB Timeframe: 5-15 minutes
Confirmation: Close or Body
Volume Filter: ON (1.8-2.0×)
RTH Only: ON
Failed Breakouts: ON
Rationale:
Shorter ORB may be appropriate for volatile stocks
Volume critical to filter low-liquidity moves
RTH avoids pre-market noise
Failed breakouts common in stocks
For Forex:
Suggested Settings:
ORB Timeframe: 60 minutes
Session ORBs: ON (Asian, London)
Volume Filter: OFF or low threshold
24-hour mode: ON
Rationale:
Forex trades 24 hours, need session awareness
Volume data less reliable in forex
Longer ORB for slower forex movement
For Crypto:
Suggested Settings:
ORB Timeframe: 30-60 minutes
Confirmation: Body (more conservative)
Volume Filter: ON (2.0×+)
Display Mode: Advanced
Rationale:
High volatility requires conservative confirmation
Volume crucial to distinguish real moves from noise
24-hour market benefits from multiple session ORBs
ML COEFFICIENT TUNING
Users can optimize ML model coefficients through backtesting.
Approach:
Data Collection: Review rejected breakouts - were they correct to reject?
Pattern Analysis: Which features correlate with success/failure?
Coefficient Adjustment: Increase weights for predictive features
Threshold Tuning: Adjust minimum pContinue and maximum pFail
Validation: Test on out-of-sample data
Example Optimization:
If finding:
High-volume breakouts consistently succeed
Low-volume breakouts often fail
Action:
Increase pCont w(Volume Ratio) from 0.60 to 0.80
Increase pFail w(Volume Ratio) magnitude (more negative)
If finding:
VWAP alignment highly predictive
Gap direction not helpful
Action:
Increase pCont w(VWAP Distance×Dir) from 0.50 to 0.70
Decrease pCont w(Gap×Dir) toward 0.0
Important: Optimization should be done on historical data and validated on out-of-sample periods. Overfitting to past data does not guarantee future performance.
STATISTICS & PERFORMANCE TRACKING
System maintains comprehensive statistics:
Breakout Statistics:
Total Days: Number of trading days analyzed
Bull Breakouts: Total bullish breakouts
Bull Wins: Breakouts that reached 2.0× extension
Bull Win Rate: Percentage that succeeded
Bear Breakouts: Total bearish breakouts
Bear Wins: Breakouts that reached 2.0× extension
Bear Win Rate: Percentage that succeeded
Reversal Statistics:
Reversals Taken: Total failed breakouts traded
T1 Hit: Number reaching first target
T2 Hit: Number reaching second target
T3 Hit: Number reaching third target
Stopped: Number stopped out
Reversal Win Rate: Percentage reaching at least T1
Day Type Statistics:
Trend Days: Days with 1.5×+ IB extension
Normal Days: Days with 0.5-1.5× extension
Rotation Days: Days staying within IB
Extension Statistics:
Average Extension: Mean extension level reached
Max Extension: Largest extension observed
Gap Statistics:
Total Gaps: Number of significant gaps
Gaps Filled: Number that filled during session
Gap Fill Rate: Percentage filled
Note: All statistics based on indicator's internal simulation logic, not actual trading results. Past statistics do not predict future outcomes.
ALERTS
Customizable alert system for key events:
Available Alerts:
Breakout Alert:
Trigger: Initial breakout above/below ORB
Message: Direction, price, volume status, ML scores, grade
Frequency: Once per bar
Failed Breakout Alert:
Trigger: Breakout failure detected
Message: Reversal setup with entry, stop, and 3 targets
Frequency: Once per bar
Extension Alert:
Trigger: Price reaches extension level
Message: Extension multiple and price level
Frequency: Once per bar per level
IB Break Alert:
Trigger: Price breaks Initial Balance
Message: Potential trend day warning
Frequency: Once per bar
Reversal Stopped Alert:
Trigger: Reversal trade hits stop loss
Message: Stop level and original entry
Frequency: Once per bar
Target Hit Alert:
Trigger: T1, T2, or T3 reached
Message: Which target and price level
Frequency: Once per bar
Users can enable/disable alerts individually based on preferences.
VISUAL CUSTOMIZATION
Extensive visual options:
Color Schemes:
All colors fully customizable:
ORB High, Low, Mid colors
Extension colors (bull/bear)
IB colors
VWAP colors
Momentum box colors
Session ORB colors
Display Options:
Line widths (1-5 pixels)
Box transparencies (50-95%)
Fill transparencies (80-98%)
Momentum box transparency
Label Behavior:
Label Modes:
All: Always show all labels
Adaptive: Fade labels far from price
Minimal: Only show labels very close to price
Label Proximity:
Adjustable threshold (1.0-5.0× ATR)
Labels beyond threshold fade or hide
Reduces clutter on wide-range charts
Gradient Fills:
Optional gradient zones between levels:
ORB High to Mid (bullish gradient)
ORB Mid to Low (bearish gradient)
Creates visual "heatmap" of tension
FREQUENTLY ASKED QUESTIONS
Q: What timeframe should I use?
A: ORB methodology is typically applied to intraday charts. Suggestions:
1-5 min: Active trading, multiple setups per day
5-15 min: Balanced view, clearer signals
15-30 min: Higher timeframe confirmation
The indicator works on any timeframe, but ORB is traditionally an intraday concept.
Q: Do I need the ML filter enabled?
A: This is a user choice:
ML Enabled:
Fewer signals
Potentially higher quality (filters low-probability)
Requires coefficient optimization
More complex
ML Disabled:
More signals
Simpler operation
Traditional ORB approach
May include lower-quality breakouts
Consider paper trading both approaches to determine preference.
Q: How should I interpret pContinue and pFail?
A: These are probability estimates from the logistic regression model:
pContinue 70% / pFail 25%: Model suggests favorable continuation odds
pContinue 45% / pFail 55%: Model suggests breakout likely to fail
pContinue 60% / pFail 35%: Borderline, depends on thresholds
Remember: These are mathematical outputs based on historical feature relationships. They are not certainties.
Q: Should I always take reversal trades?
A: Reversal trades are optional setups. Considerations:
Potential Advantages:
Trapped traders may need to exit
Clear stop loss levels
Defined targets
Potential Risks:
Counter-trend trading
Original breakout may resume
Requires quick reaction
Users should evaluate reversal setups like any other trade based on personal strategy and risk tolerance.
Q: What if ORB range is very small?
A: Small ranges may indicate:
Low volatility session opening
Potential for expansion later
Less reliable breakout levels
Considerations:
Larger ranges often more significant
Small ranges may need wider stops relative to range
ORB Range/ATR ratio helps normalize
The ML model includes this via the ORB Range/ATR feature.
Q: Can I use this on stocks, forex, crypto?
A: System is adaptable:
Stocks: Designed primarily for stock indices and equities. Use RTH mode.
Forex: Enable session ORBs. Volume filter less relevant. Adjust for 24-hour nature.
Crypto: Very volatile. Consider conservative confirmation method (Body). Higher volume thresholds.
Each market has unique characteristics. Extensive testing recommended.
Q: How do I optimize ML coefficients?
A: Systematic approach:
Collect data on 50-100+ breakouts
Note which succeeded/failed
Analyze feature values for each
Identify correlations
Adjust coefficients to emphasize predictive features
Validate on different time period
Iterate
Alternatively, use regression analysis on historical breakout data if you have programming skills.
Q: What does "Stopped Out" mean for reversals?
A: Reversal trade hit its stop loss:
Price moved against reversal position
Original breakout may have resumed
Trade closed at loss
Lines and labels gray out
Trade State → 7
This is part of normal trading - not all reversals succeed.
Q: Can I change ORB timeframe intraday?
A: ORB timeframe setting affects the next day's ORB. Current day's ORB remains fixed. To see different ORB sizes, you would need to change setting and wait for next session.
Q: Why do rejected breakouts show an 'X'?
A: When "Mark Rejected Breakout Candidates" enabled:
Small 'X' appears when ML filter rejects a breakout
Shows where system prevented a signal
Useful for model calibration
Helps evaluate if ML making good decisions
You can disable this marker if it creates clutter.
ADVANCED CONCEPTS
1. Adaptive vs. Static ORB:
Traditional ORB uses fixed time windows. This system adds adaptability through:
ML probability scoring (adapts to current conditions)
Multiple session ORBs (adapts to global markets)
Failed breakout detection (adapts when setup fails)
Real-time trade management (adapts as trade develops)
This creates a more dynamic approach than simple static levels.
2. Confluence Scoring:
System internally calculates confluence (agreement of factors):
Breakout direction
Volume confirmation
VWAP alignment
ML probability scores
Gap direction
Momentum strength
Higher confluence typically results in higher grade (A+, A, B+, etc.).
3. Trade State Machine:
The 8-state system provides complete trade lifecycle:
State 0: Waiting → No setup
State 1: Breakout → Monitoring for failure
State 2: Failed → (transition state)
State 3: Reversal Active → In counter-trend position
State 4: T1 Hit → First target reached
State 5: T2 Hit → Second target reached
State 6: T3 Hit → Third target reached (full success)
State 7: Stopped → Hit stop loss
State 8: Complete → Trade resolved
Each state has specific visual properties and logic.
4. Real-Time Performance Attribution:
MFE/MAE tracking provides insight:
Maximum Favorable Excursion (MFE):
Best price achieved during trade
Shows potential if optimal exit used
Educational metric for exit strategy analysis
Maximum Adverse Excursion (MAE):
Worst price against position
Shows drawdown during trade
Helps evaluate stop placement
These appear in Narrative Dashboard during active reversals.
THEORETICAL FOUNDATIONS
Why Opening Range Matters:
Several theories support ORB methodology:
1. Information Incorporation:
Opening period represents initial consensus on overnight news and pre-market sentiment. Range boundaries may reflect this information.
2. Order Flow:
Institutional traders often execute during opening period, establishing supply/demand zones.
3. Behavioral Finance:
Traders psychologically anchor to opening range levels. Self-fulfilling prophecy may strengthen these levels.
4. Market Microstructure:
Opening auction establishes price discovery. Breaks beyond may indicate new information or momentum.
Academic Note: While ORB is widely used, academic evidence on its effectiveness varies. Like all technical analysis, it should be evaluated empirically for each specific application.
Machine Learning in Trading:
This system uses supervised learning (logistic regression):
Advantages:
Interpretable (can see feature weights)
Fast calculation
Probabilistic output
Well-understood mathematically
Limitations:
Assumes linear relationships
Requires feature engineering
Needs periodic retraining
Not adaptive to regime changes automatically
More sophisticated ML (neural networks, ensemble methods) could potentially improve performance but at cost of interpretability and speed.
Failed Breakouts & Market Psychology:
Failed breakout trading exploits several concepts:
1. Stop Hunting:
Large players may push price to trigger stops, then reverse.
2. False Breakouts:
Insufficient conviction leads to failed breakout and quick reversal.
3. Trapped Traders:
Those who entered breakout now forced to exit, creating momentum opposite direction.
4. Mean Reversion:
After failed directional attempt, price may revert to range or beyond.
These are theoretical frameworks, not guaranteed patterns.
BEST PRACTICES - EDUCATIONAL SUGGESTIONS
1. Paper Trade Extensively:
Before live trading:
Test on historical data
Forward test in real-time (paper)
Evaluate statistics over 50+ occurrences
Understand system behavior in different conditions
2. Start with Simple Mode:
Initial learning:
Use Simple or Standard mode
Focus on primary ORB only
Master basic breakout interpretation
Add features incrementally
3. Optimize ML Coefficients:
If using ML filter:
Backtest on your specific instrument
Note which features predictive
Adjust coefficients systematically
Validate on out-of-sample data
Re-optimize periodically
4. Respect Risk Management:
Always:
Define maximum risk per trade (1-2% recommended)
Use system-provided stops
Size positions appropriately
Never override stops wider
Keep statistics of your actual trading
b]5. Understand Context:
Consider:
Is it a trending or ranging market?
What's the day type developing?
Is volume confirming moves?
Are you aligned with VWAP?
What's the overall market condition?
Context may inform which setups to emphasize.
6. Journal Results:
Track:
Which setup types work best for you
Your execution quality
Emotional responses to different scenarios
Missed opportunities and why
Losses and lessons
Systematic journaling improves over time.
FINAL EDUCATIONAL SUMMARY
ORB Fusion ML combines traditional Opening Range Breakout methodology with modern
enhancements:
✓ ML Probability Scoring: Filters breakouts using logistic regression
✓ Failed Breakout Detection: Automatic reversal trade generation
✓ Complete Trade Management: Real-time tracking with visual updates
✓ Multi-Session Support: Asian, London, NY ORBs for global markets
✓ Institutional Reference: VWAP and Initial Balance integration
✓ Comprehensive Statistics: Track performance across breakout types
✓ Full Customization: Three display modes, extensive visual options
✓ Educational Transparency: Dashboard shows all relevant metrics
This is an educational tool demonstrating advanced ORB concepts.
Critical Reminders:
The system:
✓ Identifies potential ORB breakout and reversal setups
✓ Provides ML-based probability estimates
✓ Tracks trades through complete lifecycle
✓ Offers comprehensive performance statistics
Users must understand:
✓ No system guarantees profitable results
✓ Past performance does not predict future results
✓ All indicators require proper risk management
✓ Paper trading essential before live trading
✓ Market conditions change unpredictably
✓ This is educational software, not financial advice
Success requires: Proper education, disciplined risk management, realistic expectations, personal responsibility for all trading decisions, and understanding that indicators are tools, not crystal balls.
For Educational Use Only - ORB Fusion ML Development Staff
⚠️ FINAL DISCLAIMER
This indicator and documentation are provided strictly for educational and informational purposes.
NOT FINANCIAL ADVICE: Nothing in this guide constitutes financial advice, investment advice, trading advice, or any recommendation to buy or sell any security or engage in any trading strategy.
NO GUARANTEES: No representation is made that any account will or is likely to achieve profits or losses similar to those shown. The statistics, probabilities, and examples are from historical backtesting and do not represent actual trading results.
SUBSTANTIAL RISK: Trading involves substantial risk of loss and is not suitable for every investor. The high degree of leverage can work against you as well as for you.
YOUR RESPONSIBILITY: You are solely responsible for your own trading decisions. You should conduct your own research, perform your own analysis, paper trade extensively, and consult with qualified financial advisors before making any trading decisions.
NO LIABILITY: The developers, contributors, and distributors of this indicator disclaim all liability for any losses or damages, direct or indirect, that may result from use of this indicator or reliance on any information provided.
PAPER TRADE FIRST: Users are strongly encouraged to thoroughly test this indicator in a paper trading environment before risking any real capital.
By using this indicator, you acknowledge that you have read this disclaimer, understand the substantial risks involved in trading, and agree that you are solely responsible for your own trading decisions and their outcomes.
Educational Software Only | Trade at Your Own Risk | Not Financial Advice
Taking you to school. — Dskyz, Trade with insight. Trade with anticipation.

Gap ZonesThis TradingView indicator automatically detects daily price gaps and plots them clearly on any timeframe (intraday or daily).
It helps visualize where unfilled gaps are sitting, track whether they’ve been filled, and control how far the zone extends.
Key Features
1. Daily Gap Detection
• Works even when you’re on intraday charts (uses daily OHLC data).
• Marks both gap up (potential support zones) and gap down (potential resistance zones).
2. Shaded Gap Zones
• Each gap is highlighted as a band (greenish for up, reddish for down).
• Option to turn shading off if you just want horizontal lines.
3. Hide When Filled
• Once price closes or touches the far side of the gap, it disappears (configurable: Touch vs Close).
4. Lookback Window
• Gaps only show if they occurred within the past X trading days (default: 30).
• Prevents your chart from being cluttered with ancient gaps.
5. Multiple Gaps Tracked
• Can track up to 5 recent gaps simultaneously.
• Oldest gaps “roll off” as new ones form.
6. Finite Right-Edge Guides
• Optional horizontal guide lines extend to the right, but only for a fixed number of bars (default: 50).
• Cleaner than infinite extensions.
7. Gap-Day Marker
• Optional vertical line drawn on the bar where the gap first occurred.
⸻
⚙️ Inputs & Settings
When you apply the indicator, you’ll see these options:
• Lookback (trading days): How far back to scan for gaps (default 30).
• Max gaps to show (1..5): How many simultaneous gap zones to display.
• Min gap size (% of prior close): Filter out tiny gaps (default 0.25%).
• Hide gaps once filled: Removes a gap from the chart once filled.
• Fill rule uses CLOSE (off = Touch):
• Touch = filled when price trades through the level intraday.
• Close = filled only when a candle close crosses it.
• Show shading: Toggle zone fills on/off.
• Show vertical marker on gap day: Toggle gap-day marker line.
• Show finite right-edge lines: Toggle horizontal lines extending right.
• Right line length (bars): How far those lines extend (default 50 bars).
⸻
🟢 How to Use It
1. Apply on Any Chart
• Works best on daily or intraday (5m, 15m, 1h).
• Gaps are always calculated from daily data, so intraday charts will show higher-timeframe gaps correctly.
2. Interpret Colors
• Green shading = Gap Up (often acts as support).
• Red shading = Gap Down (often acts as resistance).
3. Watch for Fills
• When price re-enters the gap zone, the indicator checks if it’s “filled” (based on your Touch/Close setting).
• If “Hide When Filled” is on, the zone vanishes.
4. Trade Context
• Many traders use gaps as targets (expecting a fill) or levels of support/resistance.
• Combined with your bull put/bear call spread strategies, it helps confirm strong levels.

Smart Money Flow TrackerSmart Money Flow Tracker - Liquidity & Fair Value Gap Indicator
Overview
The Smart Money Flow Tracker is a comprehensive Pine Script indicator designed to identify and analyze institutional trading patterns through liquidity prints and Fair Value Gaps (FVGs). This advanced tool combines multiple analytical approaches to help traders understand where smart money is operating in the market, providing crucial insights for better trade timing and market structure analysis.
Core Functionality
1. Liquidity Prints Detection
The indicator identifies liquidity prints by analyzing pivot highs and lows that represent potential areas where institutional orders may be resting. Key features include:
Pivot-Based Analysis: Uses configurable pivot lengths (default 5) to identify significant highs and lows
Volume Confirmation: Optional volume filter ensures liquidity prints occur during periods of significant trading activity
Dynamic Labeling: Visual markers on chart showing liquidity print locations with customizable colors
Success Rate Tracking: Monitors how often liquidity prints lead to meaningful price reactions
2. Fair Value Gap (FVG) Analysis with Volume Integration
Advanced FVG detection that goes beyond basic gap identification:
Three-Bar Pattern Recognition: Identifies gaps where the high of bar 1 is below the low of bar 3 (bullish) or low of bar 1 is above high of bar 3 (bearish)
Volume-Enhanced Detection: Incorporates comprehensive volume analysis including:
Average volume calculation over configurable periods
Total volume across the 3-bar FVG pattern
Dominant volume bar identification
Volume ratio calculations for strength assessment
Volume Threshold Filtering: Optional minimum volume requirements to filter out low-conviction FVGs
Visual Enhancement: FVG boxes with volume-based coloring and detailed volume labels
3. Comprehensive Statistics Dashboard
Real-time statistics table displaying:
Total liquidity prints detected
Success rate percentage with dynamic color coding
Volume filter status
Total Fair Value Gaps identified
High-volume FVG count and percentage
All metrics update in real-time as new data becomes available
4. Advanced Alert System
Multiple alert conditions for different scenarios:
Standard liquidity print detection
Volume-confirmed liquidity prints
Bullish and bearish FVG formation
High-volume FVG alerts for institutional-grade setups
Key Input Parameters
Display Controls
Show Liquidity Prints: Toggle main functionality on/off
Show Statistics Table: Control visibility of the analytics dashboard
Show Fair Value Gaps: Enable/disable FVG detection and display
Technical Settings
Pivot Length: Adjusts sensitivity of liquidity print detection (1-20 range)
Volume Confirmation: Requires above-average volume for liquidity print validation
Volume Lookback: Period for calculating average volume (5-50 bars)
FVG Volume Settings
Show FVG Volume Info: Display detailed volume metrics on FVG labels
FVG Volume Threshold: Minimum volume multiplier for high-volume FVG classification
FVG Volume Average Period: Lookback period for FVG volume calculations
Visual Customization
Bullish/Bearish Colors: Separate color schemes for different market directions
Text Colors: Bright lime green for optimal visibility on all background types
Table Positioning: Flexible placement options for the statistics dashboard
Trading Applications & Use Cases
1. Institutional Order Flow Analysis
Liquidity Hunting: Identify areas where institutions may be targeting retail stops
Smart Money Tracking: Follow institutional footprints through volume-confirmed liquidity prints
Market Structure Understanding: Recognize key levels where large orders are likely resting
2. Fair Value Gap Trading Strategies
Gap Fill Trading: Trade the statistical tendency of FVGs to get filled
Volume-Confirmed Entries: Use high-volume FVGs as higher-probability trade setups
Institutional FVG Recognition: Focus on FVGs with dominant volume bars indicating institutional participation
3. Multi-Timeframe Analysis
Higher Timeframe Context: Use on daily/weekly charts to identify major institutional levels
Intraday Precision: Apply to lower timeframes for precise entry and exit timing
Cross-Timeframe Confirmation: Combine signals across multiple timeframes for enhanced accuracy
4. Risk Management Applications
Stop Loss Placement: Use liquidity print levels as logical stop loss areas
Position Sizing: Adjust position sizes based on volume confirmation and success rates
Trade Filtering: Use statistics dashboard to assess current market conditions
Technical Logic & Methodology
Liquidity Print Algorithm
Pivot Identification: Scans for pivot highs/lows using the specified lookback period
Volume Validation: Optionally confirms prints occur during above-average volume periods
Success Tracking: Monitors subsequent price action to calculate effectiveness rates
Dynamic Updates: Continuously updates statistics as new data becomes available
FVG Detection Process
Pattern Recognition: Identifies 3-bar patterns with qualifying gaps
Volume Analysis: Calculates comprehensive volume metrics across the pattern
Strength Assessment: Determines volume ratios and dominant bars
Classification: Categorizes FVGs based on volume thresholds and characteristics
Visual Representation: Creates boxes and labels with volume-based styling
Statistical Framework
Real-time Calculations: All metrics update with each new bar
Percentage-based Metrics: Success rates and volume confirmations shown as percentages
Color-coded Feedback: Visual indicators for quick assessment of current conditions
Historical Tracking: Maintains running totals throughout the session
Best Practices for Usage
1. Parameter Optimization
Start with default settings and adjust based on market conditions
Lower pivot lengths for more sensitive detection on volatile instruments
Higher volume thresholds for cleaner signals in high-volume markets
2. Market Context Consideration
Combine with broader market structure analysis
Consider economic events and news that may affect institutional flow
Adjust expectations based on market volatility and liquidity conditions
3. Integration with Other Analysis
Use alongside support/resistance levels for confluence
Combine with momentum indicators for timing confirmation
Integrate with volume profile analysis for additional context
Conclusion
The Smart Money Flow Tracker represents a sophisticated approach to institutional flow analysis, combining traditional liquidity concepts with modern volume analytics. By providing both visual signals and comprehensive statistics, it enables traders to make more informed decisions based on where smart money is likely operating in the market. The indicator's flexibility and customization options make it suitable for various trading styles and timeframes, from scalping to position trading.

FVG Range Filter0x278's FVG Range Filter
Overview
The FVG Range Filter is a TradingView indicator designed to identify and display Fair Value Gaps (FVGs) on your chart. FVGs are areas of price imbalance that often act as significant zones for potential price retracement or reversal. This indicator filters out irrelevant gaps, showing only those that are within a specified price range and time frame, making it easier to focus on high-probability trading opportunities.
This guide is crafted to help both novice and experienced traders understand how to use this indicator effectively, even if you're new to the concept of FVG trading. We'll cover what FVGs are, how the indicator works, how to interpret its visual elements, and how to apply it in various trading scenarios.
What are Fair Value Gaps (FVGs)?
Fair Value Gaps occur when the price of an asset moves so quickly in one direction that it leaves a 'gap' or 'void' on the chart where no trading activity occurred. These gaps represent areas of imbalance between supply and demand, often created by strong buying or selling pressure. Traders use FVGs to identify potential areas where price might return to 'fill' the gap, offering opportunities for entries or exits.
Bullish FVG : This happens when price jumps upward, leaving a gap below. It suggests strong buying pressure and often acts as a support zone when price retraces.
Bearish FVG : This occurs when price drops sharply, leaving a gap above. It indicates strong selling pressure and often acts as a resistance zone when price retraces.
How the FVG Range Filter Works
The FVG Range Filter indicator automatically detects these gaps based on a specific three-bar pattern that identifies significant price imbalances. It then applies filters to ensure only relevant FVGs are displayed:
Range Filter : Only shows FVGs whose midpoint is within a user-defined percentage of the current price. This keeps the focus on gaps that are close enough to be actionable.
Time Filter : Only displays FVGs that are younger than a specified number of bars, ensuring you're looking at recent and relevant price action.
Invalidation : Once the price trades through the midpoint of an FVG, the gap is considered 'filled' or invalidated, and it is removed from the chart.
This filtering mechanism declutters your chart, highlighting only the most pertinent FVGs for your trading decisions.
Indicator Settings
The FVG Range Filter offers customizable inputs to tailor its behavior to your trading style:
Display Range (%) : This sets the percentage range from the current price within which FVGs are shown. A lower value (e.g., 1.0%) shows only gaps very close to the current price, while a higher value (e.g., 5.0%) includes gaps further away. Default is 1.0%.
Look-back Bars : This determines how far back in time the indicator looks for FVGs. It also limits how long a gap remains visible if it hasn't been invalidated. Default is 1000 bars.
Show Bullish FVGs : Toggle to display bullish FVGs (green boxes by default). Default is enabled.
Show Bearish FVGs : Toggle to display bearish FVGs (red boxes by default). Default is enabled.
Box Opacity (0-100) : Adjusts the transparency of the FVG boxes on the chart. A value of 0 is fully transparent (invisible), while 100 is fully opaque. Default is 33 for a subtle appearance.
Visual Elements and Interpretation
The indicator draws rectangular boxes on your chart to represent FVGs. Understanding these visual elements is key to using the indicator effectively:
Green Boxes : Represent bullish FVGs. These are areas where price gapped upward, suggesting potential support zones. If price retraces to this area, it might bounce off as buyers step in to defend the level.
Red Boxes : Represent bearish FVGs. These are areas where price gapped downward, indicating potential resistance zones. If price retraces to this area, it might face selling pressure and reverse downward.
Box Position and Extension : Each box starts at the bar where the FVG was detected and extends to the right, updating dynamically as new bars form. This extension helps maintain visibility until the gap is either invalidated or falls out of the look-back period.
Disappearance of Boxes : A box disappears from the chart in two scenarios:
Price Moves Away : If the midpoint of the FVG moves outside the specified display range percentage from the current price, or if the FVG becomes older than the look-back bars limit, the box is removed (though the gap data persists in memory for potential re-display if conditions are met again).
Invalidation : If price trades through the midpoint of the FVG (i.e., the low of a candle goes below the midpoint for a bullish FVG, or the high goes above the midpoint for a bearish FVG), the gap is considered filled, and the box is permanently removed from the chart.
Trading Scenarios with FVG Range Filter
Below are detailed trading scenarios to help you understand how to use the FVG Range Filter in practical situations. These scenarios assume you're trading with the trend or looking for reversals at key levels.
Scenario 1: Bullish FVG as Support for Long Entry
Setup : You're trading a stock in an uptrend on a 15-minute chart. The FVG Range Filter displays a green box (bullish FVG) after a sharp upward move earlier in the day.
Interpretation : This green box indicates a zone of imbalance where price gapped up, likely due to strong buying interest. Since it's still within the display range and look-back period, it's a relevant support zone.
Action : Wait for price to retrace back to the top edge of the green box. Look for confirmation of support, such as a bullish candlestick pattern (e.g., hammer or engulfing) or increased volume, indicating buyers are stepping in.
Entry : Enter a long position near the top of the FVG box, setting a stop-loss just below the bottom of the box to protect against a breakdown.
Target : Aim for the next resistance level or a predefined risk-reward ratio (e.g., 1:2). If another bullish FVG forms above, consider that as a potential target.
Exit : Exit the trade if price breaks below the bottom of the FVG (invalidation), or if the box disappears due to price trading through the midpoint, signaling the gap is filled.
Scenario 2: Bearish FVG as Resistance for Short Entry
Setup : You're trading a cryptocurrency on a 1-hour chart during a downtrend. The indicator shows a red box (bearish FVG) after a sharp downward move a few hours ago.
Interpretation : The red box marks a zone where price gapped down, indicating strong selling pressure. As long as it's within the display range and look-back period, it remains a potential resistance zone.
Action : Wait for price to rally back to the bottom edge of the red box. Look for signs of rejection, such as a bearish candlestick pattern (e.g., shooting star or engulfing) or decreasing volume, suggesting sellers are defending this level.
Entry : Enter a short position near the bottom of the FVG box, placing a stop-loss just above the top of the box to guard against a breakout.
Target : Target the next support level or a favorable risk-reward ratio. If a new bearish FVG appears below, it could serve as a potential target.
Exit : Exit if price breaks above the top of the FVG (invalidation), or if the box disappears because price has traded through the midpoint, indicating the gap is no longer relevant.
Scenario 3: Filtering Out Irrelevant FVGs During Choppy Markets
Setup : You're trading forex on a 5-minute chart during a period of consolidation with no clear trend. The chart shows frequent small price jumps, but the FVG Range Filter displays very few boxes.
Interpretation : The indicator is filtering out FVGs that are either too far from the current price (outside the display range percentage) or too old (beyond the look-back bars). This helps avoid false signals in a non-trending market.
Action : Recognize that the absence of FVGs on the chart suggests no high-probability setups at the moment. Avoid forcing trades based on minor price movements that don't meet the filter criteria.
Entry : Wait for a clear trend to emerge and for new FVGs to appear within the filter parameters before considering any trades.
Target/Exit : Follow the trend direction once FVGs are displayed, using the edges of the boxes as potential entry or exit zones as described in the previous scenarios.
Scenario 4: Using FVGs for Risk Management
Setup : You're already in a long position on an index futures contract on a 30-minute chart, and the FVG Range Filter shows a green box below your entry point.
Interpretation : The green box represents a bullish FVG that could act as a support zone. Since price hasn't yet reached the midpoint (which would invalidate the FVG), it remains a valid reference point for managing risk.
Action : Adjust your stop-loss to just below the bottom of the green box. This placement uses the FVG as a logical invalidation level, assuming that a break below this support zone negates the bullish premise of your trade.
Entry : No new entry is needed since you're already in the trade.
Target/Exit : Keep your original target unless a new bearish FVG forms above, which might indicate resistance. Exit if price breaks below the FVG or if the box disappears due to invalidation.
Tips for Using the FVG Range Filter
Combine with Trend Analysis : FVGs are most effective when traded in the direction of the prevailing trend. Use higher timeframe analysis or other indicators to confirm the overall market direction before acting on FVGs.
Adjust Settings for Market Conditions : In volatile markets (like cryptocurrencies), you might increase the display range percentage to capture more FVGs. In less volatile markets (like certain stocks), a tighter range might be more appropriate.
Timeframe Selection : The indicator works on all timeframes, but lower timeframes (1-15 minutes) might show more frequent FVGs for scalping, while higher timeframes (1-4 hours) are better for swing trading with larger, more significant gaps.
Confirmation Tools : Don't rely solely on FVGs for entries. Use additional confirmation from price action (candlestick patterns), volume, or other indicators to increase the probability of success.
Monitor Invalidation : If an FVG box disappears from the chart due to price trading through its midpoint, consider it a signal that the gap is no longer relevant. Adjust your strategy accordingly.
Limitations
Not a Standalone System : The FVG Range Filter identifies potential zones of interest but does not provide entry signals, stop-loss, or take-profit levels on its own. It should be used as part of a broader trading strategy.
Market Conditions : FVGs may be less effective in strongly trending markets where price doesn't retrace to fill gaps, or in very choppy markets where too many small gaps are filtered out.
Lag in Detection : Since FVGs are based on a three-bar pattern, there is a slight delay in identifying them after the price movement has occurred.
Good Luck!
The FVG Range Filter is a powerful tool for traders looking to capitalize on price imbalances in the market. By focusing only on relevant Fair Value Gaps within a specified range and time frame, it helps declutter your chart and highlights high-probability zones for potential trades. Whether you're new to FVG trading or an experienced trader, this indicator can enhance your analysis by visually identifying key areas of support and resistance based on market inefficiencies.
Experiment with the settings to match your trading style and market conditions, and always combine the indicator's insights with other forms of analysis for the best results. Happy trading!

CRT overlay 2Overview
The "CRT overlay 2" is designed to plot key levels and detect market patterns based on the 4-hour candle around a specific start time (5AM). It incorporates elements like the high, low, and 50% level of a key 4-hour candle, and also tracks Fair Value Gaps (FVGs) to help identify potential price imbalances in the market. The indicator is primarily based on Candle Range Theory (CRT), which focuses on the significance of price movements within key candles and their relation to future market activity.
How the Script is Made
Key Components:
4-hour CRT Candle: The script identifies a specific 4-hour candle using a customizable start time (by default, it’s set to the 5 AM candle).
High, Low, and Midline Levels: For this selected 4-hour candle, the script calculates and draws the high, low, and 50% midpoint. These levels are used as reference points for further analysis.
Fair Value Gaps (FVGs): The script detects price gaps between candles (where the third candle does not fully overlap the first), which can act as areas of potential support or resistance. The user can toggle the plotting of midlines for these gaps.
Time Restrictions: The script limits its key functionalities (e.g., detecting highs, lows, and gaps) to a specific time window, between the target hour and the end hour (e.g., 5 AM to 10 AM).
Extensions and Visibility:
The plotted high, low, and midlines of the 4-hour candle extend a certain number of bars forward for visibility.
These lines stop extending after the end of the defined session (e.g., after 10 AM).
Wick Length Calculation:
The script calculates the length of a candle's wick as a percentage of the total range of the candle, which may provide insights into market rejections or momentum shifts.
Fair Value Gap (FVG) Detection:
The script detects both bullish and bearish FVGs based on a 3-candle pattern, plotting the gaps with customizable colors. The FVGs are then drawn on the chart for visual guidance.
Midlines of these gaps can also be drawn, and outdated or filled FVGs are removed after a set number of bars or if they are filled by price action.
How to Use It
Indicator Setup:
After adding the indicator to your chart, you will be able to customize settings for your desired timezone and the target 4-hour candle. By default, the script is set to the 5 AM candle, but this can be changed to any hour depending on your analysis needs.
The "CRT Candle Start" and "CRT Candle End" allow you to define the time range when the high, low, and midlines will be plotted and tracked.
Key Levels:
The script draws white lines for the high and low of the selected 4-hour candle, along with a green dashed line for the 50% mid-level. These lines serve as significant support and resistance levels.
During the defined session (e.g., 5 AM to 10 AM), these lines will actively extend and be visible on your chart.
After the session ends, these lines stop extending but remain on the chart for reference.
Fair Value Gaps (FVGs):
The script automatically identifies gaps between candles and plots them on the chart with colored boxes (green for bullish gaps, orange for bearish gaps). These areas can serve as potential reversal or continuation zones.
You can choose whether or not to plot a dashed line at the 50% mark of these FVGs. This midline can be important for targeting partial fills or retracements.
Sweep Alerts and Higher Highs/Lower Lows:
The script monitors price action to detect when the market forms the very first higher high or lower low within the high and low range of the 4-hour candle. When a higher high or lower low is detected, the script plots a yellow label on the chart to mark the event and triggers an alert.
These events can indicate potential sweep patterns or liquidity grabs.
FVG Removal:
The script includes a feature to automatically remove FVGs when they are filled by price action or after they become too old (based on a user-defined number of bars). This helps keep the chart clean for further analysis without clutter from outdated information.
Practical Application
Intraday Traders: The script helps traders focus on specific time windows (like 5 AM to 10 AM) and provides key reference levels (high, low, midline) that can guide trading decisions. Breaks and retests of these levels are common trading strategies.
Market Reversal and Continuation: The detection of Fair Value Gaps and higher highs/lower lows within the defined range can be useful for identifying potential reversal points or continuation signals in the market.
Candle Range Theory (CRT): The script is rooted in CRT, which emphasizes the importance of high and low levels of key candles for future price action. This theory is often used by traders looking to identify support/resistance zones or liquidity grabs in the market.
In summary, CRT overlay 2 is designed for precision trading around key timeframes, focusing on levels from the 4-hour candle and incorporating Fair Value Gaps for potential trade entries or exits. Its customizable inputs make it flexible for various strategies, and its focus on time-based levels is aligned with concepts in intraday trading and market structure analysis.

Lune Technical Analysis Premium⬛️ Overview
Lune Technical Analysis is a state-of-the-art TradingView indicator, meticulously designed to provide real-time market insights. Distinguished by its non-repainting features that operate in real-time, this tool brings enhanced accuracy and timeliness to your market analysis.
🟦 Features
Lune Technical Analysis equips traders with an array of innovative features:
🔹 Candle Coloring: The Candle Coloring feature introduces an innovative approach to visualizing market sentiment by coloring chart candles. It is devised to streamline your market analysis, offering a readily digestible snapshot of market trends. For example, if you aim to gauge the predominant market sentiment promptly, enable this feature for instant candle color-coding in accordance with prevailing bullish or bearish market structures. Though it currently supports only Market Structure-based Candle Coloring, its settings can be manipulated for enabling or disabling this feature. This feature operates by applying predefined algorithms that interpret market sentiment, coloring the candles accordingly.
🔹 Chart Pattern Detection: This sophisticated tool automatically detects and illustrates common chart patterns on your chart, simplifying the process of pattern identification. It identifies a range of patterns such as Head & Shoulders, Inverted Head & Shoulders, Ascending/Descending Wedges, Broadening Wedges, various Triangles, and Double Tops/Bottoms, enhancing your confluence detection in the market. For example, upon detecting a Double Top pattern, you could anticipate a potential price reversal due to this bearish signal. The sensitivity of this tool can be customized according to your trading style, with lower settings for short-term changes and higher for long-term. This feature leverages predefined formulas and price action analysis to identify these patterns.
🔹 Trendlines: With the Automatic Trendline Drawing tool, your technical analysis becomes significantly more efficient and precise. This feature is engineered to identify upward and downward Trendlines, aiding in locating potential pivots, and market support/resistance. For instance, if the price consistently rebounds off a Trendline, it may continue to do so, serving as a support/resistance level. However, a break through the Trendline could signal potential volatility and trend change. This feature's sensitivity to price changes can be adjusted to either short or long-term. It works by tracing Trendlines based on price action and wick formations to detect potential pivots.
🔹 Liquidity Bubbles: Liquidity Bubbles is an advanced tool that pinpoints key liquidity areas and large positions in real-time. This feature significantly contributes to effective trading strategy formulation by highlighting potential entry and exit points. It operates in real-time, ensuring zero repaint or lag, and supports two modes: Enhanced Bubbles and Basic Bubbles. For instance, the detection of multiple bullish Liquidity Bubbles during a ranging market could suggest an upward price movement due to dominant bullish volume. This feature's settings include thresholds for insignificant bubble filtering and a mode selection feature. Liquidity Bubbles operates by applying a proprietary formula to volume data, determining general volume direction and potential positions.
🔹 Market Structure: The Market Structure tool identifies key market structures such as Break of Structures (BoS) and Change of Character (ChoCh), thereby enhancing your ability to read market trends and sentiment. This smart money concept gives you a unique insight into short-term and long-term market trends. For instance, the appearance of a bullish Break of Structure and Change of Character after a predominantly bearish market sentiment could suggest a new bullish trend. This feature allows users to select which Market Structures to display and calculates these structures based on the market's high and low points.
🔹 Order Blocks: Order Blocks provide a visual representation of areas where large market participants are likely to place orders. These zones, where significant buying or selling activity has occurred in the past, offer insightful data for future price movements. The Order Blocks feature operates in real-time, providing real-time Order Blocks without any lag. For instance, if the price enters a large Order Block with predominantly bullish volume, an upward price movement can be anticipated. However, if the price breaks through the block, it could suggest the block's invalidation and a likely continued price fall. You can configure the settings to enable an additional Order Block, customize timeframes, overlap functions, and apply a quality filter. This feature calculates Order Blocks using the volume and candle size data.
🔹 Supply/Demand Zones: This real-time tool identifies crucial supply and demand zones, revealing potential price reaction points. These zones, where supply (selling pressure) and demand (buying pressure) have historically impacted price significantly, provide traders with insights into potential areas of strong support (demand) and resistance (supply). For example, if the price enters a large supply zone, a price rejection could be anticipated due to historical selling pressure at this zone. The settings enable users to add an additional Supply/Demand Zone, customize the timeframe, and apply a quality filter. This feature identifies common Supply/Demand Zones patterns based on volume and the size of the zone and displays them on the chart.
🔹 Fair Value Gaps: The Fair Value Gaps tool is designed to identify potential price correction zones or "gaps". These areas, where the market price sharply deviated from the fair value, suggest potential price adjustments in the future. For instance, the formation of a bullish Fair Value Gap could indicate a future price drop to fill this gap, potentially followed by an upward movement if the gap was of fair value. The settings allow users to enable additional Fair Value Gaps, customize the timeframe, and apply a quality filter. This feature measures large market gaps based on the size of the gap and its volume.
These features and tools collectively offer a comprehensive solution for traders to understand and navigate the financial markets. It's important to remember that they are designed to assist in making informed trading decisions and should be used as part of a balanced trading strategy.
🟧 Usage
Lune Technical Analysis's unique feature set can be leveraged both individually and synergistically. It is important to understand each feature and experiment with different configurations to best suit your unique trading needs.
🔸 Example #1: The following example demonstrates how the Order Block and Liquidity Bubbles feature can be used together to enhance your market analysis.
Order Blocks work in real-time to identify key order zones based on price action. These zones are often crucial for predicting price fluctuations. Meanwhile, Liquidity Bubbles act as real-time visual cues that detect significant market positions, facilitating an understanding of market accumulation, distribution, and trapped positions.
In this instance, at point 1, a bearish Basic and Enhanced Liquidity Bubble is visible within a crucial Order Block. The combination of these indicators augments the bearish sentiment, leading to a potential price decrease. Similarly, at point 2, the conjunction of two bullish Basic Liquidity Bubbles within an Order Block strengthens the bullish sentiment, culminating in a subsequent price increase.
🔸 Example #2: The following example demonstrates how Supply and Demand Zones can be used to detect strong and quality supports and resistance.
Supply and Demand Zones operate in real-time, detecting crucial zones based on price action and volume. This feature is invaluable for predicting potential price reaction points.
At point 1, the price enters a Supply Zone, a historical hotspot for selling activity, which usually leads to a price rejection and consequent decrease. At point 2, a Demand Zone indicating a bullish sentiment suggests a potential reversal when the price touches this level.
🔸 Example #3: The following example demonstrates how the Chart Pattern Detection feature is able to detect chart patterns to help enhance your trades.
Chart Pattern Detection employs formulas and price action analysis to identify common chart patterns as they form. Here, it successfully detects a 'Head and Shoulders' pattern, a conventionally bearish pattern, indicating a potential price drop.
🟥 Conclusion
Lune Technical Analysis stands as an exceptional blend of real-time insights into market activity. Its real-time, non-repainting features offer traders a more precise and timely approach to market analysis, promoting improved decision making in ever-changing market conditions.
🔻 Access
You can see the Author's instructions below to get instant access to this indicator & our Premium Suite.
🔻 Disclaimer
Lune Technical Analysis is a tool for aiding in market analysis and is not a guarantee of future market performance or individual trading success. We strongly recommend that users combine our tool with their trading strategies and do their due diligence before making any trading decisions.
Remember, past performance is not indicative of future results. Please trade responsibly.
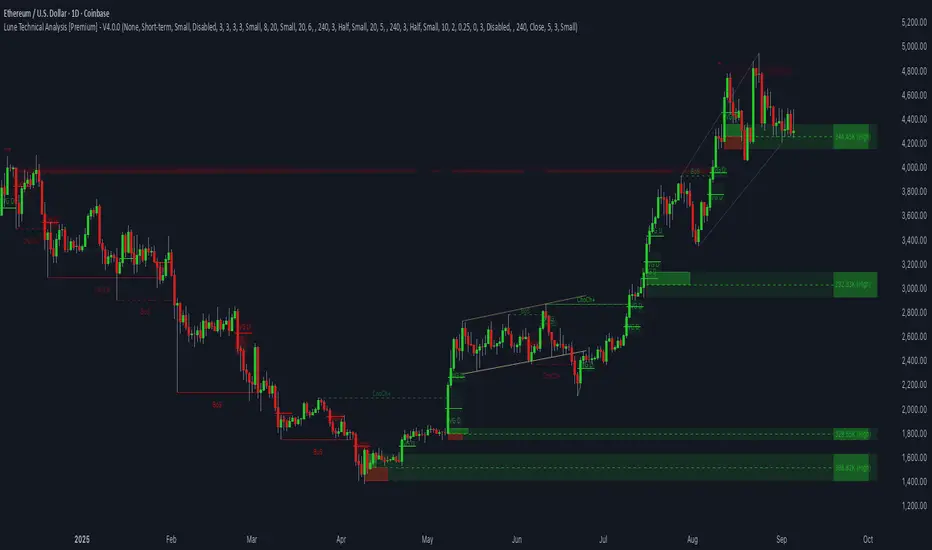
ST – Soothing areas 2TF [Soothing Trades]Short Description
ST – Soothing areas 2TF runs two Soothing Areas engines at once (e.g. 15m + Daily).
It finds bullish/bearish zones from Heikin Ashi body gaps on each higher timeframe, filters them per symbol and per timeframe, and tracks mitigation with optional same-day border outlines. HTF1 and HTF2 areas have their own colors, labels, and behavior, so you can see intraday and higher-timeframe structure together on one chart.
Full Description
This is the dual-timeframe version of Soothing Areas: two independent higher-timeframe engines, one chart.
Core logic
You choose two higher timeframes: HTF1 (e.g. 15m, 30m, 1h) and HTF2 (e.g. 4h, 1D, 1W).
For each HTF, the script:
• Uses the Heikin Ashi version of your symbol.
• Detects body gaps between past Heikin Ashi candles, which often mark strong directional moves.
• Classifies valid gaps: Bullish area (demand/support) or Bearish area (supply/resistance).
• Applies a per-symbol, per-timeframe minimum area height filter so only significant gaps become areas.
• Anchors the box at the previous HTF open time using xloc=bar_time to keep geometry stable across chart timeframes.
• Extends the right edge forward while the area is active (if the "extend while active" option is enabled).
Mitigation logic
Each HTF has its own mitigation penetration setting (0–1):
• 1.00 = the HTF body must penetrate essentially the full height of the area.
• Lower values = shallower penetration required to count as mitigated.
For each area, on every bar, the indicator:
• Recomputes the HTF Heikin Ashi body (H/L) projected to the chart timeframe.
• Checks if the HTF body overlaps the area's vertical range.
• Checks if penetration meets or exceeds the specified fraction of the box height.
• If both conditions are true, the area flips from active → mitigated.
Mitigation styles & same-day outline persistence
For each HTF, there are two modes after mitigation:
Standard mitigated styling (outline persistence OFF):
• The box switches to your mitigated colors (bull/bear) and separate fill/border opacity + width.
• The area is visually de-emphasised vs active zones but still visible.
Same-day outline persistence (outline persistence ON):
• On mitigation, the box becomes border-only (no fill) using dedicated outline colors, width, and style (solid/dashed/dotted).
• The outline continues to extend right for the rest of the current day.
• Next day, it stops extending and is flagged as no longer persistent.
• This lets you keep a visual memory of "where the move happened and was mitigated today" without covering your chart in solid boxes.
Visibility & labeling
• HTF1 & HTF2 can be toggled independently (show/hide boxes).
• Active boxes can have labels with separate toggles for HTF1 and HTF2.
• Custom text, for example "HTF1" and "HTF2".
• Separate text colors for each engine.
• Position: Top-Right of the box, or Middle-Right (vertically centered).
• Labels are dynamically updated as the box extends so they stay at the current right edge.
Per-symbol per-timeframe thresholds
• Up to four symbol slots (e.g. NQ, GC, YM, ES).
• For each symbol you can define: Minimum area height for HTF1 and Minimum area height for HTF2.
• Any symbol that isn't matched falls back to Default – HTF1 / Default – HTF2.
• This way, an NQ 15m area doesn't have to follow the same threshold as an ES Daily area.
How traders use it
• Map intraday Soothing Areas (HTF1) together with higher-timeframe Soothing Areas (HTF2) to see where local setups align with bigger structure.
• Identify which intraday zones sit inside daily/weekly zones.
• Distinguish which areas are fresh vs mitigated vs only remaining as outlines that day.
• Use HTF2 for major bias and HTF1 for more precise execution.
• Watch border-only outlines to understand where the market has already satisfied liquidity during the current day.
Visual features
• Dual-timeframe Heikin Ashi body gap detection
• Independent colors for HTF1 and HTF2 (bullish/bearish)
• Active vs mitigated states with customizable styling
• Optional same-day border-only outline persistence
• Per-symbol, per-timeframe minimum gap filtering
• Optional labels on active boxes with custom text and positioning
• Time-anchored geometry for stable display across chart timeframes
Notes & disclaimer
• Works across most symbols supported by TradingView Pine Script v6.
• Best on instruments where higher-timeframe Heikin Ashi structure is informative (indices, futures, FX majors, liquid crypto, etc.).
• Provided for educational purposes only and is not financial advice.
Always test any approach on demo and manage your own risk.

🎯 Wyckoff Scalping Pro V2🎯 Wyckoff Scalping Pro V2
Short Description:
Advanced Wyckoff methodology combined with order flow, liquidity analysis, and multi-factor scoring system. Professional-grade scalping and day trading tool with 10-point signal strength rating.
Full Description:
Wyckoff Scalping Pro V2 is a comprehensive trading system that combines classical Wyckoff methodology with modern Smart Money Concepts for precision entries in any timeframe.
🎯 What Makes This System Unique?
Unlike basic indicators that just show patterns, this system uses a 10-Point Scoring System to rate every potential trade:
Signal Strength Components:
✅ Wyckoff Patterns (3 points) - Spring, Upthrust, SOS, SOW
✅ Liquidity Grabs (2 points) - Smart Money stop hunts
✅ Trend Alignment (2 points) - Current timeframe trend
✅ HTF Alignment (2 points) - Higher timeframe confirmation
✅ Volume Confirmation (1 point) - Extreme volume spikes
Only signals with 5+ points are displayed, ensuring you only see high-probability setups!
🔥 Core Features
📊 1. Wyckoff Methodology
Four classic accumulation/distribution patterns:
SPRING (Bullish Reversal)
Price breaks below swing low
Quick recovery with volume
Stop losses swept → reversal up
3-point signal component
UPTHRUST (Bearish Reversal)
Price breaks above swing high
Quick rejection with volume
Bull trap → reversal down
3-point signal component
SOS (Sign of Strength)
Strong bullish candle after accumulation
Breakout with volume
Trend initiation signal
SOW (Sign of Weakness)
Strong bearish candle after distribution
Breakdown with volume
Downtrend initiation signal
💹 2. Order Flow Analysis
Order Blocks
Institutional buying/selling zones
Automatic detection based on strong moves
Limited to 10 zones for clean charts
Transparent boxes for minimal clutter
Fair Value Gaps (FVG)
Price imbalances likely to be filled
Minimum size filter (customizable)
Blue (bullish) and purple (bearish)
Maximum 8 gaps shown
Supply & Demand Zones (Optional)
Classic S/D methodology
Fresh zones only
Toggle on/off for preferences
Professional zone labeling
💧 3. Liquidity Analysis
Liquidity Grabs Detection
Identifies sweep of swing highs/lows
Confirms with volume and candle structure
Yellow labels for visibility
Only major liquidity events shown
Why This Matters:
Smart money often "hunts stops" by sweeping liquidity before reversing. These grabs are powerful reversal signals.
📈 4. Multi-Timeframe Trend Analysis
Current Timeframe:
Fast EMA (default: 9)
Slow EMA (default: 21)
Major trend EMA (default: 200)
Higher Timeframe:
Customizable HTF (default: 15min)
Automatic alignment check
Background tint shows HTF trend
Can require HTF confirmation for signals
🎯 5. Two Trading Modes
STRICT MODE (Default - Recommended)
Requires trend alignment
HTF must confirm
Minimum 5/10 strength
Higher win rate, fewer signals
Best for beginners
FAST MODE
No trend requirements
HTF optional
Minimum 5/10 strength
More signals, lower win rate
For experienced scalpers
📊 6. Live Dashboard
Real-time information panel showing:
Current TF trend (Bull/Bear)
HTF trend status
Volume analysis (Normal/High/Extreme)
Major trend (Above/Below 200 EMA)
Active signal (LONG/SHORT/WAIT)
Signal strength (X/10 points)
Operating mode (Strict/Fast)
⚙️ Customization
Signal Filter Settings:
Min Signal Strength: 3-9 (default: 5)
→ Higher = fewer but better signals
Signal Cooldown: 1-20 bars (default: 5)
→ Prevents signal spam
Strict Mode: ON/OFF
→ Requires trend + HTF alignment
Wyckoff Settings:
Wyckoff Period: 10+ (default: 20)
→ Lookback for pattern detection
Volume Threshold: 1.5+ (default: 2.0)
→ How much above average for confirmation
Order Flow:
Order Blocks: Toggle ON/OFF
Liquidity Grabs: Toggle ON/OFF
Fair Value Gaps: Toggle ON/OFF
FVG Min Size: 0.2-5% (default: 0.5%)
Supply/Demand Zones: Toggle ON/OFF (default: OFF)
Trend Filter:
Fast EMA: Default 9
Slow EMA: Default 21
Major EMA: Default 200
Use 200 EMA Filter: Toggle
Multi-Timeframe:
HTF Timeframe: Any (default: 15min)
Require HTF Alignment: Toggle
💡 How To Use
For Scalping (M1-M5):
Set HTF to M15
Use Strict Mode
Min Signal Strength: 6
Focus on liquidity grabs
Quick in and out
For Day Trading (M15-H1):
Set HTF to H1 or H4
Use Strict Mode
Min Signal Strength: 5
Watch all components
Swing for larger moves
For Swing Trading (H4-D1):
Set HTF to Daily or Weekly
Use Strict Mode
Min Signal Strength: 7
Disable S/D zones (less clutter)
Hold for days
🎯 Entry Rules
LONG Entry:
Required:
Green triangle appears below bar
Label shows "LONG"
Strength ≥ 5/10 in dashboard
Optional (for higher probability):
Strength 7+/10
Spring or SOS pattern present
Liquidity grab occurred
HTF shows green trend
Above 200 EMA
Stop Loss:
Below order block or swing low
10-20 pips buffer
Take Profit:
Next supply zone or opposite order block
Minimum 1:2 RRR
SHORT Entry:
Required:
Red triangle appears above bar
Label shows "SHORT"
Strength ≥ 5/10 in dashboard
Optional (for higher probability):
Strength 7+/10
Upthrust or SOW pattern present
Liquidity grab occurred
HTF shows red trend
Below 200 EMA
Stop Loss:
Above order block or swing high
10-20 pips buffer
Take Profit:
Next demand zone or opposite order block
Minimum 1:2 RRR
📊 Best Markets & Timeframes
✅ Forex
All major pairs (EUR/USD, GBP/USD, etc.)
Best on M5-H1
High liquidity = cleaner signals
✅ Gold (XAUUSD)
Excellent for scalping
M5-M15 optimal
Strong liquidity events
✅ Crypto
Bitcoin, Ethereum
M15-H1 recommended
Volatile = more opportunities
✅ Indices
S&P 500, NASDAQ, etc.
M15-H4 optimal
Clear trends
✅ Stocks
Large cap only
Day trading timeframes
Sufficient volume required
🔔 Alert System
Available Alerts:
🟢 LONG Entry Signal
🔴 SHORT Entry Signal
🟡 Bullish Liquidity Grab
🟡 Bearish Liquidity Grab
🔵 Spring Pattern
🔴 Upthrust Pattern
Alert Messages Include:
Ticker symbol
Current price
Signal strength (X/10)
Pattern type
Recommended Setup:
Enable LONG and SHORT entry alerts
Set to "Once Per Bar Close"
Notification to mobile app
📈 Performance Expectations
Realistic Win Rates:
Strict Mode (5/10 min, with trend):
Win Rate: 65-75%
Signals: 3-8 per day (M15)
Best for: Most traders
Strict Mode (7/10 min, HTF aligned):
Win Rate: 75-85%
Signals: 1-3 per day (M15)
Best for: Conservative traders
Fast Mode (5/10 min, no filters):
Win Rate: 55-65%
Signals: 10-20 per day (M15)
Best for: Experienced scalpers
With Liquidity Grabs:
Win Rate: +10-15% increase
Reversal probability very high
Combine with Wyckoff for best results
💎 Pro Tips
Tip #1: Combine Patterns
Best Setup = Liquidity Grab + Spring/Upthrust
→ 80%+ win rate
→ Smart money confirmed on both sides
Tip #2: Use Signal Strength
5-6 points = OK to trade
7-8 points = Excellent trade
9-10 points = Rare, perfect setup
Tip #3: HTF Alignment
When HTF agrees with signal:
→ Larger position size allowed
→ Wider profit targets
→ Higher probability
Tip #4: Volume Matters
"EXTREME" volume in dashboard:
→ Institutional activity confirmed
→ Higher confidence in setup
→ Stronger moves expected
Tip #5: Clean Charts
Turn OFF S/D zones for day trading
Keep only Order Blocks + FVG
Less clutter = better focus
Tip #6: Signal Cooldown
Increase cooldown during:
→ Low volatility periods
→ Range-bound markets
→ To avoid overtrading
Decrease cooldown during:
→ High volatility
→ Trending markets
→ Major news events
🎨 Visual Design
Clean & Professional:
Minimal chart clutter
Only essential information
Transparent zones (92-95%)
Clear signal markers
Professional color scheme
Information Hierarchy:
Entry signals = LARGEST (impossible to miss)
Liquidity grabs = Medium (yellow labels)
Wyckoff patterns = Small (diamonds)
Zones = Transparent backgrounds
🆚 Comparison to Other Indicators
vs. Basic Order Block Indicators:
✅ Multi-factor scoring system
✅ Wyckoff patterns included
✅ Liquidity analysis built-in
✅ HTF confirmation
✅ Volume analysis vs. Simple Wyckoff Indicators:
✅ Order flow integration
✅ Fair value gaps
✅ Signal strength rating
✅ Multi-timeframe analysis
✅ Professional dashboard vs. Complex "All-in-One" Tools:
✅ Not overwhelming
✅ Focused on what matters
✅ Clean visual design
✅ Fast calculations
✅ Beginner-friendly with pro features
🎯 Who Is This For?
✅ Perfect For:
Scalpers (M1-M5)
Day traders (M15-H1)
Swing traders (H4-D1)
Traders learning Wyckoff
Anyone wanting quality over quantity
Traders seeking multi-confirmation
⚠️ Not Ideal For:
Complete beginners (learn basics first)
"Signal chasers" wanting 50+ signals/day
Traders who don't use stop losses
Very long-term investors
📚 Educational Value
This indicator teaches you:
Classical Wyckoff methodology
How institutions hunt liquidity
Order flow analysis
Multi-timeframe confluence
Volume analysis importance
Risk management through scoring
Learn while you trade!
⚡ Technical Specifications
Pine Script v5
Optimized for speed
No repainting
Real-time calculations
Maximum 200 boxes (clean limits)
Maximum 200 lines
Efficient array management
Works on all liquid markets
🚀 Getting Started (Quick Guide)
Add to Chart
Apply to your favorite pair
Default settings work well
Choose Your Mode
Strict Mode: ON (recommended)
HTF: Set to 15min (or higher for H1+ charts)
Set Alerts
LONG Entry Signal
SHORT Entry Signal
Start Small
Demo trade first
Watch signal strength
Learn the patterns
Scale Up
Once comfortable
Increase position size
Focus on 7+ strength signals
🎯 Final Thoughts
Wyckoff Scalping Pro V2 is not just an indicator - it's a complete trading system that respects your screen space while giving you professional-grade analysis.
The 10-point scoring system ensures you're never guessing about signal quality. You always know exactly how strong a setup is before entering.
Quality over quantity - This system prioritizes high-probability setups over signal spam. You might see 3-8 signals per day on M15, and that's exactly the point. Each one is carefully filtered.
📞 Support & Feedback
Questions? Drop a comment below!
Found this useful? Hit that ⭐ button!
Have suggestions? I'm listening!
Happy Trading! 🚀📈

SMC FVG/IFVG (Multi-TF x 4) [ZAUTEC]SMC FVG/IFVG (Multi-TF x 4): Multi-Timeframe Fair Value Gap with Inversed FVG Detection
This powerful Pine Script indicator is designed to help traders identify, track, and manage Fair Value Gaps (FVGs) and their respective Inversed Fair Value Gaps (IFVGs) across up to four different timeframes simultaneously.
Key Features
Multi-Timeframe Analysis (4x): Analyze and display FVGs from four distinct timeframes alongside your current chart, offering a comprehensive view of market imbalances across various scales.
Fair Value Gap (FVG) Detection: Automatically identifies classic three-candle FVGs (market inefficiencies).
Customizable FVG Length: Set how many bars the FVG boxes should initially extend for.
Minimum Gap Size: Filter out minor, insignificant gaps using a tick-based minimum size threshold.
Optional Box Extension: Dynamically extend FVG boxes to the current bar index or use a fixed extension for a cleaner chart.
Inversed FVG (IFVG) Logic: Detects a high-probability reversal pattern where a previously filled FVG zone is immediately followed by the formation of a new, opposite FVG within or adjacent to the same area. This confirms the old FVG has "flipped roles" (e.g., from support to resistance).
Lookback Period: Defines how long the indicator searches for a corresponding FVG breach to confirm the IFVG.
IFVG Minimum Size: Customizable minimum size threshold for the IFVG.
Dynamic Box Management:
Automatic Fill Deletion: FVGs are automatically removed from the chart when price action fully trades through the gap, signifying the imbalance has been "filled."
IFVG Tracking: IFVGs are tracked and removed from the chart after the configurable lookback period.
Full Customization: Control the visibility, colors, border styles (solid, dashed, dotted), and width for FVG, Bearish FVG, Bullish FVG, and IFVG boxes independently for each of the four timeframes.
How to Use
Select Timeframes: Choose up to four desired timeframes in the settings (e.g., "15" for 15-minute, "4H" for 4-hour, "D" for Daily). Leave the field empty to use the chart's current timeframe.
Toggle Visibility: Use the Show FVG and Show IFVG toggles to focus on the imbalances you wish to see.
Adjust Extension: Set Extend Boxes to bar index to true to keep all open FVG boxes drawn all the way to the current live price bar.
Interpret the Gaps:
FVG (Bullish/Bearish): Potential areas for price to return to and find support/resistance.
IFVG (Inverse FVG): Stronger signals that a previous zone of imbalance has been violated and is likely to act as a significant flip zone for future price movements.
This indicator is an essential tool for traders utilizing concepts like ICT (Inner Circle Trader) and SMC (Smart Money Concepts), providing a clear visual representation of market structure and liquidity voids.

EvoTrend-X Indicator — Evolutionary Trend Learner ExperimentalEvoTrend-X Indicator — Evolutionary Trend Learner
NOTE: This is an experimental Pine Script v6 port of a Python prototype. Pine wasn’t the original research language, so there may be small quirks—your feedback and bug reports are very welcome. The model is non-repainting, MTF-safe (lookahead_off + gaps_on), and features an adaptive (fitness-based) candidate selector, confidence gating, and a volatility filter.
⸻
What it is
EvoTrend-X is adaptive trend indicator that learns which moving-average length best fits the current market. It maintains a small “population” of fast EMA candidates, rewards those that align with price momentum, and continuously selects the best performer. Signals are gated by a multi-factor Confidence score (fitness, strength vs. ATR, MTF agreement) and a volatility filter (ATR%). You get a clean Fast/Slow pair (for the currently best candidate), optional HTF filter, a fitness ribbon for transparency, and a themed info panel with a one-glance STATUS readout.
Core outputs
• Selected Fast/Slow EMAs (auto-chosen from candidates via fitness learning)
• Spread cross (Fast – Slow) → visual BUY/SELL markers + alert hooks
• Confidence % (0–100): Fitness ⊕ Distance vs. ATR ⊕ MTF agreement
• Gates: Trend regime (Kaufman ER), Volatility (ATR%), MTF filter (optional)
• Candidate Fitness Ribbon: shows which lengths the learner currently prefers
• Export plot: hidden series “EvoTrend-X Export (spread)” for downstream use
⸻
Why it’s different
• Evolutionary learning (on-chart): Each candidate EMA length gets rewarded if its slope matches price change and penalized otherwise, with a gentle decay so the model forgets stale regimes. The best fitness wins the right to define the displayed Fast/Slow pair.
• Confidence gate: Signals don’t light up unless multiple conditions concur: learned fitness, spread strength vs. volatility, and (optionally) higher-timeframe trend.
• Volatility awareness: ATR% filter blocks low-energy environments that cause death-by-a-thousand-whipsaws. Your “why no signal?” answer is always visible in the STATUS.
• Preset discipline, Custom freedom: Presets set reasonable baselines for FX, equities, and crypto; Custom exposes all knobs and honors your inputs one-to-one.
• Non-repainting rigor: All MTF calls use lookahead_off + gaps_on. Decisions use confirmed bars. No forward refs. No conditional ta.* pitfalls.
⸻
Presets (and what they do)
• FX 1H (Conservative): Medium candidates, slightly higher MinConf, modest ATR% floor. Good for macro sessions and cleaner swings.
• FX 15m (Active): Shorter candidates, looser MinConf, higher ATR% floor. Designed for intraday velocity and decisive sessions.
• Equities 1D: Longer candidates, gentler volatility floor. Suits index/large-cap trend waves.
• Crypto 1H: Mid-short candidates, higher ATR% floor for 24/7 chop, stronger MinConf to avoid noise.
• Custom: Your inputs are used directly (no override). Ideal for systematic tuning or bespoke assets.
⸻
How the learning works (at a glance)
1. Candidates: A small set of fast EMA lengths (e.g., 8/12/16/20/26/34). Slow = Fast × multiplier (default ×2.0).
2. Reward/decay: If price change and the candidate’s Fast slope agree (both up or both down), its fitness increases; otherwise decreases. A decay constant slowly forgets the distant past.
3. Selection: The candidate with highest fitness defines the displayed Fast/Slow pair.
4. Signal engine: Crosses of the spread (Fast − Slow) across zero mark potential regime shifts. A Confidence score and gates decide whether to surface them.
⸻
Controls & what they mean
Learning / Regime
• Slow length = Fast ×: scales the Slow EMA relative to each Fast candidate. Larger multiplier = smoother regime detection, fewer whipsaws.
• ER length / threshold: Kaufman Efficiency Ratio; above threshold = “Trending” background.
• Learning step, Decay: Larger step reacts faster to new behavior; decay sets how quickly the past is forgotten.
Confidence / Volatility gate
• Min Confidence (%): Minimum score to show signals (and fire alerts). Raising it filters noise; lowering it increases frequency.
• ATR length: The ATR window for both the ATR% filter and strength normalization. Shorter = faster, but choppier.
• Min ATR% (percent): ATR as a percentage of price. If ATR% < Min ATR% → status shows BLOCK: low vola.
MTF Trend Filter
• Use HTF filter / Timeframe / Fast & Slow: HTF Fast>Slow for longs, Fast threshold; exit when spread flips or Confidence decays below your comfort zone.
2) FX index/majors, 15m (active intraday)
• Preset: FX 15m (Active).
• Gate: MinConf 60–70; Min ATR% 0.15–0.30.
• Flow: Focus on session opens (LDN/NY). The ribbon should heat up on shorter candidates before valid crosses appear—good early warning.
3) SPY / Index futures, 1D (positioning)
• Preset: Equities 1D.
• Gate: MinConf 55–65; Min ATR% 0.05–0.12.
• Flow: Use spread crosses as regime flags; add timing from price structure. For adds, wait for ER to remain trending across several bars.
4) BTCUSD, 1H (24/7)
• Preset: Crypto 1H.
• Gate: MinConf 70–80; Min ATR% 0.20–0.35.
• Flow: Crypto chops—volatility filter is your friend. When ribbon and HTF OK agree, favor continuation entries; otherwise stand down.
⸻
Reading the Info Panel (and fixing “no signals”)
The panel is your self-diagnostic:
• HTF OK? False means the higher-timeframe EMAs disagree with your intended side.
• Regime: If “Chop”, ER < threshold. Consider raising the threshold or waiting.
• Confidence: Heat-colored; if below MinConf, the gate blocks signals.
• ATR% vs. Min ATR%: If ATR% < Min ATR%, status shows BLOCK: low vola.
• STATUS (composite):
• BLOCK: low vola → increase Min ATR% down (i.e., allow lower vol) or wait for expansion.
• BLOCK: HTF filter → disable HTF or align with the HTF tide.
• BLOCK: confidence → lower MinConf slightly or wait for stronger alignment.
• OK → you’ll see markers on valid crosses.
⸻
Alerts
Two static alert hooks:
• BUY cross — spread crosses up and all gates (ER, Vol, MTF, Confidence) are open.
• SELL cross — mirror of the above.
Create them once from “Add Alert” → choose the condition by name.
⸻
Exporting to other scripts
In your other Pine indicators/strategies, add an input.source and select EvoTrend-X → “EvoTrend-X Export (spread)”. Common uses:
• Build a rule: only trade when exported spread > 0 (trend filter).
• Combine with your oscillator: oscillator oversold and spread > 0 → buy bias.
⸻
Best practices
• Let it learn: Keep Learning step moderate (0.4–0.6) and Decay close to 1.0 (e.g., 0.99–0.997) for smooth regime memory.
• Respect volatility: Tune Min ATR% by asset and timeframe. FX 1H ≈ 0.10–0.20; crypto 1H ≈ 0.20–0.35; equities 1D ≈ 0.05–0.12.
• MTF discipline: HTF filter removes lots of “almost” trades. If you prefer aggressive entries, turn it off and rely more on Confidence.
• Confidence as throttle:
• 40–60%: exploratory; expect more signals.
• 60–75%: balanced; good daily driver.
• 75–90%: selective; catch the clean stuff.
• 90–100%: only A-setups; patient mode.
• Watch the ribbon: When shorter candidates heat up before a cross, momentum is forming. If long candidates dominate, you’re in a slower trend cycle.
⸻
Non-repainting & safety notes
• All request.security() calls use lookahead=barmerge.lookahead_off, gaps=barmerge.gaps_on.
• No forward references; decisions rely on confirmed bar data.
• EMA lengths are simple ints (no series-length errors).
• Confidence components are computed every bar (no conditional ta.* traps).
⸻
Limitations & tips
• Chop happens: ER helps, but sideways microstructure can still flicker—use Confidence + Vol filter as brakes.
• Presets ≠ oracle: They’re sensible baselines; always tune MinConf and Min ATR% to your venue and session.
• Theme “Auto”: Pine cannot read chart theme; “Auto” defaults to a Dark-friendly palette.
⸻
Publisher’s Screenshots Checklist
1) FX swing — EURUSD 1H
• Preset: FX 1H (Conservative)
• Params: MinConf=70, ATR Len=14, Min ATR%=0.12, MTF ON (TF=4H, 20/50)
• Show: Clear BUY cross, STATUS=OK, green regime background; Fitness Ribbon visible.
2) FX intraday — GBPUSD 15m
• Preset: FX 15m (Active)
• Params: MinConf=60, ATR Len=14, Min ATR%=0.20, MTF ON (TF=60m)
• Show: SELL cross near London session open. HTF lines enabled (translucent).
• Caption: “GBPUSD 15m • Active session sell with MTF alignment.”
3) Indices — SPY 1D
• Preset: Equities 1D
• Params: MinConf=60, ATR Len=14, Min ATR%=0.08, MTF ON (TF=1W, 20/50)
• Show: Longer trend run after BUY cross; regime shading shows persistence.
• Caption: “SPY 1D • Trend run after BUY cross; weekly filter aligned.”
4) Crypto — BINANCE:BTCUSDT 1H
• Preset: Crypto 1H
• Params: MinConf=75, ATR Len=14, Min ATR%=0.25, MTF ON (TF=4H)
• Show: BUY cross + quick follow-through; Ribbon warming (reds/yellows → greens).
• Caption: “BTCUSDT 1H • Momentum break with high confidence and ribbon turning.”

Scalping MasterMarket Structure Analysis:
Swing Structure: Detects higher highs (HH), lower highs (LH), higher lows (HL), aur lower lows (LL) ko identify karta hai using pivot points (based on ta.highest aur ta.lowest).
Internal Structure: Chhote timeframes ke liye internal swing points aur break of structure (BOS)/change of character (CHoCH) ko track karta hai.
BOS/CHoCH Detection: Bullish aur bearish structure breaks (BOS) aur trend reversals (CHoCH) ko label karta hai.
Order Blocks (OB):
Internal Order Blocks: Chhote timeframe ke order blocks ko plot karta hai, jo liquidity zones ko represent karte hain.
Swing Order Blocks: Bade timeframe ke order blocks ko show karta hai.
Filtering: ATR ya Cumulative Mean Range ke basis par volatile order blocks ko filter karta hai.
Fair Value Gaps (FVG):
Price gaps (bullish aur bearish) ko detect aur plot karta hai.
Auto-threshold aur timeframe customization ke saath FVGs ko filter karta hai.
FVGs ko extend karne ka option deta hai (visual representation ke liye).
Equal Highs/Lows (EQH/EQL):
Equal highs aur lows ko identify karta hai, jo support/resistance zones ke liye useful hote hain.
Bars confirmation aur sensitivity threshold ke saath customizable hai.
Previous Highs/Lows (MTF):
Daily, weekly, aur monthly high/low levels ko plot karta hai.
Line style (solid, dashed, dotted) aur colors customizable hain.
Premium/Discount Zones:
Market ke premium, equilibrium, aur discount zones ko highlight karta hai, jo price action ke liye key areas hote hain.
Visual Customization:
Color Themes: Colored ya monochrome themes ke options.
Candle Coloring: Trend ke hisaab se candles ko color karta hai.
Labels aur Lines: Swing points, strong/weak highs/lows, aur structure breaks ke liye labels aur lines plot karta hai.
Modes:
Historical Mode: Past data ke saath complete structure dikhata hai.
Present Mode: Sirf recent structure aur signals dikhata hai, clutter reduce karne ke liye.
Alerts:
Bullish/Bearish BOS, CHoCH, order block breaks, aur EQH/EQL ke liye alerts set karne ka option.
Swing Points aur Trailing:
Strong/weak high aur low points ko track karta hai.
Trailing maximum/minimum ko extend karta hai for real-time analysis.
Kya Kya Mila Kar Bana Hai?
Yeh indicator Smart Money Concepts ke core principles par based hai aur in elements ko combine karta hai:
Pivot Point Analysis:
ta.highest aur ta.lowest functions se swing highs/lows detect karta hai.
Internal aur swing structure ke liye alag-alag lengths (e.g., length aur 5 for internal swings).
Price Action Concepts:
Break of Structure (BOS): Jab price pivot high/low ko break karta hai.
Change of Character (CHoCH): Jab trend reverse hota hai.
Confluence filtering ke saath accuracy improve karta hai.
Order Blocks:
Liquidity zones ko identify karne ke liye high/low ranges aur ATR/cumulative mean range ka use.
Bullish aur bearish order blocks ke liye customizable colors.
Fair Value Gaps:
Gaps in price action ko detect karne ke liye OHLC data ka analysis.
Timeframe aur auto-threshold ke saath flexibility.
MTF (Multi-Timeframe) Analysis:
Daily, weekly, monthly high/low levels ke liye ta.valuewhen aur time-based calculations.
Zones Detection:
Premium, equilibrium, aur discount zones ke liye price range calculations.
Visual Tools:
Lines, labels, aur boxes ke saath market structure ko visually represent karta hai (line.new, label.new, box.new).
Extendable lines aur boxes for better visibility.
User Inputs:
Customizable settings jaise timeframe, colors, lengths, aur filters, jo user ko flexibility dete hain.
Technical Components
PineScript Functions: ta.crossover, ta.crossunder, ta.highest, ta.lowest, ta.atr, ta.cum for calculations.
Arrays: Order blocks ke coordinates store karne ke liye (array.new_float, array.new_int, array.new_box).
Drawing Tools: Lines, labels, aur boxes ke saath dynamic plotting.
Conditional Logic: BOS, CHoCH, aur other signals ke liye complex conditions.
Timeframe Support: Multi-timeframe analysis ke liye input.timeframe.