Ehlers Smoothed Adaptive Momentum [LazyBear]Bored of Ehlers yet? :) I still have plenty of Ehlers in my collection, was thinking of publishing one of his Fishers or Adaptive RVI next, but @ChartArt requested Smoothed Adaptive Momentum (SAM), so here we go...
This is my 200th script (not including the variations and other custom scripts I shared over PM). My complete list of indicators here - bit.ly
Now, about the indicator :)
This smoothed adaptive momentum is straightforward to use (per Ehlers original rules). If it crosses above zero buy the next open, if it crosses below zero sell the next open. Of course, I strongly suggest filtering the signals.
Finally, here's an Ehlers-only chart to help determine where BTC is heading :P
More info:
- Ehlers CG Oscillator:
- Cybernetic Analysis for Stocks and Futures (Ehlers)
List of my public indicators: bit.ly
List of my app-store indicators: blog.tradingview.com
--Updated chart--
Here's the chart with barcolors ON (forgot to turn it on in the published one)
Поиск скриптов по запросу "momentum"

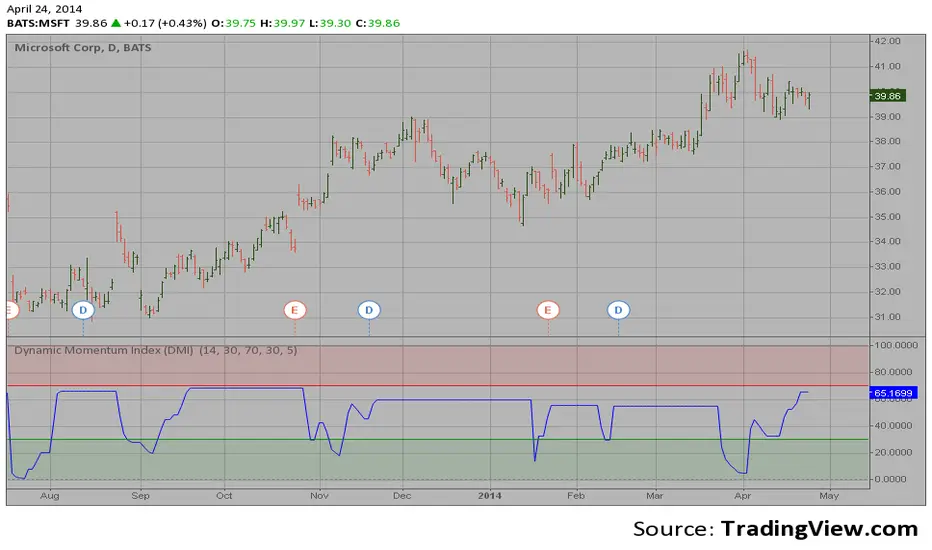
Dynamic Momentum Index (DMI) This indicator plots Dynamic Momentum Index indicator. The Dynamic Momentum
Index (DMI) was developed by Tushar Chande and Stanley Kroll. The indicator
is covered in detail in their book The New Technical Trader.
The DMI is identical to Welles Wilder`s Relative Strength Index except the
number of periods is variable rather than fixed. The variability of the time
periods used in the DMI is controlled by the recent volatility of prices.
The more volatile the prices, the more sensitive the DMI is to price changes.
In other words, the DMI will use more time periods during quiet markets, and
less during active markets. The maximum time periods the DMI can reach is 30
and the minimum is 3. This calculation method is similar to the Variable
Moving Average, also developed by Tushar Chande.
The advantage of using a variable length time period when calculating the RSI
is that it overcomes the negative effects of smoothing, which often obscure short-term moves.
The volatility index used in controlling the time periods in the DMI is based
on a calculation using a five period standard deviation and a ten period average
of the standard deviation.
Market State Momentum OscillatorMarket State Momentum Oscillator (MSMO)
Overview
The MSMO combines three elements in one panel:
Momentum oscillator (gray/blue area with aqua signal line)
Market State filter (green/red background area)
Money Flow Index (orange line)
Works on all markets and all timeframes. Non-repainting at bar close.
Colors and meaning
Gray area: Momentum above 0 (bullish bias)
Blue area: Momentum below 0 (bearish bias)
Aqua line: Signal line smoothing the oscillator
Green background: Market state bullish (price above moving average)
Red background: Market state bearish (price below moving average)
Orange line: Money Flow Index (volume-weighted momentum)
How to use
Always wait for confirmation of the green or red market state before acting.
Trend alignment: Watch the slope of the Weekly and Daily 200 MA and Weekly and Daily 50 MA to understand higher-timeframe trend direction. Trade only in alignment with the broader trend.
Entries:
Long: Green state + gray histogram rising + MFI trending up
Short: Red state + blue histogram falling + MFI trending down
Exits: Histogram crossing back through 0, or state background flips against the position.
Users can add chart alerts on plot crossings if needed.
Inputs
Lengths for oscillator pivot, signal smoothing, state moving average, trend weight, return %, and Money Flow Index. Defaults work for most charts.
Note
Educational use only. Not financial advice.
Tags
trend, oscillator, market state, momentum, money flow, crypto, forex, stocks, indices, futures

RSI-Adaptive T3 + Squeeze Momentum Strategy✅ Strategy Guide: RSI-Adaptive T3 + Squeeze Momentum Strategy
📌 Overview
The RSI-Adaptive T3 + Squeeze Momentum Strategy is a dynamic trend-following strategy based on an RSI-responsive T3 moving average and Squeeze Momentum detection .
It adapts in real-time to market volatility to enhance entry precision and optimize risk.
⚠️ This strategy is provided for educational and research purposes only.
Past performance does not guarantee future results.
🎯 Strategy Objectives
The main objective of this strategy is to catch the early phase of a trend and generate consistent entry signals.
Designed to be intuitive and accessible for traders from beginner to advanced levels.
✨ Key Features
RSI-Responsive T3: T3 length dynamically adjusts according to RSI values for adaptive trend detection
Squeeze Momentum: Combines Bollinger Bands and Keltner Channels to identify trend buildup phases
Visual Triggers: Entry signals are generated from T3 crossovers and momentum strength after squeeze release
📊 Trading Rules
Long Entry:
When T3 crosses upward, momentum is positive, and the squeeze has just been released.
Short Entry:
When T3 crosses downward, momentum is negative, and the squeeze has just been released.
Exit (Reversal):
When the opposite condition to the entry is triggered, the position is reversed.
💰 Risk Management Parameters
Pair & Timeframe: BTC/USD (30-minute chart)
Capital (simulated): $30,00
Order size: `$100` per trade (realistic, low-risk sizing)
Commission: 0.02%
Slippage: 2 pips
Risk per Trade: 5%
Number of Trades (backtest period): 181
📊 Performance Overview
Symbol: BTC/USD
Timeframe: 30-minute chart
Date Range: January 1, 2024 – July 3, 2025
Win Rate: 47.8%
Profit Factor: 2.01
Net Profit: 173.16 (units not specified)
Max Drawdown: 5.77% or 24.91 (0.79%)
⚙️ Indicator Parameters
Indicator Name: RSI-Adaptive T3 + Squeeze Momentum
RSI Length: 14
T3 Min Length: 5
T3 Max Length: 50
T3 Volume Factor: 0.7
BB Length: 27 (Multiplier: 2.0)
KC Length: 20 (Multiplier: 1.5, TrueRange enabled)
🖼 Visual Support
T3 slope direction, squeeze status, and momentum bars are visually plotted on the chart,
providing high clarity for quick trend analysis and execution.
🔧 Strategy Improvements & Uniqueness
Inspired by the RSI Adaptive T3 by ChartPrime and Squeeze Momentum Indicator by LazyBear ,
this strategy fuses both into a hybrid trend-reversal and momentum breakout detection system .
Compared to traditional trend-following methods, it excels at capturing early trend signals with greater sensitivity .
✅ Summary
The RSI-Adaptive T3 + Squeeze Momentum Strategy combines momentum detection with volatility-responsive risk management.
With a strong balance between visual clarity and practicality, it serves as a powerful tool for traders seeking high repeatability.
⚠️ This strategy is based on historical data and does not guarantee future profits.
Always use appropriate risk management when applying it.

BB Breakout + Momentum Squeeze [Strategy]This Strategy is Based on 3 free indicators
- Bollinger Bands Breakout Oscillator: Link
- TTM Squeeze Pro: Link
- Rolling ATR Bands: Link
Bollinger Bands Breakout Oscillator - This tool shows how strong a market trend is by measuring how often prices move outside their normal Bollinger bands range. It helps you see whether prices are strongly moving in one direction or just moving sideways. By looking at how much and how frequently prices push beyond their typical boundaries, you can identify which direction the market is heading over your selected time period.
TM Squeeze Pro - This is a custom version of the TTM Squeeze indicator.
It's designed to help traders spot consolidation phases in the market (when price is coiling or "squeezing") and to catch breakouts early when volatility returns. The logic is based on the relationship between Bollinger Bands and Keltner Channels, combined with a momentum oscillator to show direction and strength.
Rolling ATR Bands - This indicator combines volatility bands (ATR) with momentum and trend signals to show where the market might be breaking out, retesting, or trending. It's highly visual and helpful for traders looking to time entries/exits during trending or volatile moves.
Logic Of the Strategy:
We are going to use the Bollinger Bands Breakout to determine the direction of the market. Than check the Volatility of the price by looking at the TTM Squeeze indicator. And use the ATR Bands to determine dynamic Stop Losses and based on the calculate the Take Profit targets and quantity for each position dynamically.
For the Long Setup:
1. We need to see the that Bull Power (Green line of the Bollinger Bands Breakout Oscilator) is crossing the level of 50.
2. Check the presence of volatility (Green dot based on the TTM Squeeze indicator)
For the Short Setup:
1. We need to see the that Bear Power (Red line of the Bollinger Bands Breakout Oscilator) is crossing the level of 50.
2. Check the presence of volatility (Green dot based on the TTM Squeeze indicator)
Stop Loss is determined by the Lower ATR Band (for the Long entry) and Upper ATR Band (For the Short entry)
Take Profit is 1:1.5 risk reward ration, which means if the Stop loss is 1% the TP target will be 1.5%
Move stop Loss to Breakeven: If the price will go in the direction of the trade for at least half of the Risk Reward target then the stop will automatically be adjusted to the entry price. For Example: the Stop Loss is 1%, the price has move at least 0.5% in the direction of your trade and that will move the Stop Loss level to the Entry point.
You can Adjust the parameters for each indicator used in that script and also adjust the Risk and Money management block to see how the PnL will change.

Momentum Trend Strength (MTS) *Julian_Acunja*Momentum Trend Strength (MTS)
The Momentum Trend Strength (MTS) indicator visually represents market momentum directly on your chart. By clearly highlighting momentum direction and intensity, traders can easily recognize shifts in market sentiment and anticipate potential turning points.
Traders can easily adjust the sensitivity and smoothing parameters, making it adaptable to diverse market conditions and trading strategies.
🔹 USAGE
The Momentum Trend Strength indicator helps traders intuitively detect market momentum, enhancing their ability to anticipate and respond dynamically to changing market conditions. Traders typically interpret three main scenarios using this indicator:
🚀 Momentum Acceleration:
An expanding green line above recent price action signals increasing bullish momentum, suggesting buyers are gaining strength. Conversely, a downward-expanding red line below price action indicates stronger bearish momentum, signifying increasing selling pressure.
🔄 Momentum Reversal:
A clear shift from red to green (or vice versa) often signals potential momentum reversals, providing traders with timely indications of possible market turns or shifts in sentiment.
⚖️ Momentum Consolidation:
When the indicator remains near the price line, it suggests weak momentum and potential market consolidation. Traders might interpret this as a range-bound market environment, adjusting their strategies accordingly.
By carefully monitoring these momentum shifts, traders can gain deeper insights into the underlying market dynamics and better prepare for future price movements.
🔹 DETAILS
The indicator’s momentum visualization is presented directly over the current price action, enhancing traders' ability to rapidly interpret momentum without additional chart clutter:
✅ Green Line: Positive momentum (bullish bias).
❌ Red Line: Negative momentum (bearish bias).
The vertical distance between the Momentum Trend Strength line and price visually indicates momentum intensity:
Larger distance: Signifies stronger market momentum.
Smaller distance: Suggests weakening momentum or neutral conditions.
🔹 Interpretation
Key interpretations include:
Bullish Confirmation: Sustained green lines indicate robust buying activity and confirm bullish trends.
Bearish Confirmation: Persistent red lines suggest strong selling pressure and validate bearish market sentiment.
Early Reversal Signals: Color transitions alert traders to potential market reversals, providing early opportunities to reassess trades.
🔹 Practical Application
Traders commonly integrate Momentum Trend Strength (MTS) into their broader trading strategies by:
Confirming directional trends alongside price action analysis.
Identifying optimal trade entry and exit points during momentum shifts.
Reducing market noise through customizable smoothing, enhancing clarity of momentum signals.
🔹 SETTINGS
📌 Momentum Parameters
Length: Adjusts sensitivity for momentum detection, influencing how quickly momentum shifts are identified.
EMA Smoothing: Determines the level of noise filtering, balancing signal responsiveness and smoothness.
📌 Visualization
Automatic color adaptation clearly signals bullish or bearish momentum.
Simple default visualization settings optimize usability for traders across various markets and timeframes.
🔹 ADDITIONAL NOTES
The Momentum Trend Strength (MTS) indicator provides traders with a straightforward yet powerful visualization of momentum directly on the price chart. Its intuitive nature and adaptive settings make it a valuable addition to various trading approaches and analytical methods, helping traders confidently interpret market movements and momentum dynamics in real-time.

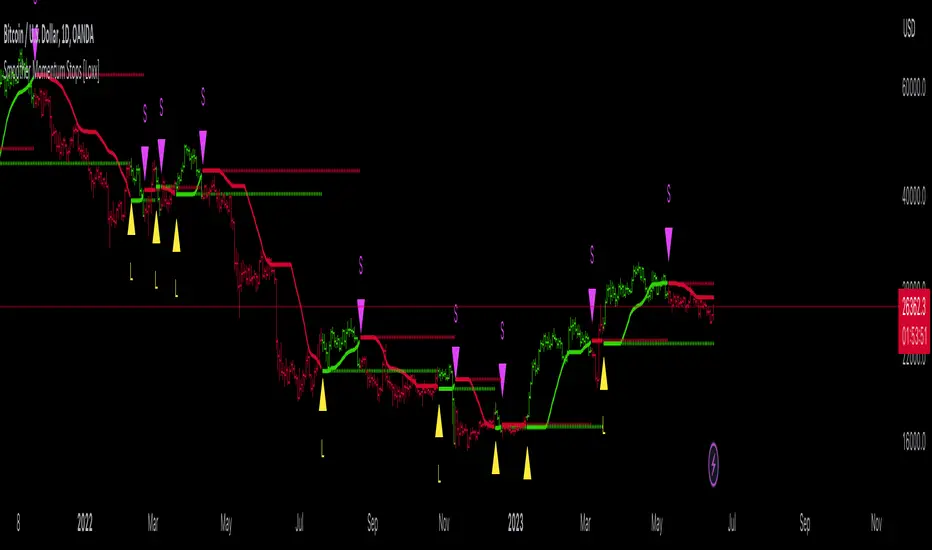
Smoother Momentum Stops [Loxx]Smoother Momentum Stops (SMS) is a dynamic tool that combines the logic of momentum and moving averages to create an overlay of the market price and generate potential trade signals. The original idea for this indicator comes from the beloved and esteemed trading indicator guru Mladen Rakic.
Understanding the Framework
The SMS incorporates various aspects of technical analysis, including momentum calculation, several types of moving averages, and an intelligent stop-and-reverse system that determines when to enter and exit trades.
The indicator initiates by defining the color scheme for visualization, specifically green for bullish trends and red for bearish trends. It further utilizes the 'smmom' and 'fema' functions to calculate smoothed momentum and fast exponential moving averages, respectively. The values computed by these functions are central to the signal generation process.
Momentum Calculation
The 'smmom' function serves to calculate a smoother momentum by taking a source (such as the closing price) and a period as inputs. This function employs a complex algorithm involving exponential moving averages (EMA), wherein two EMAs are calculated with different smoothing factors, and the difference between the two results is returned as the output. This smooth momentum calculation assists in eliminating unnecessary noise from the market and delivers more reliable momentum readings.
Moving Averages Computation
One key feature of the SMS is the ability to select from five different moving average types: Exponential Moving Average (EMA), Fast Exponential Moving Average (FEMA), Linear Weighted Moving Average (LWMA), Simple Moving Average (SMA), and Smoothed Moving Average (SMMA). The 'variant' function assigns the chosen method to the '_avg' variable, which is then used in the trade signal logic.
Trade Signal Generation
SMS employs a complex yet robust mechanism for generating trade signals. A stop-and-reverse system is established, which works on the principle of momentum. If the smoothed momentum is positive, an upper stop is determined and if the momentum is negative, a lower stop is defined.
The process continues by defining long and short entry conditions. The indicator goes long when an upper stop exists, and the previous bar had a lower stop, signifying a shift in momentum. The short entry condition is the opposite: the indicator goes short when a lower stop exists, and the previous bar had an upper stop. Alerts are generated for each of these conditions, helping traders to take timely action.
Visual Representation and UI Options
In terms of visual representation, the indicator plots upper and lower stops, employing green color for upper and red for lower stops. If the option to color bars is chosen, the entire bar is colored green or red, based on whether an upper or lower stop exists. This feature allows traders to visually comprehend market conditions better. Support and reisstance levels are also provided for visual context.
Conclusion
The Smoother Momentum Stops indicator is a potent tool for traders seeking to optimize their trading strategies. It blends the fundamentals of momentum and moving averages, resulting in a robust system that provides clear, reliable, and timely trading signals. By adjusting the smoothing type and period parameters, traders can customize the indicator to fit various market conditions and asset types, thereby adding a layer of flexibility to their trading strategies.
The use of a stop-and-reverse system adds a layer of risk management by offering precise entry and exit points based on momentum shifts. These stops are not just mere levels of entries or exits, but they reflect the undercurrent of the market's momentum, thus providing a dynamic framework to make informed trading decisions.
Additionally, the SMS indicator offers visual simplicity. The color-coded bars and distinct symbols for long and short positions make it easier for traders to interpret the signals and market direction quickly. Combined with the alert system, it ensures that traders never miss an important trading opportunity.
Finally, the power of the SMS indicator lies in its adaptability and comprehensive approach. By providing a selection of moving averages and an intelligent momentum-based system, it encapsulates various aspects of market behavior. As such, it is a useful tool not just for momentum traders, but for any trader who understands the significance of moving averages and momentum in predicting market movements.
In conclusion, the Smoother Momentum Stops indicator stands as an innovative, adaptable, and powerful tool for the modern trader. Its blend of flexibility, dynamic risk management, and straightforward visualization offer a comprehensive solution for traders looking to navigate the complex world of financial markets. With a detailed understanding of its workings as presented in this essay, traders can harness its full potential to optimize their strategies, manage risk, and achieve their trading objectives.
Entropy, Liquidity, and Momentum - ELMoELMo is a momentum trading strategy based on two concepts: entropy and liquidity
The core concept behind the strategy is twofold: trade based on reversals in momentum based on the strength of a trend, and trade when market liquidity is beneficial to the position.
Entries and exits are determined by first calculating Shannon entropy for the time series and applying various moving averages. Separately, the Hui-Heubel Liquidity Ratio (lhh) is calculated and applied as a filter. Finally, additional conditionals such as RSI are applied to reduce false entries.
Entropy is defined as the amount of 'randomness' in a system and in this application can be thought of as a measure of the strength or weakness of a trend. The main moving averages and visible components in ELMo represent the normalized entropy score of the 'close' value (0 is series minimum, 1 is maximum). lhh will measure illiquid/fragile markets with low values and liquid/resilient markets with a high value. In general, the strategy will prefer to enter long when liquidity is high and short when liquidity is low, based off of cross events in the displayed entropy moving averages. I have published lhh as a separate indicator but it is not required for this strategy to function.
Several settings can be configured inside the strategy, including long/short bias, lookback window, MA band lengths, RSI boundaries, and more, but I have tried to choose sensible defaults that work for a large variety of situations and equities. My preferred time scales are 1m 1h 4h 1d 1w 1mo but others may work fine. Trailing stops are implemented using configurable ATR values. Additional settings are available to limit entry times (default is set to US options market open/close), and backtesting start date.
The long strategy is generally more accurate than short. Since Pinescript does not have a way to manage long/short exposure in a hedged fashion, I prefer to run two separate instances of ELMo in long-only and short-only modes for signaling. I prefer to trade this strategy with a long bias using the short signals as indications of windows of weakness where hedging could be prudent.

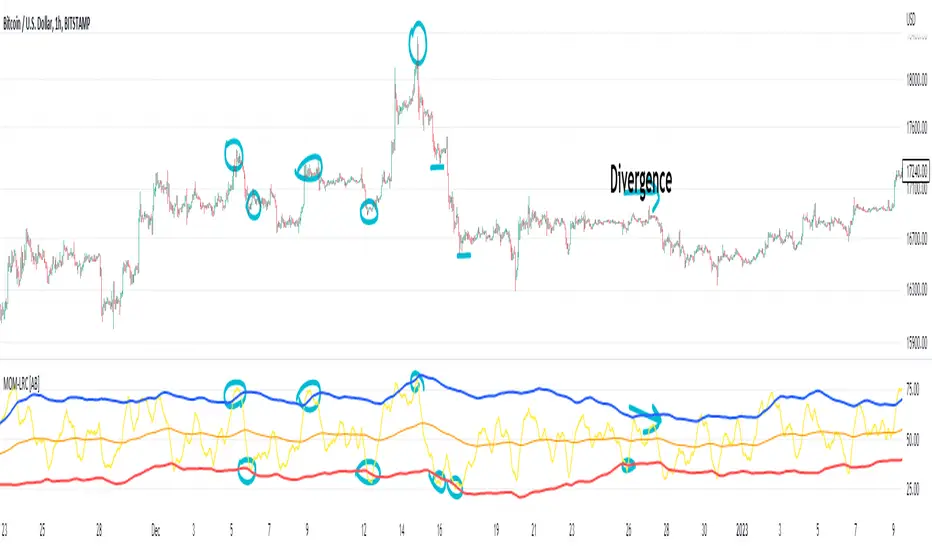
(Very promising) [Abdullah Ahmed] Momentum indicator V.1Description: MOM-LRC is a powerful technical analysis indicator designed to provide traders with signals based on the momentum of an asset's price and its deviation from its mean value. The indicator calculates the exponential RSI and uses a custom function to determine the percentage change from the mean. The upper and lower bands of the momentum channel are then calculated using linear regression of the rate of change from the mean. The channel multiplier can be adjusted to increase or decrease the sensitivity of the indicator.
How to use :
1 - Using MOM-LRC , look for buy signals when the price of the asset is below the lower border of the channel and retracing up. The opposite is true in the case of sell signals.
2 - It is also used in the case of negative and positive divergences, just as you use RSI
The indicator can be used on any time frame and any asset, making it a versatile tool for traders of all levels.
features:
Calculates exponential RSI and percentage change from the mean
Uses linear regression to calculate upper and lower bands of momentum channel
Adjustable channel multiplier for increased sensitivity
Suitable for any time frame and any asset
Happy trading!
8 Day Run - Momentum StrategyInspired by Linda Bradford Raschke.
Entry criteria:
This strategy is used to capture momentum effects on the daily periodicities. Once prices have had a run of 8 or more consecutive closes above or below the 5-period simple moving average the strategy is primed to trade.
It will then enter a short on the first close above the 5sma after a run of 8 or more closes below the 5sma (it will enter a long when the price closes below the 5sma after a run of 8 or more closes above the 5sma).
Exit criteria:
All trades are exited on the first close back above/ below the 5sma.

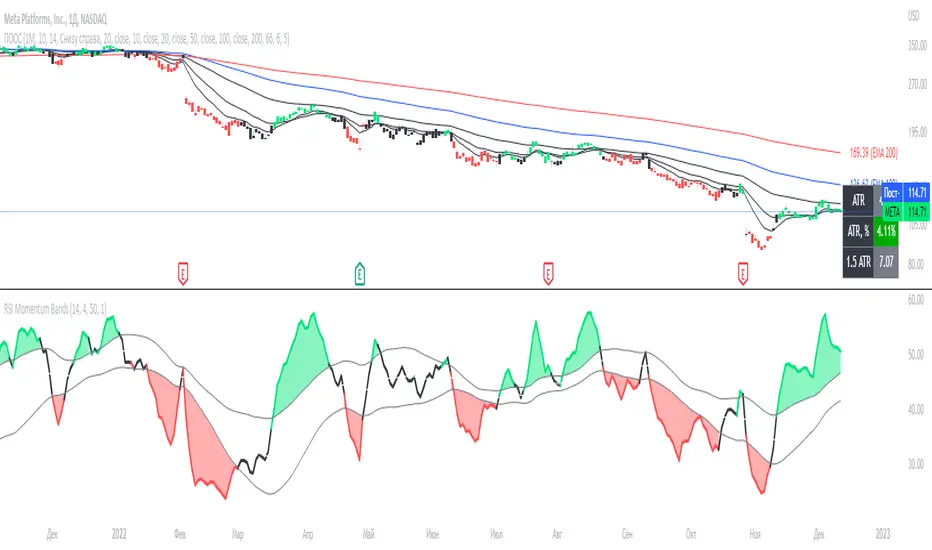
[EDU] RSI Momentum BandsRSI Momentum Bands serve a purpose to find best RSI momentum for entering a trade.
Indicator is built simply:
1st RSI MA is smoothed RSI by little period, 2nd RSI MA is smoothed RSI by a bigger period.
Then we calculate standard deviation from the 2nd MA and make upper and lower band.
The rules for trades are simple:
When RSI is above higher band - Buy ;
When RSI is below lower band - Sell .
The indicator is for educational purposes only to present trades a momentum bands concepts, widely used across professionals.
Hope you will find it helpful.
Take your profits!
- Tarasenko Fyodor
Relative Strength MomentumThe RSI is a traders friend - it can provide insight that other indicators simply cannot. The RSI achilles heel is that it can often fail to highlight divergence. Constance Brown attempted to resolve this problem with the 'Composite index' - a powerful tool. However.. for me, looking at two indicators can get a bit much - especially if viewing multiple time-frames. I want one tool which provides the RSI, it's ranging/reversal behaviour (as documented by Andrew Cardwell) and a better grasp of momentum swings (via divergence and reversal signals). So this is my best effort, and I hope it can prove useful to some of you. At first the differences may be hard to spot - but they are there!
My default settings are optimised - as with the 'normal' RSI you can expect a bullish trend to result in few (if any) moves below 30. In a bearish trend, you can expect few (if any) incursions above 70. Cardwell's observations apply. I recommend using this with a 50 period EMA to provide some additional context.
OBV with Volume/Momentum DivergenceCredits go to vyperphi696 and LazyBear for the original OBV with Divergence script.
This indicator has the new option to check for momentum divergence, which I have done by adding RSI and MACD data.
Hence the indicator allows combined testing of volume and momentum divergence. This feature aims to improve trend reversal detection by reducing false positives.
In summary, 3 divergence categories are shown by default as lines:
Volume + RSI + MACD (dark green/red)
Volume + RSI / Volume + MACD (light green/red)
Volume (gray)
Line colors can be adjusted via plot settings. Therefore it is also possible to distinguish Volume + RSI and Volume + MACD divergence if necessary.
Lastly, I edited the indicator scaling mechanism when changing from one timeframe to another; the transitions are smoother now. This only applies when auto-scaling is off.

Squeeze Momentum with DMI confirmation strategyThe script combines Squeeze Momentum and Directional Movement Index (DMI) confirmation. It provides long and short entry and closure daily trade signals, suitable for Spot, Marginal and Futures exchanges
The strategy components are customizable:
Change risk management settings (take profit, stop loss, trailing)
Change signals filters
Enable TrueRange or disable
Change lengths and periods of components
Advantages:
1. Deal start condition includes the following filters and requirements:
Momentum value is adjusted using a relative proportion of volume at each timeframe scale to exclude a chance of opening position at a low impulse stage
Squeeze momentum trigger condition is automatically checked before a position is opened
+DI , -DI and ADX values are taken into account to confirm the trend direction
2. Exit positions using unique risk management settings for each asset
3. Strategy allows to connect broker or automatic trading system using web hook alerts
If you want to obtain access to the strategy please send us a personal message
THE HITMAN - Market Momentum FinderThe Hitman indicator is a tool to detect momentum swings in the market. Its intention is to identify good entry and exit points and alert you to have a closer look at the charts. It can be used on any chart, timeframe or market.
In detail we measure the strength of a trend by different values like volatility , price averages and trend momentum and calculates for every candle, if a change in trend appears or not.
Be aware, that all results will be based on data from the past. There is no guarantee that the results you get by back testing, will also be achieved in the future.
How to use it?
We recommend to use the signal only in direction of the trend. It can be used to scalp against the trend but for Risk Management reasons we advise not to do so. In sideways movement we recommend to look out for channels or levels of resistance and support and use the signal of the script as confirmation.

Renko - RSI MomentumIn essence this Renko trading system is the following:
1. Momentum based entries
2. Trend trading system (small losses, big wins)
3. As well as a trend continuation system
------------------------------
!IMPORTANT!
------------------------------
- You MUST have a Pro+ account. Why? Cause Renko NEEDS to run on 1min or 5min chart, nothing larger.
If you don't, the chart will repaint .
------------------------------
CHART SETUP
------------------------------
1. Set chart to Renko
2. Set period of chart to 1 min (or 5 min)
3. Set Renko box size method to "Traditional"
4. Set Renko box size to:
- JPY Pairs: 0.2 to 0.4
- Other Major/Minors: 0.002 - 0.004
- Exotic pairs: NO IDEA... (I haven't tested them yet)
5. Load the indicator
------------------------------
RULES
------------------------------
Trend Entry
An arrow will appear the following conditions are met:
LONG: RSI(7) goes above 55 AND price is above the 50 SMA
SHORT: RSI(7) goes below 45 AND price is below the 50 SMA
Enter immediately after the bar is printed.
Counter Trend Entry
An orange dot appears when the following conditions are met:
LONG: RSI(7) goes above 55 AND price is below the 50 SMA and above the 10 EMA
SHORT: RSI(7) goes below 45 AND price is above the 50 SMA and below the 10 EMA
I would not suggest entering immediately but rather finding a trendline or support/resistance that is being broken.
Exit
- Exit when a white bar is printed
- OR use your own discretion. Like 2 bars in opposite direction or on EMA cross or hit of support/resistance.
------------------------------
CHART
------------------------------
- Green bars are when the RSI(7) is above 55.
- Red bars are when the RSI(7) is below 45.
- White bars are when the RSI(7) is between 45and 55.
------------------------------

Edge of MomentumThe script was designed for the purpose of catching the rocket portion of a move (the edge of momentum).
Long
--When RSI closes over 60, take long order 1 tick above that bar. The closed bar above RSI 60 will be colored "green" or whatever color the user chooses. (RSI > 60)
--On a long position, exit will be a closed bar below the ema (low, 10) . The closed bar below the ema will be colored "yellow." (Price < ema)
--Note: On a long position there is no need to exit when a closed bar is colored "purple." RSI is just below 60 but above 40. Pullback or chop
Short
--When RSI closes below 40, take a short order 1 tick below that bar. The closed bar below RSI 40 will be colored "red." RSI<40)
--On a short position, exit will be a closed bar above the ema (low, 10). The closed bar above the ema will be colored "purple." (Price > ema)
--Note: On a short position there is no need to exit when a closed bar is colored "yellow."
Note: You may see a series of purple and yellow bars, that is simply chop. I define chop as RSI moving between 60 and 40.
Trade should only be taken above green colored candle(long) and below red colored candle (short). No position should be taken off yellow or purple candle (chop)
Again this is designed to catch the momentum part of a move, and to help reduce some entries during chop. It is a simple systems that beginning traders can use and profit from.
Note: I don't no shit about coding scripts I just learn from reading others.
Enjoy. If you decide to use please drop me a line...suggestions/comments, etc.
Best of luck in all you do.

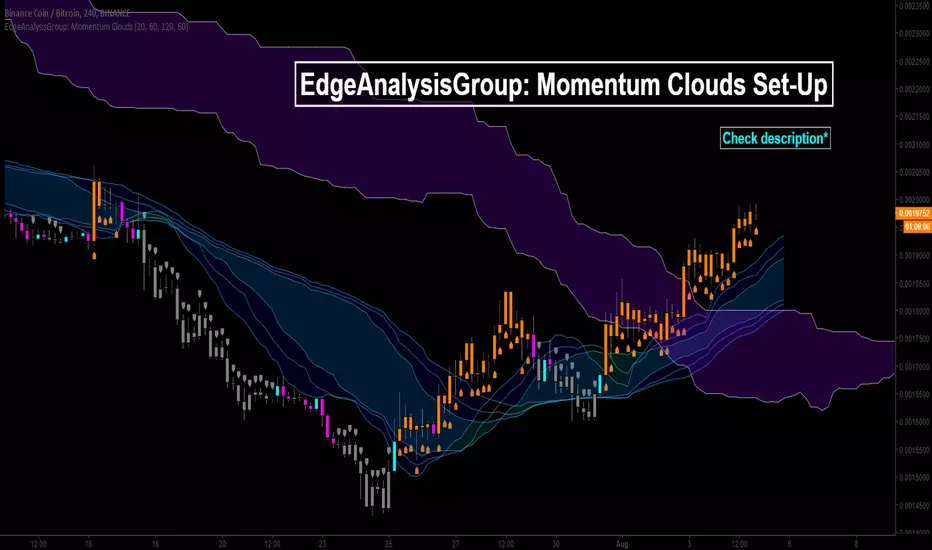
EdgeAnalysisGroup: Momentum Clouds Set-UpWhat do you need turned off and on in the settings to have this exact setup?
Bar colours transparency = 100%
Lagging Span off
Baseline off
Conversion line off
What is it?
This trading strategy is an all in one. This means any additional parameters could make the set-up very noisy. I spent hours developing and back-testing the core of the whole method- volume clouds. The volume cloud is the wavey/much more fluid centralised cloud. These have in essence been left the same with new additions crafted around the volume clouds, the ichi and the momentum indicator. It Uses-
Volume
MA's
Ichimoku Clouds
Displacement
RSI
MACD
Even though your fundamental price action will come into play when using this indicator- it does abstract resistance/support zones and trade zones very nicely to make the overall difficulty of the indicator and trading experience much lesser.
How to trade on it?
Trade edge to edge on the clouds.
Mid-section is safe trade area on volume cloud.
Trade re-tests / rejections. Watching for 3rd retest + for break back into cloud.
Bullish mom + break above vol cloud = Bullish trend.
Bearish mom + break below vol cloud = Bearish trend.
Stoploss is situational.
Example board:
BTC/USD 1 Day.
ETH/BTC 1 Day.
NEO/BTC 4 Hour.
Hopefully from these examples, when observing them you are understanding how the clouds work, and how the momentum ties into the whole model, any questions don't hesistant to comment- and feel free to drop me a follow for my hard work too.
Thank you for reading, I hope this indicator can aid you, as it is doing with a few of my friends and myself.
All information found here, including any ideas, opinions, scripts, views, predictions, forecasts, commentaries, suggestions, or stock/cryptocurrency picks, expressed or implied herein, are for informational, entertainment or educational purposes only and should not be construed as personal investment advice. These are not facts but my personal views and opinions.
I will not and cannot be held liable for any actions you take as a result of anything you read here.
DecisionPoint Price Momentum Oscillator [LazyBear]The DecisionPoint Price Momentum Oscillator (PMO) is an oscillator based on a Rate of Change calculation that is smoothed twice with custom exponential moving averages. Because the PMO is normalized, it can also be used as a relative strength tool.
PMO can be used in many ways:
- PMO can be used to determine the OB/OS state. While the +2.5 to -2.5 is the usual range for broad stock market indexes, each price index will have its own “signature” range. You may have to tune this for your instrument.
- PMO triggers buy/sell on signal crossovers and ZERO crossovers.
- Common patterns like BullKiss, BearKiss are useful to track. See the link below for more info.
- Divergences.
- Histo-only mode that can be used similar to MACD-Histo.
I have exposed all params as configurable. Have fun tuning :) Don't forget to share what you found for your instrument.
More Info:
stockcharts.com
List of my public indicators: bit.ly
List of my app-store indicators: blog.tradingview.com
Some Sample Charts:
TWTR:
MSFT:
GOOGL:

Composite Momentum Index [LazyBear]This is a composite oscillator derived from modified 5/10/20 Chande's Dynamic Momentum Index values.
Volatility is factored in, by design. Look for OB/OS extremes and divergences.
I added the green/red ribbon look to make it easy to read :)
More info:
www.investopedia.com
List of my public indicators: bit.ly
List of my app-store indicators: blog.tradingview.com

M0PB (Momentum Pullback)Long/short strategy that identifies extreme readings on the rsi as a *momentum signal*, unlike most RSI strategies the script will look to buy or sell the first pullback in the direction of the extreme RSI reading.
Enters positions on the first pullback to the 5ema(low)/ 5ema(high) and exits at rolling 12 bar high/ low. The rolling high/ low feature means that if the price enters into a prolonged consolidation the profit target will begin to reduce with each new bar. The best trades tend to work within 2-6 bars.
Built for use on 5 min intervals on FX, Indexes, and Crypto. Lower than 5 minute time frames tend to be noisier and mean more commissions and a higher risk of slippage so the suggested timeframe is 5 mins.
Hard stop is X ATR (users can experiment with this) from the position entry price. This can be adjusted in user inputs.
There is a lot of slack left in entries and exits but the overall strategy is fairly robust across timeframes and markets and has between 60%-70% win rate with larger winners.
Signals that occur from economic news volatility are best avoided.

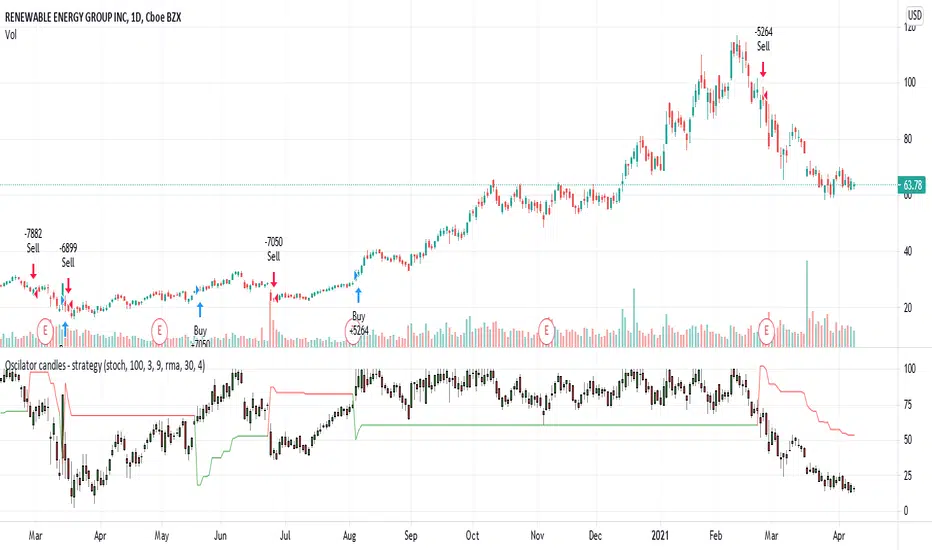
Oscilator candles - momentum strategyThis is momentum based strategy based on indicators published earlier:
Also trying to use delayed supertrend based on steps as mentioned in the published indicator:
Added option to filter trade entries based on higher timeframe pivots. But, it is not so effective and may need further optimization.