DepthHouse RSI Grid MTFDepthHouse RSI Grid MTF is used to determine overbought and oversold levels based on the RSI across multiple time frames.
The default time frames are the 30m, 2H, 8H and 16H however these are completely adjustable.
This indicator also allows the user to select which RSI band to display based on the time frame.
The default is set to the current time frame, however the user can select any of the other four time frames.
OverBought & Oversold Levels are also entirely adjustable.
Meaning you can adjust the 30, 70 ranges, and it will alter the overbought and oversold values across ALL timeframes.
How to get:
As you can see this is an invite only script. In the coming month this indicator, along with many others will become pay to use only. (website on my profile page)
However all my indicators will be FREE until May 1, 2018 . So please try them out!
To take advantage of this free trial:
Just leave a comment!
IF you are viewing this after May 1st. Please feel free to send me a PM or visit my website.
Поиск скриптов по запросу "mtf"

DepthHouse MTF Volume FlowDepthHouse MTF Volume Flow Indicator is an amazing tool used to help determine market direction on multiple time-frames based on the the traded volume.
This indicator is a superb upgrade to my original volume flow indicators.
You now how the option to adjust the displayed volume timeframe, which in turn adjusts the Volume Flow Moving Averages , along with the new Breakout Candle feature.
Additionally, the background colors represent the volume flow crossovers on the primary time-frame, along with three addition time-frames that are user adjustable.
The primary volume flow crossover is shown on the top of the grid, followed by the First Additional Time Frame and then so on down to the bottom.
I generally have this set with the lowest timeframe value at the top, followed by the next one in line.
For those of you who wish to set the current timeframe greater than the rest. I have built in a grid separator feature which will separate it from the rest of the background crossovers.
My MA Settings:
I generally have my Moving Averages set anywhere from 7-14
Breakout Factor:
I generally have the breakout factor set at 1.5 or 2.5
Note: Since volume amounts vary across the board. The background height is set to readjust based on the highest bars. This lookback amount is adjustable by the user and it does not affect calculations what so ever.
How to get:
As you can see this is an invite only script. In the coming month this indicator, along with many others will become pay to use only. (website on my profile page)
However all my indicators will be FREE until May 1, 2018 . So please try them out!
To take advantage of this FREE trial:
1. Leave comment on this indicator post! Maybe even give me a follow :D
2. Check out and take advantage of all my other indicators!
I hope you all enjoy!

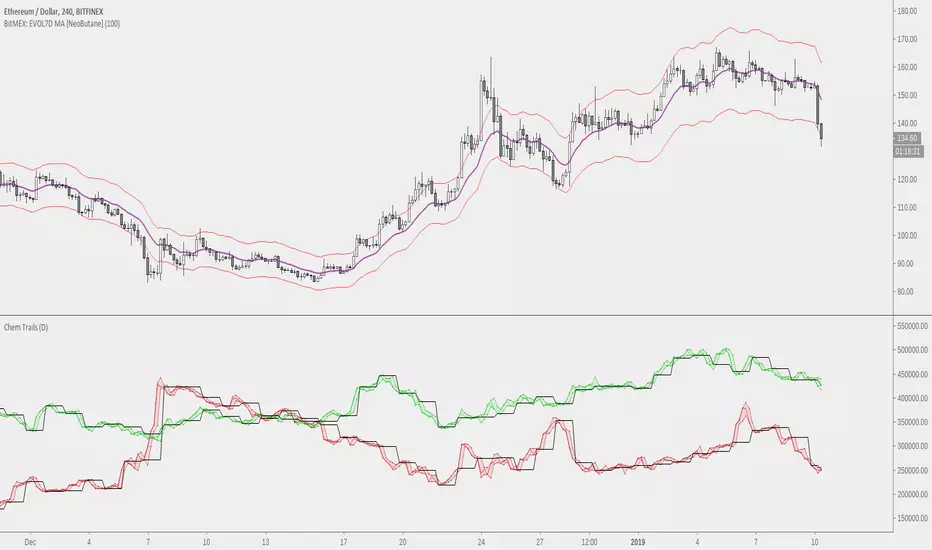
NeoButane Bitfinex BTC Longs vs. Shorts Tickers Simplified (MtF)With optional overlay for high/low candle values and daily resolution close. Now with MtF to add customization .
Made because I'm too lazy to constantly re-add tickers and to reduce noise.

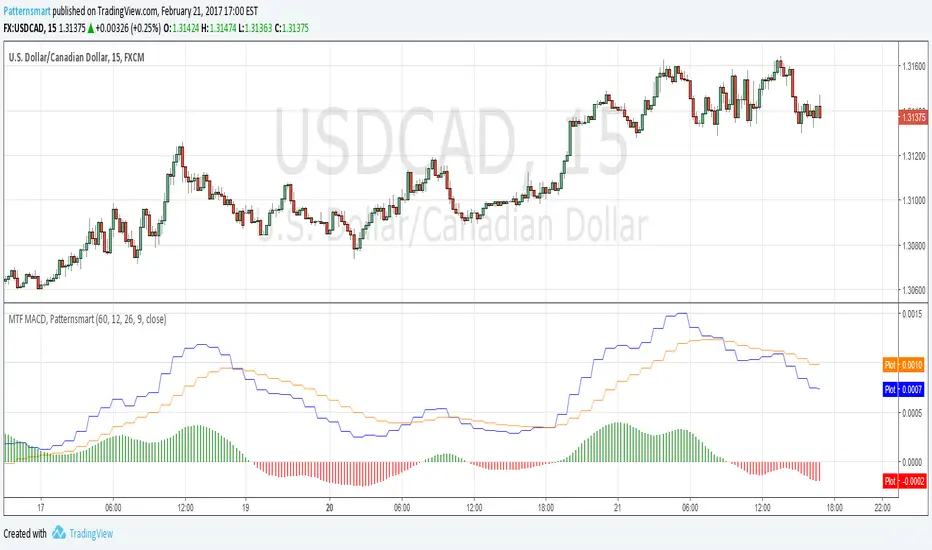
Multi time frame (MTF) MACD indicator by PatternsmartThe real Multi time frame (MTF) MACD indicator.
It simply makes possible for you to read MACD value from higher timeframes.
It also comes with the original MACD inputs.
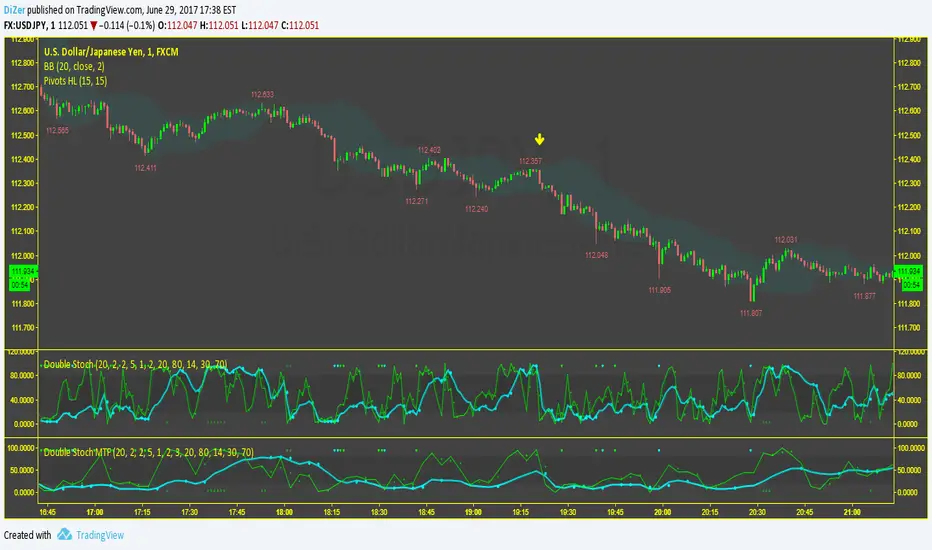
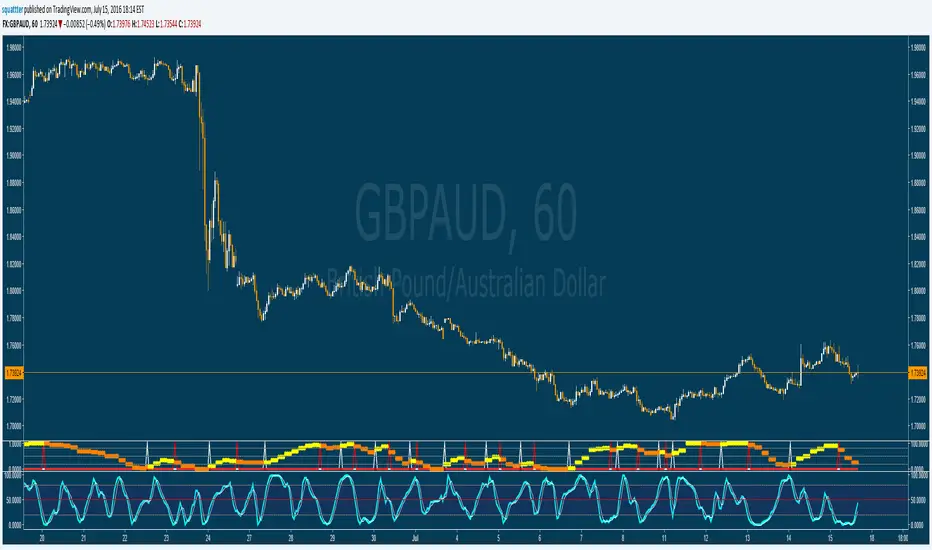
Stochastic RSI - MTF - Up/down colours - 4hr default - squattterStochastic RSI - MTF - Up/down colours - 4hr (240) default
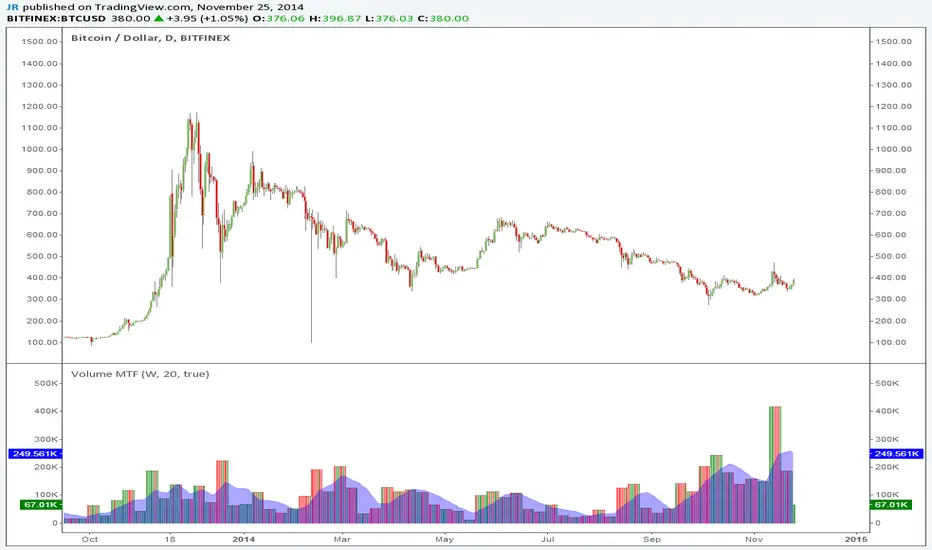
Volume MTFThis is a simple indicator you can use to separate volume from price on your chart. You can also select different time frames (MTF).
Thanks to LazyBear for cleaning up my previous messy code.
MTF Step EMA With ColorMTF Stepped EMA – Dynamic & Color-Coded (Green / Red / Yellow)
This indicator plots a higher-timeframe EMA as a stepped line (staircase style) directly on your current chart, with smart dynamic coloring:
- Green → The stepped EMA is actively rising (higher highs in the staircase) → bullish higher-timeframe momentum
- Red → The stepped EMA is actively falling (lower lows in the staircase) → bearish higher-timeframe momentum
- Yellow → The EMA has been flat (no new step) for a user-defined number of bars → consolidation / range phase
Features
• Fully dynamic – updates instantly when the higher-timeframe EMA changes
• Clean step-line style (plot.style_stepline) – no diagonal lines, pure staircase
• Automatic color switching based on the actual direction of the last step
• Yellow "flat" detection after X bars without movement (customizable)
• Thin reference line of the original smooth higher-timeframe EMA (optional)
• Very lightweight and repaints-free (uses proper request.security)
How to use
• Classic setup: Daily or Weekly EMA 50/200 on 1H or 4H charts
• Green steps → look for longs in lower timeframes
• Red steps → look for shorts
• Yellow → caution or stay out – higher timeframe is ranging
Perfect for multi-timeframe trend confirmation, pullback trading, and avoiding choppy markets.
Enjoy & trade safe!

MTF Dashboard Pro - Sachin ThakareMTF Dashboard Pro — Sachin Thakare
Version: 1.0
Overview:
A compact multi-timeframe dashboard built for intraday and swing traders. Shows per-TF values + signals:
- Change, %Chg, VWAP, EMA9/21, 200MA distance (with user threshold), SuperTrend, RSI, MACD, ADX, Alligator, Stochastic, ATR, PH/PL and Bias.
- Optional TrendShift flag (MSS + EMA9/21 confirmation) appears alongside Bias.
Notes:
- Pine Script v5. Adjust inputs to match your asset/timeframe. Default EMAs: 9 (red) and 21 (green).
- ma200Thresh parameter filters noise around 200MA (unit = percent). Recommended: 0.3–0.7 for intraday scalping.
- Use on desktop charts — table is not optimized for small mobile screens.
Disclaimer:
This indicator is educational and provided “as is”. Not financial advice. Test before trading.
Changelog:
1.0 — Public release
Author:
Sachin Yashwant Thakare

MTF RSI Stacked + AI + Gradient MTF RSI Stacked + AI + Gradient
Quick-start guide & best-practice rules
What the indicator does
Multi-Time-Frame RSI in one pane
• 10 time-frames (1 m → 1 M) are stacked 100 points apart (0, 100, 200 … 900).
• Each RSI is plotted with a smooth red-yellow-green gradient:
– Red = RSI below 30 (oversold)
– Yellow = RSI near 50
– Green = RSI above 70 (overbought)
• Grey 30-70 bands are drawn for every TF so you can see extremities at a glance.
Built-in AI (KNN) signal
• On every close of the chosen AI-time-frame the script:
– Takes the last 14-period RSI + normalised ATR as “features”
– Compares them to the last N bars (default 1 000)
– Votes of the k = 5 closest neighbours → BUY / SELL / NEUTRAL
• Confidence % is shown in the badge (top-right).
• A thick vertical line (green/red) is printed once when the signal flips.
How to read it
• Gradient colour tells you instantly which TFs are overbought/obove sold.
• When all or most gradients are green → broad momentum up; look for shorts only on lower-TF pullbacks.
• When most are red → broad momentum down; favour longs only on lower-TF bounces.
• Use the AI signal as a confluence filter, not a stand-alone entry:
– If AI = BUY and 3+ higher-TF RSIs just crossed > 50 → consider long.
– If AI = SELL and 3+ higher-TF RSIs just crossed < 50 → consider short.
• Divergences: price makes a higher high but 1 h/4 h RSI (gradient) makes a lower high → possible reversal.
Settings you can tweak
AI timeframe – leave empty = same as chart, or pick a higher TF (e.g. “15” or “60”) to slow the signal down.
Training bars – 500-2 000 is the sweet spot; bigger = slower but more stable.
K neighbours – 3-7; lower = more signals, higher = smoother.
RSI length – 14 is standard; 9 gives earlier turns, 21 gives fewer false swings.
Practical trading workflow
Open the symbol on your execution TF (e.g. 5 m).
Set AI timeframe to 3-5× execution TF (e.g. 15 m or 30 m) so the signal survives market noise.
Wait for AI signal to align with gradient extremes on at least one higher TF.
Enter on the first gradient reversal inside the 30-70 band on the execution TF.
Place stop beyond the swing that caused the gradient flip; target next opposing 70/30 level on the same TF or trail with structure.
Colour cheat-sheet
Bright green → RSI ≥ 70 (overbought)
Bright red → RSI ≤ 30 (oversold)
Muted colours → RSI near 50 (neutral, momentum pause)
That’s it—one pane, ten time-frames, colour-coded extremes and an AI confluence layer.
Keep the chart clean, use price action for precise entries, and let the gradient tell you when the wind is at your back.

MTF RSIMTF rsi shows the diffrent time frame rsi at one time frame.you can use this strategy for scalping/swing trading.

MTF Multi EMA - IntradayMTF Multi EMA – Intraday
Purpose:
To quickly analyze trend direction and alignment across multiple timeframes (1m, 3m, 5m, 15m, 30m, and 60m) using fast and slow EMAs for each timeframe — and combine them into a simple “stack score” for easy visual decision-making. The script is tuned for Intraday Trading indicator by default.
Concept
Each timeframe (TF) — like 1m, 3m, 5m, etc. — has two EMAs:
A fast EMA (shorter length)
A slow EMA (longer length)
When the fast EMA > slow EMA, that timeframe is bullish.
When the fast EMA < slow EMA, that timeframe is bearish.
By combining multiple timeframes together, the indicator helps you:
Identify when all trends align bullishly (strong buy bias)
Identify when all trends align bearishly (strong sell bias)
Stay out during mixed or sideways phases
Inputs Explained
Setting Description
1m / 3m / 5m / 15m / 30m / 60m EMA Lengths Controls the EMA period for each timeframe’s fast and slow EMAs.
Fast EMA Color Color for all fast EMAs plotted on chart.
Slow EMA Color Color for all slow EMAs plotted on chart.
Use Smooth Interpolation Ensures smoother plots when merging higher TF data into a smaller chart (recommended ON).
Show Toggle visibility of each timeframe’s EMAs.
Table Position Lets you move the mini dashboard to any chart corner.
Stack Score
The Stack Score measures how many timeframes are bullish vs bearish:
Stack Score Meaning
+6 All timeframes bullish → Strong Uptrend
+3 to +5 Majority bullish → Bullish Bias
0 Neutral / Mixed → Sideways Market
−3 to −5 Majority bearish → Bearish Bias
−6 All timeframes bearish → Strong Downtrend
Table Display
At the chosen chart corner, you’ll see:
TF Direction
1m 🟢 B (Bullish) / 🔴 S (Bearish)
3m 🟢 B (Bullish) / 🔴 S (Bearish)
5m 🟢 B (Bullish) / 🔴 S (Bearish)
15m 🟢 B (Bullish) / 🔴 S (Bearish)
30m 🟢 B (Bullish) / 🔴 S (Bearish)
60m 🟢 B (Bullish) / 🔴 S (Bearish)
Score Final alignment score (color-coded)
Color meanings:
🟢 Green cell = bullish for that TF
🔴 Red cell = bearish for that TF
The Score cell background color changes with strength:
Bright green → strong bull
Yellow → neutral
Red / Maroon → strong bear
How to Use for Trading (Intraday NIFTY 5m)
Recommended Chart: 5-minute timeframe on NIFTY Futures or major index stocks.
🔹 1. Identify Trend Alignment
When Score ≥ +3 → Market bias is bullish.
→ Look for long entries (buy breakouts or EMA retests).
When Score ≤ −3 → Market bias is bearish.
→ Look for short entries (sell breakdowns or retests).
When Score is between −2 and +2 → Trend is mixed.
→ Best to wait — avoid trading in choppy conditions.
🔹 2. Combine with Price Action
Use it with:
Trendline breaks or retests
Candle confirmation (e.g. bullish engulfing or rejection)
Volume surge
Example:
On NIFTY 5m — if score = +5, price breaks above a descending trendline, and 1m–15m EMAs are all rising → strong long signal.
🔹 3. Avoid Conflicts
If lower timeframes (1m/3m/5m) are bullish but higher ones (30m/60m) are bearish,
→ Trend is short-term bullish but larger bias is down — scalps only, not swings.
Optional Alerts
If you add alert conditions (as suggested earlier):
“Strong Bullish Alignment” triggers when score ≥ +5
“Strong Bearish Alignment” triggers when score ≤ −5
This gives you early alerts when full trend alignment occurs — ideal for breakout setups.
Some more Tips
Use 5m or 15m chart as your main view.
Use Stack Score as a trend filter — trade with it, not against it.
Combine with Breakout + Retest strategy or Trendline color-coded system you’re building.
In sideways days (score near 0), reduce risk or skip trades.

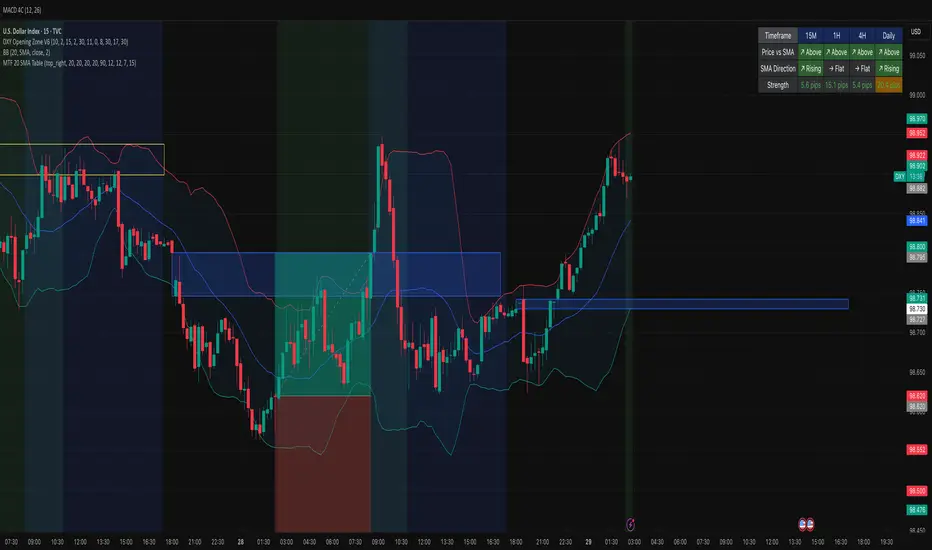
MTF 20 SMA Table - DXY**MTF 20 SMA Table - Multi-Timeframe Trend Analysis Dashboard**
**Overview:**
This indicator provides a comprehensive multi-timeframe analysis dashboard that displays the relationship between price and the 20-period Simple Moving Average (SMA) across four key timeframes: 15-minute, 1-hour, 4-hour, and Daily. It's designed to help traders quickly identify trend alignment and potential trading opportunities across multiple timeframes at a glance. It's definitely not perfect but has helped me speed up my backtesting efforts as it's worked well for me eliminating flipping back and forth between timeframes excpet when I have confluence on the table, then I check the HTF.
**How It Works:**
The indicator creates a table overlay on your chart showing three critical metrics for each timeframe:
1. **Price vs SMA (Row 1):** Shows whether price is currently above (bullish) or below (bearish) the 20 SMA
- Green = Price Above SMA
- Red = Price Below SMA
2. **SMA Direction (Row 2):** Indicates the trend direction of the SMA itself over a lookback period
- Green (↗ Rising) = Uptrend
- Red (↘ Falling) = Downtrend
- Gray (→ Flat) = Ranging/Consolidation
3. **Strength (Row 3):** Displays the distance between current price and the SMA in pips
- Purple background = Strong move (>50 pips away)
- Orange background = Moderate move (20-50 pips)
- Gray background = Weak/consolidating (<20 pips)
- Text color: Green for positive distance, Red for negative
**Key Features:**
- **Customizable Table Position:** Place the table anywhere on your chart (9 position options)
- **Adjustable SMA Lengths:** Modify the SMA period for each timeframe independently (default: 20)
- **Direction Lookback Settings:** Fine-tune how far back the indicator looks to determine SMA direction for each timeframe
- **Flat Threshold:** Set the pip threshold for determining when an SMA is "flat" vs trending (default: 5 pips)
- **DXY Optimized:** Calculations are calibrated for the US Dollar Index (1 pip = 0.01)
**Best Use Cases:**
1. **Trend Alignment:** Identify when multiple timeframes align in the same direction for higher probability trades
2. **Divergence Spotting:** Detect when lower timeframes diverge from higher timeframes (potential reversals)
3. **Entry Timing:** Use lower timeframe signals while higher timeframes confirm overall trend
4. **Strength Assessment:** Gauge how extended price is from the mean (SMA) to avoid overextended entries
**Settings Guide:**
- **SMA Settings Group:** Adjust the SMA period for each timeframe (15M, 1H, 4H, Daily)
- **SMA Direction Group:** Control lookback periods to determine trend direction
- 15M: Default 5 candles
- 1H: Default 10 candles
- 4H: Default 15 candles
- Daily: Default 20 candles
- **Flat Threshold:** Set sensitivity for "flat" detection (lower = more sensitive to ranging markets)
**Trading Strategy Examples:**
1. **Trend Following:** Look for all timeframes showing the same direction (all green or all red)
2. **Pullback Trading:** When Daily/4H are green but 15M/1H show red, wait for lower timeframes to flip green for entry
3. **Ranging Markets:** When multiple SMAs show "flat", consider range-bound strategies
**Important Notes:**
- This is a reference tool only, not a standalone trading system
- Always use proper risk management and combine with other analysis methods
- Best suited for trending instruments like indices and major forex pairs
- Calculations are optimized for DXY but can be used on other instruments (pip calculations may need adjustment)
**Credits:**
Feel free to modify and improve this code! Suggestions for enhancements are welcome in the comments.
---
**Installation Instructions:**
1. Add the indicator to your TradingView chart
2. Adjust the table position via settings to avoid overlap with price action
3. Customize SMA lengths and lookback periods to match your trading style
4. Monitor the table for timeframe alignment and trend confirmation
---
This indicator is published as open source for the community to learn from and improve upon. Happy trading! 📈
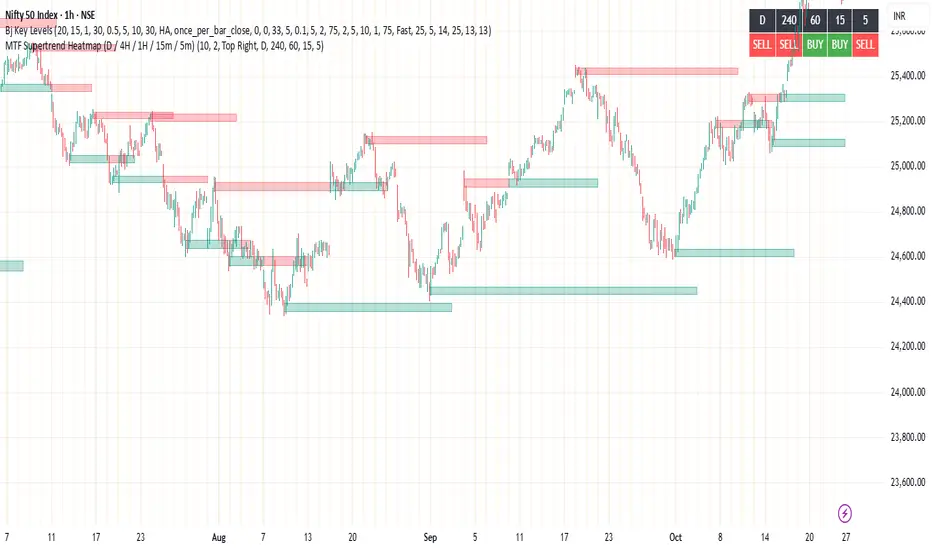
MTF Supertrend Heatmap (D / 4H / 1H / 15m / 5m)MTF Supertrend Heatmap (D / 4H / 1H / 15m / 5m)
A clean dashboard that tells you whether the same Supertrend (ATR Length, Multiplier) is BUY or SELL across five timeframes—all on one chart. Higher-TF values are fetched with request.security() and, when Confirm HTF bar close is ON, they do not repaint after that bar closes.
Optional toggles let you plot the current-TF Supertrend line and show bar-anchored flip markers (BUY/SELL) for each timeframe. Includes alerts for ALL-TF alignment and MAJORITY (≥3/5) agreement. Timeframes and Supertrend parameters are fully configurable. Use the heatmap for quick confirmation, reduce noise by keeping markers off unless needed.
MTF RSI Heatmap)# MTF RSI Heatmap — v2.7.2
**Hybrid Higher-TF Trend + Intraday Impulse Detection + Smart Counters & Alerts**
Turn your lower pane into a **multi-timeframe market bias dashboard**. This heatmap blends classic RSI momentum with a **hybrid Daily/Weekly MA-stack trend** and an **intraday impulse override** that flags fast moves *as they happen*. Clean, configurable, and built for real trading flow.
---
## What it shows
* **6 stacked rows = 6 timeframes** (bottom → top).
* **Colors**: Green = Bull, Red = Bear, Yellow = Neutral.
* **Header counter**: `Bull X/6 | Bear Y/6` = live agreement across visible rows.
* **Impulse markers** ▲/▼ on intraday rows (5m/15m/60m/240m) when a shock move triggers.
* **Signal bar**: A thin column above the top row when at least **N of 6** rows align (configurable).
---
## Why it’s different
* **Impulse Override (intraday)**
Detects sharp moves using % change over the last *N* bars, optionally gated by **volume > SMA × multiplier**. This catches dumps/pops earlier than RSI alone.
* **Hybrid D/W (structure over noise)**
Daily/Weekly rows can use an **MA stack (8/21/55)** instead of RSI for a more stable higher-timeframe trend read. Optional **price > fast MA** filter for stricter confirmation.
* **Intrabar option**
Flip rows **during the bar** for early reads (accepting repaint on TF close), or keep it close-only for no surprises.
---
## Key features
* 🌈 **Theme**: Classic or High-Contrast colors.
* 🧠 **RSI thresholds**: Bull above 55, Bear below 45 (editable).
* 🧲 **RSI smoothing** (EMA) for intraday rows to reduce flicker.
* 🧰 **Compact left legend** with adjustable text size & opacity.
* 🚨 **Alerts**:
* **Impulse-only** (per TF and “any intraday”)
* **N-of-6 confirmation** (bull/bear)
---
## Recommended settings (fast opens & news)
* **Impulse**: `Bars = 1–2`, `Threshold = 0.25–0.35%`, `Vol confirm = ON`, `Multiplier = 1.3–1.5`.
* **Hybrid D/W**: `ON`, `EMA 8/21/55`, `Price filter = ON`.
* **Intrabar**: `ON` if you want intra-bar updates (repaints at TF close).
---
## How to read it
1. **Row scan**: Are the bottom (fast) rows aligning first? That’s early momentum.
2. **Header counter**: Look for 4+/6 agreement as momentum broadens.
3. **Signal bar**: Acts as a “go/no-go” confirmation when your threshold is met.
4. **Impulse ▲/▼**: Use as a **heads-up** for acceleration; then watch if rows cascade in that direction.
---
## Alerts (exact names)
Create alerts with these built-ins:
* **Impulse UP — any intraday**
* **Impulse DOWN — any intraday**
* **Impulse UP — TF1 / TF2 / TF3 / TF4**
* **Impulse DOWN — TF1 / TF2 / TF3 / TF4**
* **Bull confirmation** (N-of-6)
* **Bear confirmation** (N-of-6)
Tip: Use **Once per bar** or **Once per bar close** depending on whether you enabled *Intrabar*.
---
## Inputs overview
* **Timeframes & visibility** per row.
* **RSI**: length, bull/bear thresholds, optional EMA smoothing (intraday only).
* **Impulse**: bars, %, volume confirm, SMA length, multiplier, markers.
* **Hybrid D/W**: MA type (EMA/SMA/HMA), 8/21/55 lengths, price filter.
* **Theme & Legend**: color theme, label size (Tiny/Small/Normal), legend opacity.
* **Signal**: N required for confirmation (default 4).
---
## Pro tips
* Combine with **session opens**, **VWAP**, and **liquidity levels**.
* If you trade breakouts, let **impulse triggers** cue attention, then wait for **N-of-6** confirmation.
* For swing bias, lean on **Hybrid D/W**—it changes slower, but with intent.
---
## Notes & limitations
* **Intrabar = repaint expected** on higher-TF closes—by design for earlier context.
* Colors/thresholds are general guidance, not signals by themselves.
* Past performance ≠ future results; **this is not financial advice**.
---
If you enjoy this, drop a ⭐ and tell me what you want next: background shading on confirmation, tooltips with RSI/ROC per row, or a MACD/RSI hybrid mode. Trade sharp! ✨
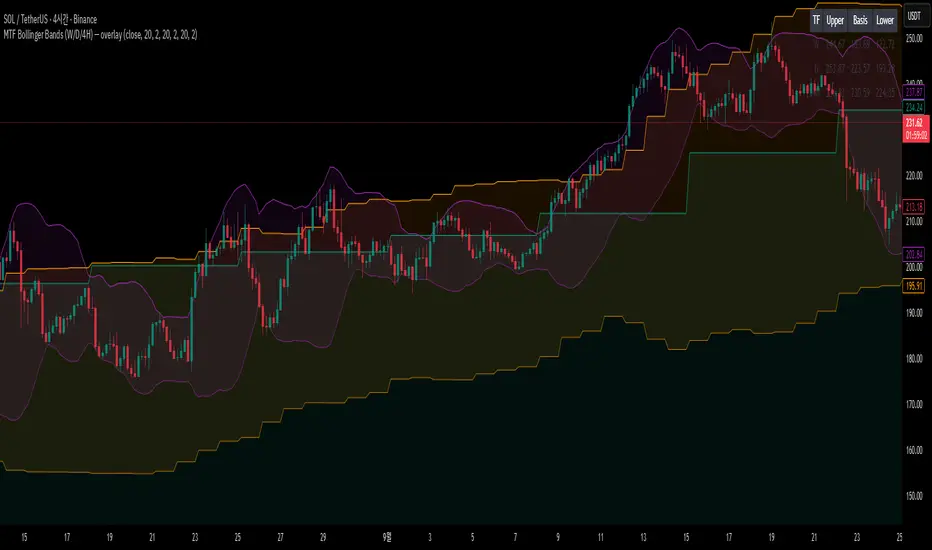
MTF Bollinger Bands (W/D/4H)MTF Bollinger Bands (W/D/4H)
Always mark the 1W 1D 4H bolinger band regardless of the time frame.
MTF Regime + Breakout-Pullback by HarshMTF BTC regime filter + trend filter, Donchian breakout after a pullback, ATR‑based stop, 2 profit targets, trailing runner, and pyramiding into 3 tranches.

MTF QQE Direction TableMTF QQE Direction Table with signals and alerts
select up to 7 TFs to show QQE signals
Select to display OS\OB QQE signals for any time frame on chart
select alert for any time frame selected
Gray timeframe background = unconfirmed signal (TF candle not closed)
No timeframe background = confirmed signal
yellow background signal = Overbought\Oversold signal.

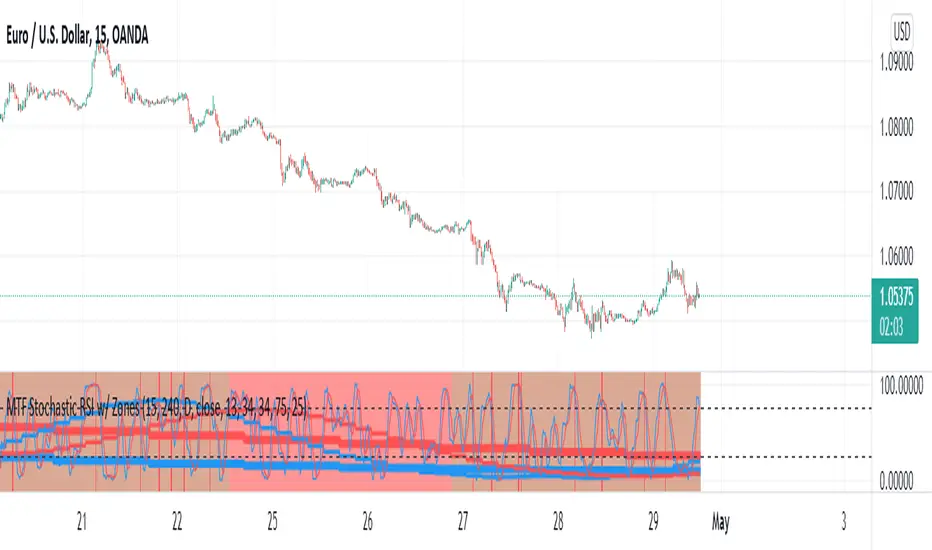
MTF Stochastic RSI w/ ZonesMTF Stochastic RSI w/ Zones by // © KaizenTraderB
I revamped my original Stochastic RSI Band indicator with more accurate algorithms, cleaner coding and more adjustable options.
I will be soon releasing a variation of this indicator that prints over price chart with key candle indicators
This indicator will display the Stochastic RSI in 3 Timeframes of your choice.
It will also display color zones. When the higher timeframe is bullish it will be green and when bullish, red.
When the middle timeframe is counter the higher, it will appear brownish.
The entry timeframe will print red and green lines at bullish and bearish Stochastic RSI crossovers when oversold and overbought, respectively,
In the direction of the higher timeframe directional bias when the middle timeframe is counter that direction to catch reversals in corrections.
The options allow you to turn the lines and zones on and off, as well as which Timeframes you choose to view.
Entry - 1Hr, 15m, 5m Middle Timeframe - 1Hr, 4Hr, Daily Higher Timeframe - 4Hr, Daily, Weekly or Monthly
You can also change the parameters of the Stochastic RSI for each of the three timeframes:
When 8 is chosen for RSI Length, Stochastic Length - 5, SmoothK - 3, Smooth D - 3 For 13 - 8, 5, 5 For 21 - 13, 8, 8 For 34 - 21, 13, 13
Its good practice to adjust settings so Higher Timeframe zones (green/red) correlate with longer trend movements,
Medium Timeframe with corrections and reversal areas (brown) and Entry Timeframe with key reversal candles.
Look at chart for last 200 bars or so and find the settings that correlate with recent past price action and adjust accordingly.
Its also good practice to have the chart timeframe correlate with entry timeframe of indicator.
You can also adjust overbought and oversold areas.
Coding included to prevent repainting
Message me with feedback to improve upon this indicator or requested additions.
MTF Wave Stochastic RSI [Cryptoheat]MTF Wave Stochastic RSI is a multiple time frame Stochastic RSI, based on 3 different timeframes, layered on top of each other. This is a very useful tool when used to confirm and identify Elliott Waves and sub-waves at once.
Each of the three curves is based on a different time frame. While the blue (K2) curve is the current time frame, the gray (K1) is of a faster time frame which is roughly around a third of the time and the green (K3) is of a slower time frame, roughly around 3 times the current time frame. The gray and green curves are based on specific settings that were back-tested and proved more efficient.
Reasoning behind this indicator is that although the normal Stochastic RSI can show divergences more sensitively and faster than the normal RSI indicator, it cannot do so while showing a larger duration backwards in an accurate way for comparisons. It can also not show wave structures and substructures, but rather a top or bottom reversal regardless of the wave structure hierarchy and wave strength. However when several time frames are combined in one indicator, they can reveal much more information about the chart as they can show larger durations next to smaller ones. Therefore they can be used as a confirmation and helper tool to identify Waves and Sub-waves.
This can be done, by looking first at the green curve (slowest RSI) and identifying full moves. A full move is a move from being oversold to overbought and back to being oversold again. A move can be the opposite as well. By identifying the beginning and end of a move of the larger time frame stochastic RSI this can help you see the two waves in each move. One wave up and one wave down. The peak of that wave can be seen either at the highest point of the in-between peak of the green curve or by one of the smaller time frame stochastic RSI tops when the green one is diverging. A look at the price action and application of Elliott Wave knowledge is mandatory, as this indicator is mainly a confirmation tool.
By back-testing it you can see that the larger time frame Stochastic RSI can show you full impulse and corrective waves most of the times, while the lower time frame stochastic RSI should be viewed as potential sub-waves of that main wave structure. Also noticeable are the divergences that can be seen often on the larger time frame Stochastic RSI..
Please note that this tool is not recommended to be used alone as like many indicators, this is a confirmation tool that can help in identifying rather than predicting…
Also for best results Elliot Wave knowledge is recommended…
I prefer to use this indicator along with a normal Stochastic RSI on top of it so I can always see which of the three curves is of the current time frame, making it easier to understand the chart. I also prefer using the normal RSI and MACD with it…

MTF/RSIMTF/ RSI tells you 3 TF with cross signals , you would want all 3 TF to be GREEN and a cross for a strong buy same thing for the opposite

