[RS]Market ProfileEXPERIMENTAL: this script is very crude and prone to errors..
Request for: FibTrader
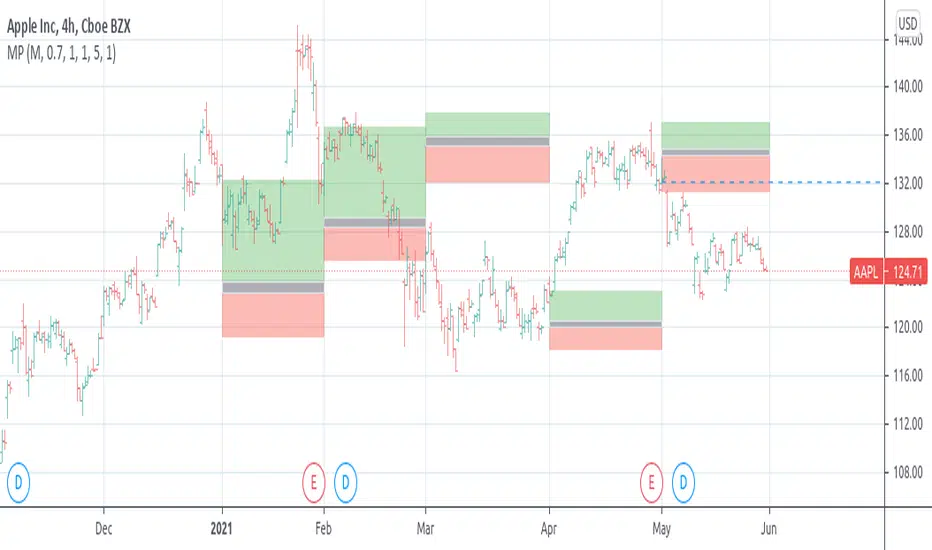
instead of a POC line theres a POC area instead, since the script is checking a price area range for the frequency, its possible to average the values but this works as well.
Поиск скриптов по запросу "poc"
AlgosPoint G&MPoint Breaking 2025 (MB&GB Breaking Point Pro)
What It Does:
A comprehensive TradingView indicator that combines multiple technical analysis tools to identify key market breakout points, support/resistance levels, and trading opportunities. It integrates Volume Profile analysis, AlphaTrend signals, and custom risk assessment metrics.
Key Features:
Volume Profile Analysis: Displays Point of Control (POC), Value Area High/Low (VAH/VAL), and volume distribution
Support & Resistance Detection: Automatically identifies key price levels based on volume or price action
AlphaTrend Signals: Generates BUY/SELL signals with visual labels on chart
Volume Spike Detection: Highlights unusual volume activity indicating potential exhaustion or breakout
High Volatility Alerts: Marks periods of increased market volatility using ATR
Risk Assessment Dashboard: Real-time panel showing:
Long/Short percentages (RSI-based)
Stop levels for both directions
Bot activity percentage
Csocy Signal status (Safe/Undecided/Risky)
How to Use:
Add to Chart: Apply indicator to any timeframe (works best on 15m-4H)
Configure Settings: Adjust parameters in grouped sections:
📊 General Settings (lookback periods)
🎯 Support & Resistance (line styles/colors)
💥 Volume Spike (threshold sensitivity)
⚡ High Volatility (ATR multiplier)
📈 Volume Profile (display options)
🔥 AlphaTrend (signal sensitivity)
Read Signals:
BUY label = Potential long entry when AlphaTrend crosses up
SELL label = Potential short entry when AlphaTrend crosses down
Dashboard colors: Green = bullish, Red = bearish, Yellow = neutral
Set Alerts: Built-in alerts for price crosses, volume spikes, and signal confirmations
Risk Management: Use displayed stop levels and Csocy Signal status to manage position sizing
Best For:
Day traders and swing traders
Crypto, Forex, and Stock markets
Identifying high-probability breakout zones
Volume-based trading strategies

X-Trend reversal (PRO) 👑 X-TREND REVERSAL (PRO): Institutional Order Flow Analysis
Look at the results above. This is not luck. This is mathematics. X-Trend PRO is the flagship algorithm of our ecosystem, engineered for traders who have outgrown standard technical analysis. While the Lite version identifies trends, the PRO version sees where the money is.
Unlike 99% of indicators that focus solely on price action, X-Trend PRO analyzes Market Liquidity and Volume Delta (CVD). We have fused market structure with an X-ray view of institutional activity.
💎 EXCLUSIVE PRO FEATURES:
📊 Volume & CVD Fusion: The indicator detects Cumulative Volume Delta divergences. It warns you of reversals when price is still rising, but buyers have already left the market.
📍 Dynamic POC (Point of Control): Automatically identifies "fair price" levels and institutional accumulation zones. You trade from levels defended by market makers.
🛡 Zero Repaint Guarantee: The signal is locked permanently upon bar close. The history you see is the actual real-time performance of the algorithm.
🧠 Smart Filtering: The system filters out "noise" in ranging markets, generating signals only when Trend, Momentum, and Volume align perfectly.
⚠️ IMPORTANT: SYSTEM SYNERGY
While X-Trend PRO is a powerful standalone tool, the author does not recommend using it in isolation. To achieve the "Sniper Efficiency" shown in the screenshots and to ensure deep market confluence, this tool is engineered to work ideally in synergy with the X-Trend Dashboard PRO. Combining these modules provides the ultimate confirmation system.
🔒 HOW TO GET ACCESS (INVITE-ONLY)
This script is a closed-source proprietary tool. Access is granted exclusively through our official channels.
⛔ NOTE: We do NOT respond to access requests in the comment section below. Please use the links above for instant support and license activation.

"VWAP Multi-Timeframe Pro - 6 VWAPs + Session Analysis"═════════════════════════════════════════════════════════════════════════════
VWAP MULTI-TIMEFRAME PRO - COMPLETE TUTORIAL
By Alphaomega18 (OA18)
═══════════════════════════════════════════════════════════════════════════════
📌 DESCRIPTION
VWAP Multi-Timeframe Pro is a professional trading tool that simultaneously
displays 6 different VWAPs with customizable sessions and dynamic standard
deviation bands. Ideal for day trading, swing trading, and institutional
order flow analysis.
═══════════════════════════════════════════════════════════════════════════════
🎯 KEY FEATURES
✅ 3 CUSTOMIZABLE SESSION VWAPS
• Asia Session: Configurable hours (default 0h-8h Paris time)
• London Session: Configurable hours (default 8h-16h Paris time)
• NY Session: Configurable hours (default 15h30-22h Paris time)
• Each session automatically stops at end time
• Customizable colors and thickness for each session
✅ 3 STANDARD TIMEFRAME VWAPS
• Daily VWAP (resets at midnight)
• Weekly VWAP (resets on Monday)
• Monthly VWAP (resets on 1st of month)
✅ ADVANCED STANDARD DEVIATION BANDS
• 3 levels of standard deviation (1σ, 2σ, 3σ)
• Timeframe selection for bands (Asia/London/NY/Daily/Weekly/Monthly)
• Colored zones for quick extreme identification
• Perfect for mean reversion trading
✅ DYNAMIC LABELS
• Real-time value display
• Labels visible only during active sessions
• Adjustable size (tiny/small/normal/large)
• Automatic positioning
✅ ALERT SYSTEM
• Price / Daily VWAP crossover
• Price reaching ±3σ bands
• Real-time notifications
═══════════════════════════════════════════════════════════════════════════════
📖 INSTALLATION GUIDE
STEP 1: Add the indicator
1. Open TradingView
2. Click on "Indicators" at the top of the chart
3. Search for "VWAP Multi-Timeframe Pro" or "Alphaomega18"
4. Click to add the indicator to your chart
STEP 2: Basic configuration
1. Click on the ⚙️ (settings) icon of the indicator
2. You will see 8 parameter groups
3. Start by enabling/disabling the VWAPs you want
═══════════════════════════════════════════════════════════════════════════════
⚙️ DETAILED CONFIGURATION
┌─────────────────────────────────────────────────────────────────────────────┐
│ GROUP 1: VWAP ASIA SESSION │
├─────────────────────────────────────────────────────────────────────────────┤
│ • Show VWAP Asia: YES/NO │
│ • Start Hour: 0 (24h format, 0-23) │
│ • Start Minute: 0 (minutes, 0-59) │
│ • End Hour: 8 │
│ • End Minute: 0 │
│ • Color: Yellow (customizable) │
│ • Line Width: 2 (1-5) │
│ │
│ 💡 EXAMPLE: For Tokyo 1h-9h Paris → Start: 1h00, End: 9h00 │
└─────────────────────────────────────────────────────────────────────────────┘
┌─────────────────────────────────────────────────────────────────────────────┐
│ GROUP 2: VWAP LONDON SESSION │
├─────────────────────────────────────────────────────────────────────────────┤
│ • Show VWAP London: YES/NO │
│ • Start Hour: 8 │
│ • Start Minute: 0 │
│ • End Hour: 16 │
│ • End Minute: 0 │
│ • Color: Aqua (customizable) │
│ • Line Width: 2 (1-5) │
│ │
│ 💡 EXAMPLE: For LSE 9h-17h30 Paris → Start: 9h00, End: 17h30 │
└─────────────────────────────────────────────────────────────────────────────┘
┌─────────────────────────────────────────────────────────────────────────────┐
│ GROUP 3: VWAP NY SESSION │
├─────────────────────────────────────────────────────────────────────────────┤
│ • Show VWAP NY: YES/NO │
│ • Start Hour: 15 │
│ • Start Minute: 30 │
│ • End Hour: 22 │
│ • End Minute: 0 │
│ • Color: Orange (customizable) │
│ • Line Width: 2 (1-5) │
│ │
│ 💡 NOTE: US RTH = 9h30-16h00 ET = 15h30-22h00 Paris time │
└─────────────────────────────────────────────────────────────────────────────┘
┌─────────────────────────────────────────────────────────────────────────────┐
│ GROUPS 4-6: VWAP DAILY, WEEKLY, MONTHLY │
├─────────────────────────────────────────────────────────────────────────────┤
│ Each group has the same options: │
│ • Show VWAP: YES/NO │
│ • Color: Customizable │
│ • Line Width: 1-5 │
└─────────────────────────────────────────────────────────────────────────────┘
┌─────────────────────────────────────────────────────────────────────────────┐
│ GROUP 7: STANDARD DEVIATION BANDS │
├─────────────────────────────────────────────────────────────────────────────┤
│ • Show Bands: YES/NO │
│ • Bands Timeframe: Asia/London/NY/Daily/Weekly/Monthly │
│ • Standard Deviation 1: 1.0 (recommended) │
│ • Standard Deviation 2: 2.0 (recommended) │
│ • Standard Deviation 3: 3.0 (recommended) │
│ • Upper Band Color: Green (customizable) │
│ • Lower Band Color: Red (customizable) │
│ │
│ 💡 Bands are calculated on the selected VWAP │
└─────────────────────────────────────────────────────────────────────────────┘
┌─────────────────────────────────────────────────────────────────────────────┐
│ GROUP 8: DISPLAY │
├─────────────────────────────────────────────────────────────────────────────┤
│ • Show Labels: YES/NO │
│ • Label Size: tiny/small/normal/large │
└─────────────────────────────────────────────────────────────────────────────┘
═══════════════════════════════════════════════════════════════════════════════
🎨 PRESET CONFIGURATIONS
┏━━━━━━━━━━━━━━━━━━━━━━━━━━━━━━━━━━━━━━━━━━━━━━━━━━━━━━━━━━━━━━━━━━━━━━━━━┓
┃ CONFIGURATION 1: SCALPING / INTRADAY DAY TRADING ┃
┣━━━━━━━━━━━━━━━━━━━━━━━━━━━━━━━━━━━━━━━━━━━━━━━━━━━━━━━━━━━━━━━━━━━━━━━━━┫
┃ Chart timeframe: 1min - 5min ┃
┃ ┃
┃ Active VWAPs: ┃
┃ ☑ VWAP Asia : YES (to see overnight range) ┃
┃ ☑ VWAP London : YES (if trading EU session) ┃
┃ ☑ VWAP NY : YES (main US session) ┃
┃ ☑ VWAP Daily : YES (daily reference) ┃
┃ ☐ VWAP Weekly : NO ┃
┃ ☐ VWAP Monthly : NO ┃
┃ ┃
┃ Bands: ┃
┃ Timeframe: NY (if trading US session) ┃
┃ Levels: 1σ, 2σ, 3σ ┃
┃ ┃
┃ Labels: YES, size SMALL ┃
┗━━━━━━━━━━━━━━━━━━━━━━━━━━━━━━━━━━━━━━━━━━━━━━━━━━━━━━━━━━━━━━━━━━━━━━━━━┛
┏━━━━━━━━━━━━━━━━━━━━━━━━━━━━━━━━━━━━━━━━━━━━━━━━━━━━━━━━━━━━━━━━━━━━━━━━━┓
┃ CONFIGURATION 2: STANDARD DAY TRADING ┃
┣━━━━━━━━━━━━━━━━━━━━━━━━━━━━━━━━━━━━━━━━━━━━━━━━━━━━━━━━━━━━━━━━━━━━━━━━━┫
┃ Chart timeframe: 5min - 15min ┃
┃ ┃
┃ Active VWAPs: ┃
┃ ☐ VWAP Asia : NO ┃
┃ ☐ VWAP London : NO ┃
┃ ☑ VWAP NY : YES ┃
┃ ☑ VWAP Daily : YES ┃
┃ ☐ VWAP Weekly : NO ┃
┃ ☐ VWAP Monthly : NO ┃
┃ ┃
┃ Bands: ┃
┃ Timeframe: Daily ┃
┃ Levels: 1σ, 2σ, 3σ ┃
┃ ┃
┃ Labels: YES, size SMALL ┃
┗━━━━━━━━━━━━━━━━━━━━━━━━━━━━━━━━━━━━━━━━━━━━━━━━━━━━━━━━━━━━━━━━━━━━━━━━━┛
┏━━━━━━━━━━━━━━━━━━━━━━━━━━━━━━━━━━━━━━━━━━━━━━━━━━━━━━━━━━━━━━━━━━━━━━━━━┓
┃ CONFIGURATION 3: SWING TRADING ┃
┣━━━━━━━━━━━━━━━━━━━━━━━━━━━━━━━━━━━━━━━━━━━━━━━━━━━━━━━━━━━━━━━━━━━━━━━━━┫
┃ Chart timeframe: 1H - 4H ┃
┃ ┃
┃ Active VWAPs: ┃
┃ ☐ VWAP Asia : NO ┃
┃ ☐ VWAP London : NO ┃
┃ ☐ VWAP NY : NO ┃
┃ ☑ VWAP Daily : YES ┃
┃ ☑ VWAP Weekly : YES ┃
┃ ☐ VWAP Monthly : NO ┃
┃ ┃
┃ Bands: ┃
┃ Timeframe: Weekly ┃
┃ Levels: 1σ, 2σ, 3σ ┃
┃ ┃
┃ Labels: YES, size NORMAL ┃
┗━━━━━━━━━━━━━━━━━━━━━━━━━━━━━━━━━━━━━━━━━━━━━━━━━━━━━━━━━━━━━━━━━━━━━━━━━┛
┏━━━━━━━━━━━━━━━━━━━━━━━━━━━━━━━━━━━━━━━━━━━━━━━━━━━━━━━━━━━━━━━━━━━━━━━━━┓
┃ CONFIGURATION 4: MULTI-SESSION TRADING (FOREX, 24H FUTURES) ┃
┣━━━━━━━━━━━━━━━━━━━━━━━━━━━━━━━━━━━━━━━━━━━━━━━━━━━━━━━━━━━━━━━━━━━━━━━━━┫
┃ Chart timeframe: 15min - 1H ┃
┃ ┃
┃ Active VWAPs: ┃
┃ ☑ VWAP Asia : YES ┃
┃ ☑ VWAP London : YES ┃
┃ ☑ VWAP NY : YES ┃
┃ ☑ VWAP Daily : YES ┃
┃ ☐ VWAP Weekly : NO ┃
┃ ☐ VWAP Monthly : NO ┃
┃ ┃
┃ Bands: ┃
┃ Timeframe: Daily ┃
┃ Levels: 1σ, 2σ, 3σ ┃
┃ ┃
┃ Labels: YES, size SMALL ┃
┗━━━━━━━━━━━━━━━━━━━━━━━━━━━━━━━━━━━━━━━━━━━━━━━━━━━━━━━━━━━━━━━━━━━━━━━━━┛
═══════════════════════════════════════════════════════════════════════════════
📊 SIGNAL INTERPRETATION
┌─────────────────────────────────────────────────────────────────────────────┐
│ PRICE POSITION RELATIVE TO VWAP │
├─────────────────────────────────────────────────────────────────────────────┤
│ Price > VWAP → BULLISH TREND (bulls in control) │
│ Price < VWAP → BEARISH TREND (bears in control) │
│ Price = VWAP → EQUILIBRIUM ZONE (indecision) │
│ Price oscillates → RANGE / CONSOLIDATION │
└─────────────────────────────────────────────────────────────────────────────┘
┌─────────────────────────────────────────────────────────────────────────────┐
│ STANDARD DEVIATION BANDS SIGNALS │
├─────────────────────────────────────────────────────────────────────────────┤
│ Price at +1σ → Normal bullish extension │
│ Price at +2σ → OVERBOUGHT - possible reversal │
│ Price at +3σ → EXTREME OVERBOUGHT - high probability return to VWAP │
│ │
│ Price at -1σ → Normal bearish extension │
│ Price at -2σ → OVERSOLD - possible reversal │
│ Price at -3σ → EXTREME OVERSOLD - high probability return to VWAP │
└─────────────────────────────────────────────────────────────────────────────┘
┌─────────────────────────────────────────────────────────────────────────────┐
│ VWAP CONFLUENCE (POWERFUL SIGNALS) │
├─────────────────────────────────────────────────────────────────────────────┤
│ 3+ VWAPs aligned → VERY STRONG TREND │
│ VWAPs converging → MAJOR SUPPORT/RESISTANCE ZONE │
│ VWAPs diverging → CONSOLIDATION ZONE │
│ Price between 2 → CRITICAL DECISION ZONE │
└─────────────────────────────────────────────────────────────────────────────┘
═══════════════════════════════════════════════════════════════════════════════
💡 TRADING STRATEGIES
╔═════════════════════════════════════════════════════════════════════════════╗
║ STRATEGY 1: MEAN REVERSION ║
╠═════════════════════════════════════════════════════════════════════════════╣
║ TIMEFRAME: 5min - 15min ║
║ VWAP USED: Daily or NY Session ║
║ ║
║ LONG ENTRY RULES: ║
║ 1. Price touches -2σ or -3σ band ║
║ 2. Wait for rejection candle (hammer, pin bar) ║
║ 3. Volume above average ║
║ 4. Enter LONG above rejection candle high ║
║ ║
║ SHORT ENTRY RULES: ║
║ 1. Price touches +2σ or +3σ band ║
║ 2. Wait for rejection candle (shooting star, pin bar) ║
║ 3. Volume above average ║
║ 4. Enter SHORT below rejection candle low ║
║ ║
║ MANAGEMENT: ║
║ • Stop Loss: Beyond ±3σ band ║
║ • Take Profit: Return to VWAP (TP1), opposite VWAP (TP2) ║
║ • Risk/Reward: Minimum 1:2 ║
╚═════════════════════════════════════════════════════════════════════════════╝
╔═════════════════════════════════════════════════════════════════════════════╗
║ STRATEGY 2: TREND FOLLOWING ║
╠═════════════════════════════════════════════════════════════════════════════╣
║ TIMEFRAME: 15min - 1H ║
║ VWAP USED: Daily + Weekly ║
║ ║
║ LONG ENTRY RULES: ║
║ 1. Price > Daily VWAP AND > Weekly VWAP (confirmed trend) ║
║ 2. Wait for pullback to Daily VWAP ║
║ 3. Price rejects VWAP upward (doesn't break) ║
║ 4. Enter LONG on rejection ║
║ ║
║ SHORT ENTRY RULES: ║
║ 1. Price < Daily VWAP AND < Weekly VWAP (confirmed trend) ║
║ 2. Wait for pullback to Daily VWAP ║
║ 3. Price rejects VWAP downward (doesn't break) ║
║ 4. Enter SHORT on rejection ║
║ ║
║ MANAGEMENT: ║
║ • Stop Loss: Below/above Daily VWAP ║
║ • Take Profit: +1σ/+2σ bands or key support/resistance ║
║ • Trailing Stop: Use VWAP as dynamic trailing ║
╚═════════════════════════════════════════════════════════════════════════════╝
╔═════════════════════════════════════════════════════════════════════════════╗
║ STRATEGY 3: BREAKOUT CONFIRMATION ║
╠═════════════════════════════════════════════════════════════════════════════╣
║ TIMEFRAME: 5min - 30min ║
║ VWAP USED: NY Session + Daily ║
║ ║
║ LONG ENTRY RULES: ║
║ 1. Price consolidates around VWAP (range) ║
║ 2. Breakout above VWAP with HIGH VOLUME ║
║ 3. Simultaneous break of NY VWAP AND Daily VWAP ║
║ 4. Pullback test of VWAP (now support) ║
║ 5. Enter LONG on pullback rejection ║
║ ║
║ SHORT ENTRY RULES: ║
║ 1. Price consolidates around VWAP (range) ║
║ 2. Breakout below VWAP with HIGH VOLUME ║
║ 3. Simultaneous break of NY VWAP AND Daily VWAP ║
║ 4. Pullback test of VWAP (now resistance) ║
║ 5. Enter SHORT on pullback rejection ║
║ ║
║ MANAGEMENT: ║
║ • Stop Loss: Return to other side of VWAP ║
║ • Take Profit: ±2σ bands or measured move from range ║
║ • Failed breakout: Exit immediately if back in range ║
╚═════════════════════════════════════════════════════════════════════════════╝
╔═════════════════════════════════════════════════════════════════════════════╗
║ STRATEGY 4: SESSION HANDOFF ║
╠═════════════════════════════════════════════════════════════════════════════╣
║ TIMEFRAME: 5min - 15min ║
║ VWAP USED: Asia + London + NY ║
║ ║
║ CONCEPT: ║
║ Observe how each session respects or breaks the previous session's VWAP. ║
║ A break indicates sentiment change. ║
║ ║
║ LONG EXAMPLE: ║
║ 1. Asia Session: Price ranges around Asia VWAP ║
║ 2. London Open (8h): Price breaks Asia VWAP upward ║
║ 3. London VWAP forms above Asia VWAP ║
║ 4. NY Open (15h30): Price respects London VWAP (doesn't break) ║
║ 5. BULLISH SIGNAL: All 3 sessions aligned bullish ║
║ 6. Enter LONG on pullback to NY VWAP ║
║ ║
║ MANAGEMENT: ║
║ • Stop: Below current session VWAP ║
║ • Target: +2σ band or previous session high ║
║ • Invalid if: Price breaks below all session VWAPs ║
╚═════════════════════════════════════════════════════════════════════════════╝
═══════════════════════════════════════════════════════════════════════════════
🔔 ALERT CONFIGURATION
STEP 1: Create an alert
1. Click on "Alerts" button (alarm icon) top right
2. Click "Create alert"
3. In "Condition", select "VWAP Multi-Timeframe Pro"
STEP 2: Choose alert type
• Price > Daily VWAP: Alert when price crosses Daily VWAP upward
• Price < Daily VWAP: Alert when price crosses Daily VWAP downward
• Price at +3σ: Alert when price reaches extreme upper band
• Price at -3σ: Alert when price reaches extreme lower band
STEP 3: Configure alert
• Frequency: "Once per bar close" (recommended)
• Expiration: Set according to your needs
• Actions: Popup + Email + Mobile notification
RECOMMENDED ALERTS FOR DAY TRADING:
✓ Price crosses Daily VWAP (up and down)
✓ Price at ±3σ on NY Session VWAP
✓ Combine with other indicators for confirmation
═══════════════════════════════════════════════════════════════════════════════
💼 SPECIFIC USE CASES
┏━━━━━━━━━━━━━━━━━━━━━━━━━━━━━━━━━━━━━━━━━━━━━━━━━━━━━━━━━━━━━━━━━━━━━━━━━┓
┃ TRADING MNQ (E-MINI NASDAQ 100) ┃
┣━━━━━━━━━━━━━━━━━━━━━━━━━━━━━━━━━━━━━━━━━━━━━━━━━━━━━━━━━━━━━━━━━━━━━━━━━┫
┃ Optimal configuration: ┃
┃ • Timeframe: 5min ┃
┃ • VWAP Asia: 0h-8h (see overnight range) ┃
┃ • VWAP NY: 15h30-22h (RTH session) ┃
┃ • VWAP Daily: Active ┃
┃ • Bands: NY Session, 1σ/2σ/3σ ┃
┃ ┃
┃ Strategy: ┃
┃ 1. At 15h30: Observe if price respects or breaks Asia VWAP ┃
┃ 2. Enter in NY VWAP direction if confluence with Daily ┃
┃ 3. Use ±2σ bands for targets ┃
┃ 4. Stop below/above NY VWAP ┃
┗━━━━━━━━━━━━━━━━━━━━━━━━━━━━━━━━━━━━━━━━━━━━━━━━━━━━━━━━━━━━━━━━━━━━━━━━━┛
┏━━━━━━━━━━━━━━━━━━━━━━━━━━━━━━━━━━━━━━━━━━━━━━━━━━━━━━━━━━━━━━━━━━━━━━━━━┓
┃ TRADING FOREX EUR/USD ┃
┣━━━━━━━━━━━━━━━━━━━━━━━━━━━━━━━━━━━━━━━━━━━━━━━━━━━━━━━━━━━━━━━━━━━━━━━━━┫
┃ Optimal configuration: ┃
┃ • Timeframe: 15min ┃
┃ • VWAP Asia: 0h-8h ┃
┃ • VWAP London: 8h-16h (most liquid EUR/USD session) ┃
┃ • VWAP NY: 14h-22h (US overlap) ┃
┃ • Bands: London Session ┃
┃ ┃
┃ Strategy: ┃
┃ 1. London Session (8h): Trade in Asia breakout direction ┃
┃ 2. NY Session (14h): Observe London/NY VWAP confluence ┃
┃ 3. Exit before 22h (end of liquidity) ┃
┗━━━━━━━━━━━━━━━━━━━━━━━━━━━━━━━━━━━━━━━━━━━━━━━━━━━━━━━━━━━━━━━━━━━━━━━━━┛
┏━━━━━━━━━━━━━━━━━━━━━━━━━━━━━━━━━━━━━━━━━━━━━━━━━━━━━━━━━━━━━━━━━━━━━━━━━┓
┃ TRADING US STOCKS (AAPL, TSLA, etc.) ┃
┣━━━━━━━━━━━━━━━━━━━━━━━━━━━━━━━━━━━━━━━━━━━━━━━━━━━━━━━━━━━━━━━━━━━━━━━━━┫
┃ Optimal configuration: ┃
┃ • Timeframe: 5min or 15min ┃
┃ • VWAP NY: 15h30-22h (RTH only) ┃
┃ • VWAP Daily: Active ┃
┃ • VWAP Weekly: Active (for swing) ┃
┃ • Bands: Daily ┃
┃ ┃
┃ Strategy: ┃
┃ 1. Pre-market: Analyze sentiment vs Daily VWAP ┃
┃ 2. Open (15h30): Confirm direction with NY VWAP ┃
┃ 3. Institutional orders visible at Daily/Weekly VWAP confluence ┃
┗━━━━━━━━━━━━━━━━━━━━━━━━━━━━━━━━━━━━━━━━━━━━━━━━━━━━━━━━━━━━━━━━━━━━━━━━━┛
═══════════════════════════════════════════════════════════════════════════════
⚠️ COMMON MISTAKES TO AVOID
❌ MISTAKE 1: Trading against all VWAPs
→ If price < Daily, Weekly, Monthly VWAP → DON'T buy
→ Wait for confluence or trend change
❌ MISTAKE 2: Ignoring sessions
→ NY VWAP at 8am has NO validity
→ Respect session start/end times
❌ MISTAKE 3: Over-trading VWAP touches
→ Every VWAP touch is NOT a signal
→ Wait for confluence + volume + pattern
❌ MISTAKE 4: Wrong time configuration
→ Check your timezone
→ Adjust hours according to your location
❌ MISTAKE 5: Neglecting volume
→ VWAP crossover without volume is WEAK
→ Volume > average = more reliable signal
❌ MISTAKE 6: Forgetting HTF context
→ Always check higher timeframe
→ Daily chart for intraday, Weekly for swing
❌ MISTAKE 7: Too tight stop loss
→ Place stop BEYOND ±3σ band
→ Give position room to breathe
❌ MISTAKE 8: Using only VWAP
→ COMBINE with: RSI, Volume Profile, Support/Resistance
→ VWAP is a tool, not a complete strategy
═══════════════════════════════════════════════════════════════════════════════
📈 OPTIMIZATION & BACKTESTING
TIPS TO IMPROVE YOUR RESULTS:
1. JOURNAL YOUR TRADES
• Note which VWAP configuration worked
• Which session gives best results
• Which band level (1σ/2σ/3σ) is optimal
2. TEST DIFFERENT PERIODS
• Modify session hours according to your asset
• Crypto: Different 24h sessions
• EU Stocks: Adapt to XETRA/CAC hours
3. ADAPT BANDS
• Volatile assets: Use 1.5σ, 2.5σ, 3.5σ
• Calm assets: Keep standard 1σ, 2σ, 3σ
4. COMBINE WITH OTHER TOOLS
• Volume Profile (POC, VAH, VAL)
• Market Delta / Order Flow
• Horizontal Support/Resistance
• Fibonacci retracements
═══════════════════════════════════════════════════════════════════════════════
🆘 SUPPORT & FAQ
Q: Are times in local time or UTC?
A: Times are in your TradingView chart's timezone.
For Paris, use French local time.
Q: Can I use more than 3 sessions?
A: This version offers 3 customizable sessions. For more, duplicate
the indicator with different configurations.
Q: Does VWAP reset automatically?
A: Yes! Each VWAP resets automatically:
• Sessions: At defined start time
• Daily: At midnight
• Weekly: On Monday
• Monthly: On 1st of month
Q: Why isn't my session VWAP displaying?
A: Check:
1. Session is enabled in settings
2. You are WITHIN session time
3. Hours are correctly configured
Q: Can I export my configurations?
A: Yes, TradingView allows saving indicator templates.
Q: Compatible with free TradingView?
A: Yes, indicator works on all TradingView plans.
═══════════════════════════════════════════════════════════════════════════════
Version 1.0 | © 2025 Alphaomega18
Indicator developed for professional and passionate traders
═══════════════════════════════════════════════════════════════════════════════

KIMATIX FVG/IFVG/BPRProfessional Fair Value Gap & Imbalance Toolkit
The KIMATIX FVG/IFVG/BPR indicator is a precision tool designed to identify institutional inefficiencies in price:
Fair Value Gaps (FVG), Inverse Fair Value Gaps (IFVG) and Balanced Price Ranges (BPR) — clean, minimal and non-repainting.
This indicator is built for scalpers, intraday traders and smart-money traders who want to trade where price is most likely to react, not where indicators lag.
What this indicator shows
Fair Value Gaps (FVG)
Detects bullish and bearish FVGs using strict 3-candle imbalance logic
Highlights areas where price moved too fast, leaving inefficient structure
Ideal for:
Continuation trades
Pullback entries
Reaction zones after impulse moves
Color-coded
🟢 Bullish FVG
🔴 Bearish FVG
Inverse Fair Value Gaps (IFVG)
Automatically detects when an FVG is invalidated
Marks the same zone as an Inverse FVG
Extremely useful for:
Failed structure setups
Reversal trades
Stop-hunt & liquidity traps
Color-coded
🟡 IFVG (invalidation zone)
Balanced Price Range (BPR)
Detects overlapping bullish & bearish FVGs
Highlights price areas where buying and selling pressure are balanced
These zones often act as:
High-probability reaction areas
Compression zones before expansion
Premium intraday decision levels
Color-coded
🔵 BPR (balanced price range)
Smart, Clean & Non-Repainting
Non-repainting
Only the last 3 active zones are shown → no clutter
Boxes extend forward with a manual cap (user-controlled)
Designed for 1m – 15m execution, works on all markets
Futures, Crypto, FX, Indices, Stocks
How professionals use it
Combine FVGs with:
VWAP
Session highs/lows
Volume Profile (POC / VAH / VAL)
Market structure (BOS / displacement)
Use IFVGs to spot failed smart-money narratives
Use BPRs as decision zones, not blind entries
This indicator does not give buy/sell signals.
It shows you where trades make sense — execution is up to you.
Best use cases
Scalping (1m–3m)
Intraday trading (5m–15m)
Smart-money concepts
Liquidity-based trading
News reactions & stop runs
Learn how to trade it properly
This indicator is part of the KIMATIX Trading Framework.
More education, live examples & full system:
kimatixtrading.com

ORB + FVG A+ PRO (All-in-One) [QQQ]Configurable ORB + FVG + filters (VIX, ORB range, relative volume) + A+ PRO (retest at the FVG edge + rejection) + anti-fakeout + orange reminder “CONFIRM POC/HVN (Volume Profile)” right when the A+ signal appears

VCAI Volume & Liquidity Map LiteVCAI Volume & Liquidity Map Lite visualises recent market participation using a horizontal liquidity/volume histogram plotted beside current price.
It shows where trading activity has clustered, where the chart is thin, and how much of that activity came from buying vs selling pressure.
This Lite edition keeps the tool simple and fast:
Yellow = buy-side volume (aggressive buyers / upward pressure)
Purple = sell-side volume (aggressive sellers / downward pressure)
Thicker sections = higher traded volume at that price
POC line (purple) marks the price with the highest volume concentration
Value Area lines (yellow dashed) mark where ~70% of volume has traded
Bars extend outward to the right of price for a clean, unobstructed chart
Lookback setting controls how many candles the map is built from
Use it to quickly identify:
high-interest price zones
low-liquidity areas where price can move fast
likely reaction levels
where momentum may slow, reverse, or break through
Designed as a lightweight, open-source tool for anyone wanting a clean liquidity/volume map without complex settings.
Part of the VCAI Lite Series.

Candle POC [DemaK]Indicador de puntos de control de las velas
(No es tan preciso como en las plataformas, tenemos que entender que tradingview no toma la data por tick, pero puede servir de forma orientativa)
**"Candle Point of Control Indicator
(It’s not as precise as in dedicated platforms, since TradingView does not process true tick-by-tick data, but it can still be useful as a general reference.)"**

Composite Market Momentum Index (CMM)***The Composite Market Momentum Index (CMMI), developed by Alcides Davila, a Miami-based Business Consultant, functions as a specialized momentum oscillator within sophisticated technical frameworks such as the Composite Predictive Index (CPI-IGv5)***. Davila's background in volatile sectors informs CMMI's design, emphasizing resilient, multi-layered analysis to navigate market uncertainties. At its essence, CMMI synthesizes momentum from RSI and momentum indicators, serving as a key input to CPI-(IGv5's)*** probability engine for directional forecasts.
The primary purpose of CMMI is to assess market strength and potential shifts, helping traders identify high-probability opportunities while mitigating risks from isolated metrics. Integrated into CPI-IGv5, it bolsters the "probUp" metric—a probabilistic estimate of upward price action—by fusing complementary factors, yielding a claimed 68-80% trend-prediction accuracy in backtests. Productivity is moderate to high under trending conditions, where multi-indicator redundancy reduces false positives. Still, it may underperform in ranging or highly volatile markets, necessitating user-led backtesting to assess real-world efficacy.
Mathematically, CMMI originates from a 9-period momentum applied to a 14-period RSI, enhanced by a 3-period smoothed short RSI to create the base composite. It undergoes Z-score standardization over a 50-bar window for normalization, followed by a linear weighted sum with other elements (e.g., 0.10 allocation to momentum). Logical enhancements include using the hyperbolic tangent (tanh) for value bounding and cumulative distribution function (CDF) or logistic mappings to derive probabilities, ensuring outputs are statistically rigorous. Threshold logic governs signals: overbought alerts trigger on crossovers above 75 (normalized scale), oversold below 25, with strict pro filters at 0.55 (buy) and 0.45 (sell) on a 0-1 basis, often requiring confirmations from EMA slopes, POC crossovers, or volume deltas. This gated approach adds precision by filtering signals through base, strong, and ultra categories based on probUp thresholds, such as>0.68 for medium-term entries.
Versatility is evident in CMMI's multitimeframe adaptability, supporting modes from scalping (1-minute resolution, short multipliers) to long-term (daily, extended lookbacks up to 500 bars), dynamically adjusting via secure data requests to incorporate live and historical momentum. It accommodates diverse assets, including commodities—Davila's focus—equities, and forex, with customizable weights and manual inputs ( scale) for external variables like news impact (elevated to 0.20 for emphasis) or industry segments (0.05), allowing fine-tuning for macroeconomic or sector-specific contexts. Efficiency is achieved through real-time rolling sums, Z-windows, and resource optimizations (e.g., max 500 bars/lines/labels), minimizing computational overhead while enabling cooldowns to mitigate alert fatigue in high-frequency setups.
For enhanced application, pair with confirmatory indicators such as MACD ratios or VWAP, and use strategy modes to backtest signal viability across horizons. Target investors include day traders and scalpers seeking quick, data-driven entries, institutions focused on commodity analysis, and technically adept retail users, all of whom benefit from its probabilistic framework over rigid rules. While versatile, CMMI's closed-source aspects in Pine Script limit full transparency, underscoring the need for empirical testing.

LVN Smart Liquidity📊 LVN SMART LIQUIDITY
═════════════════════════════════════════════════════════════
─────────────────────────────────────────────────────────────
🎯 OVERVIEW
LVN Smart Liquidity is an advanced Market Profile-based indicator that automatically identifies Low Volume Nodes (LVN) across multiple timeframes. Unlike traditional volume-based indicators, this tool uses TPO (Time Price Opportunity) calculations to detect price levels where minimal trading activity occurred, revealing potential breakout zones and rapid price movement areas.
These LVN zones often behave similarly to Fair Value Gaps (FVG) in Smart Money Concepts, representing "thin air" areas where price tends to move quickly with minimal resistance. The indicator provides dynamic zone management with an immunity period system to prevent premature zone closure.
─────────────────────────────────────────────────────────────
🔬 HOW IT WORKS
MARKET PROFILE TPO METHODOLOGY:
The indicator analyzes each higher timeframe period by:
1. Dividing the price range into 20 equal levels
2. Counting how many bars touched each level (TPO count)
3. Identifying levels with TPO counts below the threshold (default 30% of maximum)
4. Creating horizontal zones that extend until price touches them
MULTI-TIMEFRAME ANALYSIS:
• Supports up to 5 independent timeframes simultaneously
• Each timeframe generates its own LVN zones with unique colors
• Auto-timeframe mode adapts to your chart period
• Zones project from historical sessions onto current price action
SMART ZONE MANAGEMENT:
• Immunity Period: New zones are protected for N bars after creation (default 20)
• This prevents zones from disappearing immediately when price is already within them
• Zones extend right until price touches them, then stop extending
• Historical zones remain visible for reference (optional)
─────────────────────────────────────────────────────────────
💡 WHY LVN ZONES MATTER
Low Volume Nodes represent price levels where:
✓ Price spent minimal time (rejection zones)
✓ Few market participants were active
✓ Inefficient price discovery occurred
✓ Similar to Fair Value Gaps in ICT/SMC methodology
TRADING APPLICATIONS:
• Breakout Acceleration: Price moves rapidly through LVN zones
• Profit Targets: Place targets beyond LVN zones where momentum slows
• Stop Loss Placement: Avoid placing stops inside LVN zones (price likely to continue)
• Confluence with FVG: LVN zones often align with Fair Value Gaps
• Retest Opportunities: When price revisits LVN, expect quick moves
─────────────────────────────────────────────────────────────
⚙️ KEY FEATURES
TIMEFRAME FLEXIBILITY:
• 5 independent timeframe slots with enable/disable toggles
• Auto-mode intelligently selects higher timeframes
• Preset options: 5m, 15m, 30m, 1H, 2H, 4H, D, W, 2W, M, 3M, 6M, 12M
VISUAL CUSTOMIZATION:
• Individual color settings for each timeframe
• Adjustable box transparency and border width
• Toggle timeframe labels and period dates on/off
• Four text size options: tiny, small, normal, large
ADVANCED CONTROLS:
• LVN Threshold: 0-50% (default 30%) - lower = fewer, stronger zones
• Immunity Period: 0-50 bars (default 20) - prevents premature closure
• Show/Hide old boxes for clean chart appearance
• Maximum 500 boxes supported per timeframe
PROFESSIONAL DISPLAY:
• Zones show timeframe label (5m, 1H, D, etc.)
• Optional period dates (dd.MM-dd.MM format)
• Boxes extend right dynamically until price touch
• Clean visual hierarchy with bordered zones
─────────────────────────────────────────────────────────────
📈 HOW TO USE
SETUP:
1. Add indicator to chart
2. Enable desired timeframes (TF1, TF2, etc.)
3. Adjust LVN threshold based on your trading style:
• 20-25% = Very selective (only thinnest zones)
• 30-35% = Balanced (recommended for most markets)
• 40-50% = More zones (higher sensitivity)
INTERPRETATION:
• RED/DARK ZONES = Low trading activity occurred here
• Price tends to move THROUGH these zones quickly
• Similar behavior to Fair Value Gaps (FVG) in Smart Money theory
• Expect acceleration when price enters LVN zones
TRADING STRATEGIES:
1. BREAKOUT TRADING:
- Wait for price to approach LVN zone
- Enter when price breaks into the zone
- Expect rapid movement through the zone
- Target next support/resistance beyond LVN
2. CONFLUENCE ANALYSIS:
- Combine with other SMC concepts (Order Blocks, FVG, Liquidity)
- LVN + FVG overlap = high-probability acceleration zone
- Use higher timeframe LVN as directional bias
3. MULTI-TIMEFRAME:
- Daily LVN = major breakout zones
- 4H LVN = intraday momentum areas
- 15m LVN = scalping opportunities
─────────────────────────────────────────────────────────────
⚠️ IMPORTANT NOTES
WHAT THIS INDICATOR IS:
✓ Market Profile TPO-based LVN detector
✓ Multi-timeframe zone identification tool
✓ Visual representation of low trading activity areas
✓ Complementary to Smart Money Concepts (SMC/ICT)
WHAT THIS INDICATOR IS NOT:
✗ Not a standalone trading system
✗ Not a guaranteed profit generator
✗ Not financial advice
✗ Requires confirmation from price action and other tools
LIMITATIONS:
• Works best on liquid markets with reliable data
• Lower timeframes may produce excessive zones
• Requires understanding of Market Profile concepts
• Performance depends on proper threshold calibration
BEST PRACTICES:
• Start with 1-2 timeframes, add more as needed
• Use higher timeframes for swing trading
• Combine with support/resistance, trendlines, order blocks
• Backtest on your specific instrument before live trading
• Adjust immunity period based on market volatility
─────────────────────────────────────────────────────────────
🔧 SETTINGS GUIDE
TIMEFRAME GROUPS (1-5):
Each group contains:
• Enable toggle - Turn timeframe on/off
• Timeframe selector - Choose period or Auto
• Box color - Zone fill color
• Border color - Zone outline color
GENERAL SETTINGS:
• LVN Threshold (%) - Percentage of max TPO to qualify as LVN
• Show Old LVN Boxes - Keep historical zones visible
• Box Border Width - Visual thickness (1-4)
• Immunity Period - Protection bars for new zones
• Show Timeframe - Display TF label in boxes
• Show Period - Display date range in boxes
• Text Size - Label size adjustment
─────────────────────────────────────────────────────────────
📊 ORIGINALITY & UNIQUENESS
This indicator is original because:
1. TPO-BASED CALCULATION: Uses Market Profile Time-Price-Opportunity methodology instead of traditional volume analysis, making it work on all markets including those without real volume data (Forex, some indices).
2. IMMUNITY SYSTEM: Unique protection mechanism prevents zones from disappearing immediately when price is already within zone boundaries at creation time.
3. TRUE MULTI-TIMEFRAME: Independent calculation for each timeframe with separate zone management, not simple higher timeframe projection.
4. SMART ZONE LIFECYCLE: Zones dynamically extend until price touch, then become static historical references.
5. FVG-LIKE BEHAVIOR: Bridges traditional Market Profile analysis with modern Smart Money Concepts by identifying zones that behave similarly to Fair Value Gaps.
Unlike existing LVN indicators that rely on volume data, this tool uses time-based analysis, making it universal across all market types and compatible with brokers that don't provide accurate volume information.
─────────────────────────────────────────────────────────────
📚 TECHNICAL BACKGROUND
MARKET PROFILE THEORY:
Developed by J. Peter Steidlmayer in the 1980s, Market Profile analyzes market behavior by examining price and time relationships. Low Volume Nodes in traditional profile represent areas where market participants showed minimal interest.
TPO (TIME PRICE OPPORTUNITY):
Instead of counting volume, TPO counts how many time periods (bars) touched each price level. This approach:
• Works on all markets regardless of volume data quality
• Reflects actual time-based market acceptance/rejection
• Reveals psychological price levels through time distribution
CONNECTION TO SMART MONEY CONCEPTS:
Fair Value Gaps (FVG) in ICT methodology represent similar inefficiencies:
• Areas where price moved too quickly
• Imbalances in buying/selling pressure
• Zones that price may revisit or accelerate through
• LVN zones often overlap with FVG locations
─────────────────────────────────────────────────────────────
🎓 RECOMMENDED RESOURCES
To maximize this indicator's effectiveness, study:
• Market Profile fundamentals (TPO, POC, Value Area)
• Smart Money Concepts (FVG, Order Blocks, Liquidity)
• Multi-timeframe analysis techniques
• Volume Profile comparison (understand the difference)
COMPANION INDICATOR:
Consider using "HVN Smart Liquidity" (opposite concept) to identify both high and low volume zones for complete Market Profile analysis.
─────────────────────────────────────────────────────────────
💬 SUPPORT & FEEDBACK
Questions or suggestions? Feel free to comment below or send a private message.
If you find this indicator useful, please boost and share with other traders!
⚠️ DISCLAIMER: This indicator is for educational purposes only. Trading involves risk. Always do your own research and use proper risk management.

AlphaNatt | FINAL REVELATION [Visual God]AlphaNatt | The Final Revelation
"Where Information Theory meets Market Geometery."
The AlphaNatt is a comprehensive market structure and volumetric analysis suite designed for the institutional-grade trader. It merges advanced quantitative concepts—specifically Shannon Entropy and Neural Pattern Filtering—with a "Holographic" visual interface that prioritizes clarity over clutter.
This is not just an indicator; it is a complete decision-support system that answers three critical questions:
Is the market chaotic or ordered? (Entropy Engine)
Where is the liquidity? (Volumetric Heatmap)
What is the true structure? (Fractal Geometry)
🌌 The Gen 100 Math Engine
At the core of this script lies a unique implementation of Information Theory.
1. Shannon Entropy (The Chaos Filter)
Most indicators fail because they try to predict "Noise". This script calculates the Entropy (in Bits) of the recent price action.
High Entropy: The market is in a "Random Walk" state. Visuals fade out, transparency increases, and signals are suppressed.
Low Entropy: The market is "Ordered" and approaching a singularity/decision point. Visuals glow brightly to indicate a high-probability environment.
2. Neural Pattern Recognition
The diamond signals (Cyan/Magenta) are not simple simple crossovers. They are driven by a composite logic simulating a neural filter:
Inputs: Normalised RSI + Momentum Divergence + Volatility State.
Logic: Signals only trigger when the market is statistically overextended AND showing signs of momentum decay.
💎 Holographic Features
🔥 Volumetric Heatmap
The script scans historical price action to build a Volume Profile Heatmap on the right side of the chart.
Purple/Blue Zones: These represent High Volume Nodes (HVNs). These act as "Gravity Wells" for price—often stopping trends or acting as launchpads for reversals.
POC (Point of Control): The bright green line indicates the price level with the absolute highest volume in the lookback period.
🌀 Fractal Structure Lines
Price action is often noisy. The script uses a Fractal Pivot Algorithm (Length 5) to identify the "True Highs" and "True Lows".
It connects these points with dashed "Neural Lines" to show the naked market skeleton.
This instantly reveals if you are in a trend of Higher Highs or a breakdown of Lower Lows.
🖥️ The Heads-Up Display (HUD)
A minimalist dashboard keeps you informed of the math underneath:
ENTROPY: The raw bit-score of market chaos.
REGIME: Tells you instantly if you are in "ORDER" (Tradeable) or "CHAOS" (Sit out).
STRUCT: Real-time status of the fractal structure (Breakout/Breakdown/Ranging).
⚙️ Settings & Configuration
Theme: Choose between "Cyber" (Neon), "Aeon" (Deep Blue), or "Gold" (Luxury).
Max Entropy: Adjust the sensitivity of the Chaos Filter. Lower values = stricter filtering (fewer trades).
Heatmap Depth: Control how far back the volume profile scans.
⚠️ Disclaimer
This tool is designed for educational market analysis. "Entropy" and "Neural" refer to the mathematical algorithms used to process price data and do not guarantee future performance. Always manage risk responsible.

Tesseract X-RayTesseract X-Ray — Smart Money Concept indicator that reveals hidden market structure.
Features:
• Fair Value Gaps (FVG) — imbalance zones where price tends to return
• Order Blocks (OB) — institutional supply/demand zones
• Volume Profile — POC, VAH, VAL levels
• High Volume Nodes (HVN) — liquidity clusters
Clean visualization with automatic zone detection and mitigation tracking.
Built-in alerts for key level touches.
by @TesseractCrypto

Opening Range & Session Liquidity [LTS]“Opening Range & Session Liquidity ” is an intraday planning tool that combines a configurable Opening Range box with session highs/lows and previous-day reference levels. It is designed to help you visualize where liquidity is likely to build up around the cash open and major global sessions, without making any forecasts or performance promises. It is designed with our signature attention to user customization and accessibility.
Opening Range & Bias
The script builds a configurable Opening Range (OR) in New York time (default 08:00–08:15 on a 15-minute basis), regardless of your chart timeframe (up to 1-hour). The high, low, and midline of this window are drawn as a transparent box and dashed midline that extend forward so you can see how the session trades around that range.
At a user-defined Bias Check Time (default 09:30–09:31 NY), the script classifies the OR as:
Bullish if price is above the OR high
Bearish if price is below the OR low
Neutral if price is still trading inside the OR
The box color updates to reflect the current bias if bias mode is enabled. All OR parameters (formation window, bias check, colors, maximum number of zones, etc.) are adjustable.
Entry Signal Logic
The indicator can optionally generate non-repainting visual signals when price interacts with the OR midline.
1. 9:30 Bias mode (trend-following)
A directional bias is locked in at the bias check time.
Signals trigger only when price trades through the OR midline inside the box, aligned with that bias:
Bullish bias → long signal when price touches the midline from below and closes inside the range.
Bearish bias → short signal when price touches the midline from above and closes inside the range.
Each “episode” can fire only once; signals are confirmed on the bar where the conditions first become true.
2. Entry Direction mode (reaction to first touch)
Instead of using a fixed 9:30 bias, the script detects from which side price first enters the OR (from above or from below).
That “entry direction” stays active until price fully exits and closes outside the OR again.
When price later touches the midline while the entry direction is defined, a single long or short signal is triggered based on the stored direction of entry.
In both modes, historical signals are plotted without using future data; only the real-time bar can change state until it closes.
Optional TP/SL Visualization
When a long or short signal appears, the script can draw simple take-profit/stop-loss boxes to illustrate a basic one-trade idea:
Stop-loss distance can be defined as:
A fixed number of points beyond the OR high/low, or
A percentage of ATR (configurable length and percent).
Take-profit is automatically placed at a user-defined risk-to-reward multiple of that stop distance.
The boxes extend forward bar by bar and stop updating once either TP or SL is touched, or when a new OR session resets the context.
These boxes are for visualization only and do not place or manage orders.
Session Liquidity & PDH/PDL
To help you map where liquidity frequently builds up, the script tracks three configurable intraday sessions in New York time:
Asian session (default 18:00–02:00)
London session (default 03:00–08:00)
New York session (default 09:30–16:00)
For each completed session, the indicator records the session high and low, then:
Draws solid horizontal lines and labels (e.g., “Asia Hi/Lo”, “London Hi/Lo”, “NY Hi/Lo”).
Extends these solid lines to the right as long as they remain untouched by price.
When price first trades through a level, the solid line is cut at that bar and replaced by a dashed line that extends only until the next session of the same type begins.
Older sessions are automatically removed according to the “Max Sessions to Display” setting to reduce chart clutter.
In addition, the indicator plots:
Previous Day High (PDH) & Previous Day Low (PDL)
Previous Day Point of Control (PDPoC) – an approximate volume-weighted price computed from intraday data using a simple binning approach on a user-chosen lower timeframe.
Like the session levels, PDH/PDL/PDPoC start as solid lines. After the first touch, each level switches to a dashed style and continues only until the following trading day, at which point the previous day’s dashed lines are stopped and new levels are created.
Info Table & Multi-Timeframe Logic
An optional on-chart info table summarizes the most recent Opening Range:
OR high, low, and midline
Current OR range in points
Active mode (9:30 Bias vs. Entry Direction)
Current bias or entry-direction status
Whether a signal is “Waiting”, “Armed”, or “Triggered”
Whether the OR was built from the chart timeframe or from a 15-minute higher-timeframe feed
If your chart timeframe is higher than the OR calculation timeframe, the script automatically uses multi-timeframe data to build a consistent OR, while enforcing a maximum chart timeframe of 1-hour for reliability.
How to Use This Tool
Use the OR box and bias to define your primary intraday context around the cash open.
Use session highs/lows and PDH/PDL/PDPoC as objective reference levels for where price may react or where stops and liquidity might cluster.
Treat the signal markers and TP/SL boxes as visual guides only. They can help you structure trade ideas, but they are not a trading system by themselves.
Always confirm levels and signals with your own analysis, risk management, and execution rules.
Limitations & Notes
The script is intended for intraday charts up to 1-hour. By the nature of the information being displayed, any time frame above that may result is undesirable visual clutter.
The POC calculation is an approximation based on lower timeframe bar-level volume and binning; it is not a tick-by-tick volume profile.
Signals and levels update in real time on the current forming bar. Once a bar closes, completed historical signals do not repaint, but the last live bar can change until it closes.
The indicator does not use lookahead or offset plotting into the past; it is not designed to predict the future or guarantee any particular trading result.
Always test settings on a demo environment first and manage risk according to your own plan.

Bayesian Order Flow Predictor📌 Bayesian Order Flow Predictor — Advanced Probability Engine for Nasdaq and Futures
This indicator is a next-generation probabilistic forecasting system designed for Nasdaq traders who rely on Order Flow, Auction Market Theory, Value Area dynamics, market structure, DOM imbalance, and Bayesian probability models.
It combines 7 professional-grade factors (DOM, CVD, RSI, EMA trend, ATR volatility, Market Structure, Value Area positioning) into a unified Bayesian probability panel that outputs a clean bullish/bearish probability curve with high-confidence reversal and trend-continuation signals.
Engineered for scalpers, day traders, futures traders, and ICT-style order flow technicians, it delivers real-time directional probability, session-aware signals, and optional news-filter exclusion.
⭐ Features
Bayesian Probability Model (0–100%)
DOM imbalance scoring across dynamic depth levels
Cumulative Volume Delta (CVD) scoring
Market structure detection (HH/LL micro-trend shifts)
RSI momentum and overbought/oversold scoring
EMA directional bias + ATR-normalized deviation
Value Area positioning (VAH / VAL / POC) with optional previous-session mode
Session filtering (only signals during active hours)
Automated news filter (exclude signals around scheduled macro events)
Bull/Bear probability zones with background coloring
Anti-repetition system (no double signals in same direction)
Designed for future scalping, futures order flow, and high-precision timing
🧠 Bayesian Probability Engine — How It Works
The model evaluates 7 independent market factors simultaneously:
DOM imbalance
CVD pressure
Market structure
RSI deviation
EMA trend
Value Area position
ATR volatility shift
Each factor is transformed into a normalized score, multiplied by its weighting parameter, and aggregated into a global score.
This score is then passed through a Bayesian logistic function to convert uncertainty into a smooth probability curve, giving traders a clean, mathematically stable, and noise-resistant forecast.
📈 Buy & Sell Signal Logic
Signals trigger when:
Bullish Probability crosses above the user threshold
Bearish Probability crosses below the opposite threshold
Session is active
No protected news event is occurring
This avoids noise, prevents over-signaling, and focuses only on high-confidence inflection points.
🎯Fully compatible with the indicator: ➡️ AI Probabilistic Orderflow scalper
Both indicators synchronize perfectly when used together:
Bayesian panel → trend probability
Scalper v1 → timing + TP/SL engine
Together they create a complete probability-driven revenue management system for scalping Future.
📘 How to Use
Add the indicator to your chart
Set your trading session (e.g., 09:30–16:00 EST)
Adjust weights depending on your style (Order Flow / Momentum / Value Area)
Watch the probability curve:
Above threshold → bullish bias
Below threshold → bearish bias
Take signals when the curve crosses thresholds, not when flat
Combine with "AI Probabilistic Orderflow scalper" indicator for execution timing
Avoid high-impact news using the News Filter
💎 Advantages
Professional-grade Bayesian model
Works in all volatility regimes
Noise-resistant and smoother than traditional oscillators
Integrates Order Flow + Auction Theory + Momentum + Volatility
Perfect for NQ scalpers seeking an AI-style probability dashboard
Reduces emotional decision-making
Compatible with any execution strategy
Optimized for high winrate scalping and sniper entries

Prime Market Profile [xontrades1uae]
Automatic or custom tick calibration for gold, indices, or forex.
Highlighted POC, Value Area, and Initial Balance Range.
Smart visual clustering to detect congestion, breakout zones, and key volume nodes.
Compatible with short timeframes (1m–15m) for scalpers and day traders.

Footprint.Pro-v3.7-EN [Elykia]Title: Footprint Pro System - Order Flow & Price Action
Footprint Pro is a comprehensive institutional-grade Order Flow suite designed to visualize the internal dynamics of a candle. It allows traders to see Bid x Ask volume, Delta, and Liquidity imbalances directly inside the bars, offering a "X-Ray" view of the market.
This tool is optimized for Scalping and Intraday trading, compatible with both Standard Timeframes and simulated Range Bars.
🔥 Key Features
1. Dual Calculation Modes
Timeframe Mode: Displays Footprints on standard candles (1m, 5m, etc.) with a live countdown.
Range Mode (Simulated): Calculates Range Bars based on volatility (Points/Ticks) rather than time. This filters out noise and highlights pure price movement.
Note: Includes a performance optimizer to limit historical calculation.
2. Advanced Visualization Styles
Standard Style: Classic box display with Bid x Ask or Total Volume numbers. Includes a Volume Heatmap that changes color intensity based on Delta strength.
Profile Style: Displays a volume profile histogram next to each candle to visualize the distribution of liquidity within the bar.
3. 🧠 Smart Assistant & Automated Setups
The script includes a real-time analysis engine that detects 5 high-probability Order Flow setups:
S1 - Rejection: Detects price reversal with strong wick rejection and Delta confirmation.
S2 - Exhaustion: Identifies a trend drying up (Volume drops significantly at highs/lows).
S3 - Absorption (Iceberg): Detects aggressive buying/selling that fails to move price (High Volume + Inverse Delta).
S4 - Trapped Traders (New): "Effort vs. Result." Detects high Delta participation but the candle closes in reverse (e.g., Doji or opposite color).
S5 - Stacked Imbalances (New): Identifies "Walls" of liquidity. Looks for 3 consecutive levels where Buy/Sell volume exceeds the imbalance ratio (default 300%).
4. Data & Analytics Dashboard
Fixed Data Ribbon: A ribbon at the bottom of the screen showing Volume, Delta, and Divergences for the last 50 candles.
Technical Dashboard: Displays current mode, Range size, and tick value.
Setups Table: An on-screen legend explaining active signals and their logic.
5. Order Flow Nuances
Delta Flip (Divergence): Highlights candles where Price and Delta disagree (e.g., Red Candle but Positive Delta), signaling a potential reversal or trap.
POC (Point of Control): auto-plots the highest volume node of the candle.
VWAP Session: Integrated anchor for confluence.
5. 🔥 Advanced Histogram & Visualization
The core of this system is its ability to break down a candle into granular price levels (bins). It offers a rich visual representation of market intent:
Dynamic Histogram:
Standard Style: Displays volume blocks inside the candle.
Profile Style: Projects a Volume Profile histogram alongside the candle to instantly identify high-volume nodes (HVN) and low-volume nodes (LVN).
Delta & Volume Data:
You can choose to display Bid x Ask interactions or Total Volume per level.
Delta Coloring: Automatically colors bars based on the net difference between buyers and sellers.
Smart Heatmap (Visual Filtering):
The script uses a dynamic Heatmap System.
Weak Levels: Displayed with high transparency (faint colors), filtering out noise.
Strong Levels: Displayed in solid, bright colors (Red/Green) when volume/delta exceeds critical thresholds. This draws your eye immediately to where the real money is exchanging hands.
🛠️ Installation & Best Setup (Critical)
For the most accurate volume filtering and "Tick-Perfect" precision, this tool is designed to work on the lowest possible timeframe.
1. Set Chart to 1-Second Timeframe:
Ideally, position your TradingView chart on the 1-second (1s) timeframe.
Why? The script aggregates these micro-movements to reconstruct higher timeframe candles with minimal data loss and maximum volume precision.
2. Clean the Chart:
Go to Chart Settings (Symbol).
Uncheck "Body", "Borders", and "Wick".
Why? The script draws its own custom candles. Hiding the native chart prevents visual clutter.
3. Configure the Footprint:
Open the Indicator Settings.
Timeframe Footprint: Select your desired trading timeframe (e.g., 1 minutes ... 15 minutes, ).
The script will now calculate and draw a perfect 5-minute Footprint candle using the high-precision 1-second data feed.
🚀 Optimization
Footprint charts are calculation-heavy. This script includes a Performance Optimization group:
Limits the number of drawn boxes.
Dynamic buffer calculation.
"Smart Load" allows you to view historical data without freezing the browser.
Recommended (Premium): To optimize the tool and precisely separate Buy/Sell, using second-based charts (1s, 5s) via a TradingView Premium subscription is highly recommended.
Disclaimer: Order Flow analysis requires practice. This tool provides data visualization and does not constitute financial advice.

MFI Volume Profile [Kodexius]The MFI Volume Profile indicator blends a classic volume profile with the Money Flow Index so you can see not only where volume traded, but also how strong the buying or selling pressure was at those prices. Instead of showing a simple horizontal histogram of volume, this tool adds a money flow dimension and turns the profile into a price volume momentum heat map.
The script scans a user controlled lookback window and builds a set of price levels between the lowest and highest price in that period. For every bar inside that window, its volume is distributed across the price levels that the bar actually touched, and that volume is combined with the bar’s MFI value. This creates a volume weighted average MFI for each price level, so every row of the profile knows both how much volume traded there and what the typical money flow condition was when that volume appeared.
On the chart, the indicator plots a stack of horizontal boxes to the right of current price. The length of each box represents the relative amount of volume at that price, while the color represents the average MFI there. Levels with stronger positive money flow will lean toward warmer shades, and levels with weaker or negative money flow will lean toward cooler or more neutral shades inside the configured MFI band. Each row is also labeled in the format Volume , so you can instantly read the exact volume and money flow value at that level instead of guessing.
This gives you a detailed map of where the market really cared about price, and whether that interest came with strong inflow or outflow. It can help you spot areas of accumulation, distribution, absorption, or exhaustion, and it does so in a compact visual that sits next to price without cluttering the candles themselves.
Features
Combined volume profile and MFI weighting
The indicator builds a volume profile over a user selected lookback and enriches each price row with a volume weighted average MFI. This lets you study both participation and money flow at the same price level.
Volume distributed across the bar price range
For every bar in the window, volume is not assigned to a single price. Instead, it is proportionally distributed across all price rows between the bar low and bar high. This creates a smoother and more realistic profile of where trading actually happened.
MFI based color gradient between 30 and 70
Each price row is colored according to its average MFI. The gradient is anchored between MFI values of 30 and 70, which covers typical oversold, neutral and overbought zones. This makes strong demand or distribution areas easier to spot visually.
Configurable structure resolution and depth
Main user inputs are the lookback length, the number of rows, the width of the profile in bars, and the label text size. You can quickly switch between coarse profiles for a big picture and higher resolution profiles for detailed structure.
Numeric labels with volume and MFI per row
Every box is labeled with the total volume at that level and the average MFI for that level, in the format Volume . This gives you exact values while still keeping the visual profile clean and compact.
Calculations
Money Flow Index calculation
currentMfi is calculated once using ta.mfi(hlc3, mfiLen) as usual,
Creation of the profileBins array
The script creates an array named profileBins that will hold one VPBin element per price row.
Each VPBin contains
volume which is the total volume accumulated at that price row
mfiProduct which is the sum of volume multiplied by MFI for that row
The loop;
for i = 0 to rowCount - 1 by 1
array.push(profileBins, VPBin.new(0.0, 0.0))
pre allocates a clean structure with zero values for all rows.
Finding highest and lowest price across the lookback
The script starts from the current bar high and low, then walks backward through the lookback window
for i = 0 to lookback - 1 by 1
highestPrice := math.max(highestPrice, high )
lowestPrice := math.min(lowestPrice, low )
After this loop, highestPrice and lowestPrice define the full price range covered by the chosen lookback.
Price range and step size for rows
The code computes
float rangePrice = highestPrice - lowestPrice
rangePrice := rangePrice == 0 ? syminfo.mintick : rangePrice
float step = rangePrice / rowCount
rangePrice is the total height of the profile in price terms. If the range is zero, the script replaces it with the minimum tick size for the symbol. Then step is the price height of each row. This step size is used to map any price into a row index.
Processing each bar in the lookback
For every bar index i inside the lookback, the script checks that currentMfi is not missing. If it is valid, it reads the bar high, low, volume and MFI
float barTop = high
float barBottom = low
float barVol = volume
float barMfi = currentMfi
Mapping bar prices to bin indices
The bar high and low are converted into row indices using the known lowestPrice and step
int indexTop = math.floor((barTop - lowestPrice) / step)
int indexBottom = math.floor((barBottom - lowestPrice) / step)
Then the indices are clamped into valid bounds so they stay between zero and rowCount - 1. This ensures that every bar contributes only inside the profile range
Splitting bar volume across all covered bins
Once the top and bottom indices are known, the script calculates how many rows the bar spans
int coveredBins = indexTop - indexBottom + 1
float volPerBin = barVol / coveredBins
float mfiPerBin = volPerBin * barMfi
Here the total bar volume is divided equally across all rows that the bar touches. For each of those rows, the same fraction of volume and volume times MFI is used.
Accumulating into each VPBin
Finally, a nested loop iterates from indexBottom to indexTop and updates the corresponding VPBin
for k = indexBottom to indexTop by 1
VPBin binData = array.get(profileBins, k)
binData.volume := binData.volume + volPerBin
binData.mfiProduct := binData.mfiProduct + mfiPerBin
Over all bars in the lookback window, each row builds up
total volume at that price range
total volume times MFI at that price range
Later, during the drawing stage, the script computes
avgMfi = bin.mfiProduct / bin.volume
for each row. This is the volume weighted average MFI used both for coloring the box and for the numeric MFI value shown in the label Volume .

8-Hours Overnight Volume Profile @MaxMaserati 3.08-Hours Overnight Volume Profile MaxMaserati 3.0
The 8-Hours Overnight Volume Profile indicator provides comprehensive volume distribution analysis for overnight trading sessions, helping traders understand institutional accumulation patterns and key price levels developed during low-liquidity periods.
Core Functionality
This indicator analyzes volume distribution across overnight sessions (default: 1:00 AM - 9:00 AM EST) to identify critical price levels where the most trading activity occurred. By utilizing lower timeframe data for accurate volume calculations, it maintains consistency across all chart timeframes while providing detailed profile resolution.
Key Features & Educational Value
Volume Profile Components:
POC (Point of Control): Identifies the price level with highest traded volume, representing the fairest price acceptance during the session
Fair Value Area (FVA): Highlights the price range containing the specified percentage of total volume (default 40%), indicating the primary area of value
High Volume Nodes (HVN): Shows areas of strong price acceptance and potential support/resistance
Low Volume Nodes (LVN): Reveals areas of price rejection that may act as continuation zones
Market Bias Table:
The integrated bias analysis table provides educational context for price action relative to overnight value areas:
Bullish Bias: Close above FVA suggests upside continuation potential
Bearish Bias: Close below FVA indicates downside pressure
P-Shaped or Top-Heavy : Price rallied above FVA but closed inside, suggesting potential rejection
B-Shaped or Bottom-Heavy: Price dropped below FVA but closed inside, indicating potential support
Neutral: Price remained within FVA, suitable for range-based strategies
Professional Customization
Multiple Color Themes: Professional Blue, Dark Gold, Neon, Minimal Gray, or Custom
Visual Styles: Choose between Solid, 3D, or Outlined bar styles
Gradient Effects: Optional gradient intensity for enhanced visual depth
Flexible Display: Adjustable profile width, resolution, and session count
Trading Applications
This tool serves educational purposes by helping traders:
Understand where overnight institutional activity established value
Identify potential support/resistance levels based on volume acceptance
Recognize bias shifts when price moves beyond established value areas
Plan entries based on value area relationships and market structure
Technical Implementation
The indicator uses multi-timeframe analysis to ensure accurate volume calculation regardless of your chart timeframe, providing reliable profile data from lower timeframe consolidation. The session-based approach isolates overnight activity, making it particularly useful for traders analyzing pre-market and early regular session dynamics.
This indicator is designed for educational purposes to enhance understanding of volume profile analysis and overnight market structure. All trading decisions should be made based on comprehensive analysis and proper risk management.

Pristine Adaptive Alpha ScreenerThe Pristine Adaptive Alpha Screener allows users to screen for all of the trading signals embedded in our premium suite of TradingView tools🏆
▪ Pristine Value Areas & MGI - enables users to perform comprehensive technical analysis through the lens of the market profile in a fraction of the time!
▪ Pristine Fundamental Analysis - enables users to perform comprehensive fundamental stock analysis in a fraction of the time!
▪ Pristine Volume Analysis - organizes volume, liquidity, and share structure data, allowing users to quickly gauge the relative volume a security is trading on, and whether it is liquid enough to trade
💠 How is this Screener Original?
▪ The screener allows users to screen for breakouts, breakdowns, bullish and bearish trend reversals, and allows users to narrow a universe of stocks based purely on fundamentals, or purely on technicals. One screening tool to support an entire technofundamental workflow!
💠 Signals Overview
Each of the below signals serves one of two purposes:
1) A pivot point to be used as a long or short entry
2) A tool for narrowing a universe of stocks to a shorter list of stocks that have a higher potential for superperformance
▪ HVY(highest volume in a year) -> Featured in Pristine Volume Analysis -> Entry signal
▪ Trend Template -> Inspired by Mark Minervini's famous trend filters -> Tool for narrowing a universe of stocks to a shorter list with a higher potential for superperformance
▪ Rule of 100 -> Metrics from Pristine Fundamental Analysis -> Tool for narrowing a universe of stocks to a shorter list with a higher potential for superperformance
▪ Bullish 80% Rule -> Featured in Pristine Value Areas & MGI -> Long entry signal -> Trend Reversal
▪ Bearish 80% Rule -> Featured in Pristine Value Areas & MGI -> Short entry signal -> Trend Reversal
▪ Break Above VAH -> Featured in Pristine Value Areas & MGI -> Long entry signal -> Trend Continuation
▪ Break Below VAL -> Featured in Pristine Value Areas & MGI -> Short entry signal -> Trend Continuation
💠 Signals Decoded
▪ HVY(highest volume in a year)
Volume is an important metric to track when trading, because abnormally high volume tends to occur when a new trend is kicking off, or when an established trend is hitting a climax. Screen for HVY to quickly curate every stock that meets this condition.
▪ Trend Template
Mark Minervini's gift to the trading world. Via his book "Think and Trade Like a Stock Market Wizard". Stocks tend to make their biggest moves when they are already in uptrends, and the Minervini Trend template provides criteria to assess whether a stock is in a clearly defined uptrend. Filter for trend template stocks using our tool.
▪ Rule of 100
Pristine Capital's gift to the trading world. The rule of 100 filters for stocks that meet the following condition: YoY EPS Growth + YoY Sales Growth >= 100%. Stocks that meet this criteria tend to attract institutional investors, making them strong candidates for swing trading to the long side.
💠 Market Profile Introduction
A Market Profile is a charting technique devised by J. Peter Steidlmayer, a trader at the Chicago Board of Trade (CBOT), in the 1980's. He created it to gain a deeper understanding of market behavior and to analyze the auction process in financial markets. A market profile is used to analyze an auction using price, volume, and time to create a distribution-based view of trading activity. It organizes market data into a bell-curve-like structure, which reveals areas of value, balance, and imbalance.
💠 How is a Value Area Calculated?
A value area is a distribution of 68%-70% of the trading volume over a specific time interval, which represents one standard deviation above and below the point of control, which is the most highly traded level over that period.
The key reference points are as follows:
Value area low (VAL) - The lower boundary of a value area
Value area high (VAH) - The upper boundary of a value area
Point of Control (POC) - The price level at which the highest amount of a trading period's volume occurred
If we take the probability distribution of trading activity and flip it 90 degrees, the result is our Pristine Value Area!
Market Profile is our preferred method of technical analysis at Pristine Capital because it provides an objective and repeatable assessment of whether an asset is being accumulated or distributed by institutional investors. Market Profile levels work remarkably well for identifying areas of interest, because so many institutional trading algorithms have been programmed to use these levels since the 1980's!
The benefits of using Market Profile include better trade location, improved risk management, and enhanced market context. It helps traders differentiate between trending and consolidating markets, identify high-probability trade setups, and adjust their strategies based on whether the market is in balance (consolidation) or imbalance (trending). Unlike traditional indicators that rely on past price movements, Market Profile provides real-time insights into trader behavior, giving an edge to those who can interpret its nuances effectively.
▪ Bullish 80% Rule
If a security opens a period below the value area low , and subsequently closes above it, the bullish 80% rule triggers, turning the value area green. One can trade for a move to the top of the value area, using a close below the value area low as a potential stop!
In the below example, HOOD triggered the bullish 80% rule after it reclaimed the monthly value area!
HOOD proceeded to rally through the monthly value area and beyond in subsequent trading sessions. Finding the first stocks to trigger the bullish 80% rule after a market correction is key for spotting the next market leaders!
▪ Bearish 80% Rule
If a security opens a period above the value area high , and subsequently closes below it, the bearish 80% rule triggers, turning the value area red. One can trade for a move to the bottom of the value area, using a close above the value area high as a potential stop!
ES proceeded to follow through and test the value area low before trending below the weekly value area
▪ Break Above VAH
When a security is inside value, the auction is in balance. When it breaks above a value area, it could be entering a period of upward price discovery. One can trade these breakouts with tight risk control by setting a stop inside the value area! These breakouts can be traded on all chart timeframes depending on the style of the individual trader. Combining multiple timeframes can result in even more effective trading setups.
RBLX broke out from the monthly value area on 4/22/25👇
RBLX proceeded to rally +62.78% in 39 trading sessions following the monthly VAH breakout!
▪ Break Below VAL
When a security is inside value, the auction is in balance. When it breaks below a value area, it could be entering a period of downward price discovery. One can trade these breakdowns with tight risk control by setting a stop inside the value area! These breakouts can be traded on all chart timeframes depending on the style of the individual trader. Combining multiple timeframes can result in even more effective trading setups.
CHWY broke below the monthly value area on 7/20/23👇
CHWY proceeded to decline -53.11% in the following 64 trading sessions following the monthly VAL breakdown!
💠 Metric Columns
▪ %𝚫 - 1-day percent change in price
▪ YTD %𝚫 - Year-to-date percent change in price
▪ MTD %𝚫 - Month-to-date percent change in price
▪ MAx Moving average extension - ATR % multiple from the 50D SMA -Inspired by Jeff Sun
▪ 52WR - Measures where a security is trading in relation to it’s 52wk high and 52wk low. Readings near 100% indicate close proximity to a 52wk high and readings near 0% indicate close proximity to a 52wk low
▪ Avg $Vol - Average volume (50 candles) * Price
▪ Vol RR - Candle volume/ Avg candle volume
💠 Best Practices
Monday -> Friday Post-market Analysis
1) Begin with a universe of stocks. I use the following linked universe screen as a starting point: www.tradingview.com
2) Screen for the HVY signal -> Add those stocks to a separate flagged (colored) watchlist
3) Screen for the Bullish 80% Rule signal -> Add those stocks to a separate flagged (colored) watchlist
4) Screen for the Break Above VAH Signal -> Add those stocks to a separate flagged (colored) watchlist
5) Screen for the Break Below VAL Signal -> Add those stocks to a separate flagged (colored) watchlist
6) Screen for the Bearish 80% Rule Signal -> Add those stocks to a separate flagged (colored) watchlist
7) Screen for the Bearish 80% Rule Signal -> Add those stocks to a separate flagged (colored) watchlist
8) Screen for the Trend Template Signal -> Add those stocks to a separate flagged (colored) watchlist
9) Toggle through each list and analyze each stock chart using the Supercharts tool in TradingView
10)Record the number of stocks in each list as a way of analyzing market conditions
Weekend Analysis
1) Begin with a universe of stocks. I use the following linked universe screen as a starting point: www.tradingview.com
2) Screen for the Rule of 100 Signal. Use this as a starting point for deeper fundamental and/or thematic and/or technical research
3) Screen for stocks that meet specific performance thresholds, such as YTD %𝚫 > 100% etc
💠 Get Creative
▪Users have the ability to layer signals on top of each other when screening. To do so, filter for a signal, and then filter your new list by another signal! Play around with the screener, and find what works best for you!

Orderflow - Full suiteThis indicator provides a comprehensive institutional view of the market by aggregating real-time volume and delta data from the four largest crypto derivatives exchanges: Binance, Bybit, OKX, and Gate.io.
Unlike standard indicators that rely on a single data feed, this tool normalizes and combines volume from multiple sources to reveal the "True Market Volume." It features a sophisticated 1-Minute Granularity Scanner that analyzes the underlying 1m data within your current timeframe to detect hidden whale activity that is often smoothed out on higher timeframe charts.
Key Features:
🌊 Multi-Exchange Aggregation: Automatically fetches and sums volume from Binance, Bybit, OKX, and Gate.io. It handles currency normalization (converting USDT volume to Base Currency) to ensure accurate apples-to-apples calculations.
🐋 1-Minute Big Trade Scanner: The script scans the 1-minute candles underlying your current bar. It detects "Whale," "Huge," and "Large" trades that occur within a single minute, revealing aggressive market participants hiding inside consolidated candles.
🛡️ Absorption Detection: Identifies specific moments where high aggregated volume meets minimal price movement, highlighting areas where passive limit orders are absorbing aggressive flow.
📉 CVD Divergence: accumulating Aggregated Delta to spot divergences between price action and order flow (e.g., Price making Lower Lows while CVD makes Higher Lows).
📊 Dynamic Volume Profile: A fully functional Volume Profile driven by the global aggregated data, including Value Area (VAH/VAL) and POC logic.
⚖️ Market Balance & Retests: Automatically detects if the market is Balanced or Imbalanced and highlights valid retests of Value Area High/Low levels.
How to Use:
Bubbles: Represent Big Trades detected on the 1m timeframe (Blue = Buy, Red = Sell). Size indicates relative volume.
Diamonds: Indicate Absorption events (High volume, zero price progress).
Triangles: Indicate CVD Divergences (Potential reversals).
Right Panel: Displays the Volume Profile and Key Levels based on the total market liquidity.
Note: This indicator uses request.security_lower_tf to scan granular data. It is optimized for Crypto Perpetual pairs (USDT.P).


DTR Volume 1DDTR Volume 1D is a powerful tool to analyze volume and market activity across different trading sessions. It provides detailed session-level insights to help traders understand where the market is most active and identify key price levels.
Key Features:
1. Session Volume Profiles
- Displays volume distribution for each session.
- Supports Tokyo, London, New York, Daily, Weekly, Monthly, Quarterly, and Yearly sessions.
- Optional Forex session boxes without profiles.
2. Volume Analysis Tools
- Highlights POC (Point of Control) – the price level with the highest traded volume.
- Shows VAH (Value Area High) and VAL (Value Area Low) with optional Value Area Box.
- Tracks live session zones for real-time monitoring.
3. Customizable Display
- Adjustable resolution for finer or coarser profiles.
- Multiple bar modes for different visual styles.
- Fully customizable colors for up/down volume, boxes, lines, and POC.
- Option to smooth volume data for assets with large volume spikes.
4. Data Type Options
- Supports standard Volume or Open Interest data.
5. Session Boxes and Labels
- Automatically draws session boxes with high/low range.
- Optional session labels for easy identification.
6. Smart Calculations
- Auto-detects session start and end.
- Calculates volume profiles based on user-defined resolution.
- Highlights important levels dynamically during the session.
DTR Volume 1D is ideal for traders who want a clear, actionable view of volume distribution and session dynamics, helping you make better trading decisions with session-level insights.

DTR OI IndicatorThe DTR OI Indicator is a multi-exchange open interest indicator designed for futures traders.
It aggregates OI from multiple exchanges to provide a unified and more reliable view of market positioning.
MAIN FUNCTIONS
• Open Interest Candles
• Open Interest Delta
• Delta × Relative Volume
• Open Interest RSI
• Threshold-based alerts for unusually large OI increases or decreases
• Optional OI EMA smoothing
PROFILE SYSTEM
Includes an OI-based distribution profile similar to a volume profile.
Shows Value Area, POC, and structural nodes based on OI activity within the visible chart range.
WHAT IT HELPS IDENTIFY
• Liquidations and rekt events
• Aggressive long/short buildup
• Position unwinds ahead of reversals
• OI-driven levels of interest
• Momentum confirmation (Delta × rVOL)
• Trend exhaustion (OI RSI)
NOTES
• Works across several exchanges for broader accuracy
• Coin or USD quoting supported
• Profile mode is resource-intensive
• No repainting
Ideal for traders who rely on OI, delta, and market positioning to understand futures flows and liquidity shifts.
