Litt Opening Range BreakoutThe Litt ORB, Opening Range Breakout, is a tool used by many intraday traders to take advantage of short-term momentum. This script plots extensions based on the opening range and then color candles depending on where the closing price of that candle is. The opening range is defined by either the first 30 or 60 minutes of a new trading day. During that time the opening ranges are set. If the opening range time has passed and we start to break above the Opening Range High that is a good indication that a Trend Day to the upside could be forming. When a stock takes out the range high from the first 30 or 60 minutes this is called an Opening Range Breakout.
OR = Opening Range
ORH = Opening Range High
ORL = Opening Range Low
ORM = Opening Range Mid (Half-way between ORH and ORL)
You can see the ORH and ORL (Opening Range) lines on the chart. The other lines are extension lines from the Opening Range. These are used as price targets for the end of Opening Range breakouts.
The candles are colored as follows.
If we are above the ORH then we use Bull Color 1.
If we are below the ORL then we use Bull Color 2.
If we are above the ORM, Opening Range Mid or the halfway point between the ORH and the ORL, we color Bull Color 2.
If we are below the ORM then we color Bear Color 2.
If the current time is still within the Opening Range then we color the Opening Range Color.
OR = Opening Range
ORH = Opening Range High
ORL = Opening Range Low
ORM = Opening Range Mid (Half-way between ORH and ORL)
Поиск скриптов по запросу "range"

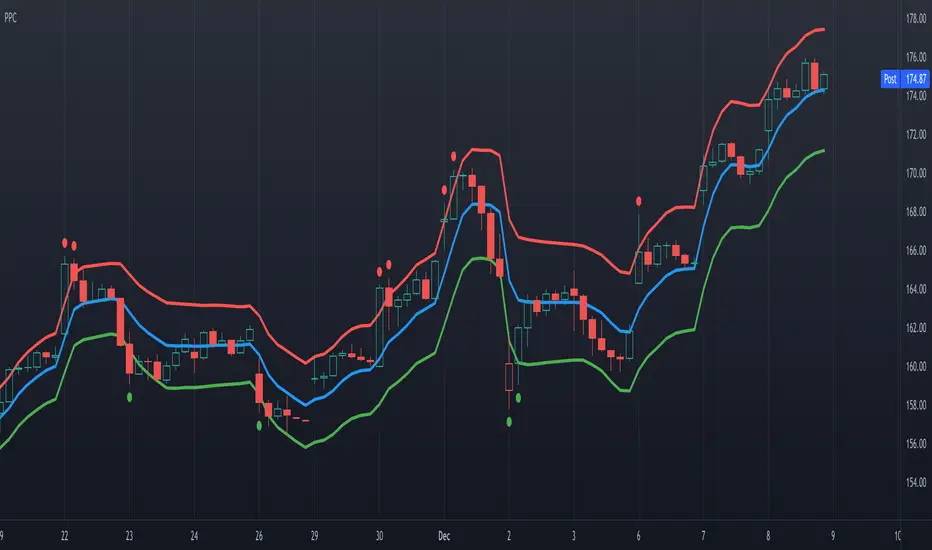
Precision Price Channel [AstrideUnicorn]Precision Price Channel (PPC) is a channel indicator based on advanced Kalman filtering. As one can see, the PPC channel is very narrow, but the price stays inside it with a very high probability. It is a precise model that shows the bounds for price swings in trending or ranging markets.
The indicator helps to determine optimal prices to enter a long or short trade. One can also use it for mean reversion trading when the market is in a range regime, just like other channel indicators.
How to use
The trader can use PPC in pair with their trading system to find the best price to enter a long or short trade suggested by their strategy.
For example, if you feel bullish about a market, you can enter a long position at the moment when the price crosses the bottom PPC line and leaves the channel. A green circle arrives below this candle, indicating the best price for a long trade. Such entry points ensure that you “buy very low” if the market will surge eventually.
If the trader thinks that the price of an asset is to decrease, they can wait for the indicator to show the best price for a short trade. The best moment to enter a sell position is when a candle breaks out of the PPC channel through the upper line. A red circle will show above such a candle.
In this use case, one should look at the red and green circles not as at signals that forecast the market will go up or down but real-time signals showing that now it is the best price to enter a long or short trade.
One can also use the PPC indicator to get entry signals. If the market is in a range regime, the red and green circles give mean-reversion signals for short-term trades inside the range.
The price crossing the blue middle line can serve as a signal to enter a trend.
The PPC indicator is auto-adjustable and does not have any user settings.
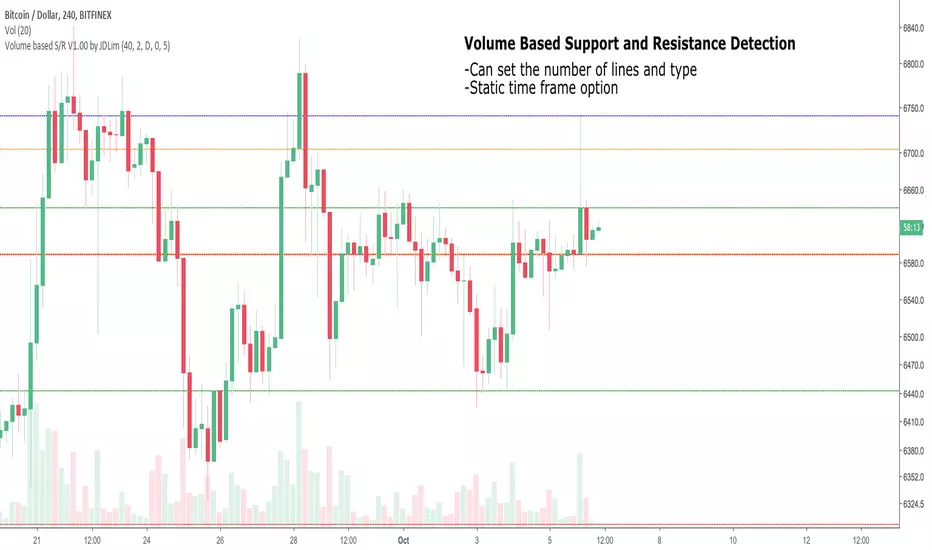
Volume-based Support and ResistanceV1.00
Pre-release; still working on this.
Identify the highest volume candles can plot support/resistance based on them.
Will try to create ranges using them.
_CM_BarRange_PercentileI know a Trader that went 18 months without a losing trade. This Trader averaged trading 700-800 contracts per month in the Futures markets.
The was not his only system but here were his rules.
He looked at the 60 minute bar and calculated the ranges of the bars over the last 3 months. IF the range of the Bar was Greater Than the 99th Percentile, He would Fade that move or take the trade in the opposite direction.
Thought process is If the Price Bar is Greater Than the 99th Percentile then typically the market reverses. This happens a lot of times at news events. If you’ve studied the markets long enough you know if a Nes based event causes a Huge Move, which we define as Greater than the 99th Percentile, the Market typically moves in the opposite direction.
***This is dependent on the Instrument your trading and the time frame your trading. Some Instruments and time frames this signals a continuation move.
I also added in the Low of the Range based on the 99th Percentile. Often times Low Range Bars…especially if they appear at the top of a swing move, or the bottom of a swing move…create a high probability entry once the High or Low of the bar is taken out in the opposite direction of the previous move…The Low Range bars show indecision after a strong move and create great reversal opportunities.
Works on All Time Frames…again depending on the instrument your trading.
On instruments that MOVE or have High Volatility like Crude and Oil you can get great signals on 1 minute bars.
***Code includes ability to pick ham many bars you want your Look Back Period To Be.
***You can change the percentages to use the 99th Percentile, or 95th percentile, etc…
***The Green Line is the Value of the High Range Percentile.
***The Red Line is the Value of the Low Range Percentile.
***Plots a Magenta Cross on the Red Line if the Range is Below the Low Range Percentile.
***Plots a yellow Cross on the Green Line if the Range is Greater Than the High Range Percentile.
***The Aqua line is the Midpoint of the Range. Or the Average Price Move.
***Colors the Price Bar Yellow if the Range exceeds the High Range Percentile.
***Colors The Bar Magenta if the Range is Less Than the Low Range Percentile
***All parameters can be turned on or off via Check Boxes in the Inputs Tab

ADR Daily & Session (Asia, London, NY) Range TrackerOVERVIEW:
The Daily & Session Range Tracker provides comprehensive range analysis for daily and intraday trading sessions (Asia, London, NY) . This indicator is essential for traders who need to understand market volatility and typical price movement ranges across different trading sessions.
KEY FEATURES:
• Daily Range Tracking: Tracks the daily candle range starting from 18:00 (6 PM), aligning with the institutional trading day open
• Session-Based Analysis: Monitors Asia (18:00-02:00), London (02:00-08:00), and NY (08:00-16:00) sessions
• Statistical Analysis: Displays Current, Average, and Median ranges for each period
• Customizable Lookback: Adjustable lookback period (1-20 days) for historical range calculation
• Clean Table Display: Organized data table positioned in the bottom-right corner
HOW TO USE:
1. Add the indicator to your chart
2. Adjust the lookback period to match your trading style (default: 10 days)
3. Customize session times if trading in a different timezone
4. Use the range data to set realistic profit targets and stop losses
5. Compare current range to average/median to gauge if price has room to move
SETTINGS:
• Lookback Period: Number of days to include in average/median calculations (1-20)
• Text Color: Customize the table text color for visibility
• Session Times: Adjust session start/end times for your timezone
PERFECT FOR:
✓ Day traders monitoring session volatility
✓ Scalpers setting realistic targets based on average ranges
✓ Swing traders understanding daily movement potential
✓ Risk management and position sizing decisions
NOTE: The daily range resets at 18:00 to align with institutional daily candle open times.

Universal Market Ranges█ OVERVIEW
Universal Market Ranges is a universal market indicator that, within a single tool, identifies trend direction and regime, shows price movement ranges relative to volatility, can be used as dynamic SL and TP levels, and offers optional signals generated separately for each zone.
The indicator is based on a smoothed moving average with an ATR-based significance filter and multi-level volatility bands, which organize the market into logical zones of increasing importance.
Instead of generating isolated signals, Universal Market Ranges provides full market context, allowing traders to make their own informed decisions.
█ CONCEPT
The core idea behind the indicator is full configurability, which allows it to be used for a wide range of trading purposes.
Depending on the settings and visibility of individual elements, Universal Market Ranges can function as:
- a complete trading system
- a clean trend indicator
- a single volatility channel
- a standalone filtered moving average
- a zone-based structure for position management (SL / TP)
By disabling selected bands, adjusting their multipliers, or modifying fill transparency, traders can tailor the indicator precisely to their trading style, market, and timeframe.
Moving Average Logic
The applied moving average is not classically weighted.
ATR acts here as a significance filter, determining whether a given price change is meaningful enough to affect the average.
When the price deviation from the MA exceeds a defined volatility threshold (ATR × multiplier), the moving average updates normally.
When price changes are too small and remain within market noise, the moving average remains unchanged.
As a result, the MA reacts only to significant price movements, ignoring minor fluctuations and consolidations.
█ ZONE STRUCTURE
- Trend Band (TB)
A channel used to define the trend regime.
- price breaking above the TB → trend shifts to bullish
- price breaking below the TB → trend shifts to bearish
The Trend Band can be visually disabled, while the trend logic continues to operate in the background.
- wider TB → less sensitive, fewer and later trend changes
- narrower TB → more sensitive, more frequent regime changes
- Inner Band (IB)
The primary zone of acceptable price deviation from the moving average.
- represents equilibrium and “comfortable” price movement
- Outer Band 1 (OB1)
A zone of clear market extension.
- first sign that price is moving away from equilibrium
- often used as a partial profit-taking level
- Outer Band 2 (OB2)
An extreme zone.
- very strong deviation from the moving average
- statistically rare price movements
- often marks the final phase of large impulses
█ FEATURES
Data Sources:
- Filtered moving average (SMA / EMA / RMA / WMA)
- ATR as the volatility measure for all zones
- Candle coloring based on the current trend regime
Signals (optional):
- Zone exit and return signals (IB / OB1 / OB2)
- Moving average cross in trend direction
- Trend regime change (TB breakout)
Visual Elements:
- Trend-based candle coloring
- Smooth fills between zones
- Labels with current price levels on the right side of the chart
Alerts:
- IB Breakout / Return
- OB1 & OB2 Exit / Return
- MA Cross in trend direction
- Trend Change (TB)
█ HOW TO USE
Adding the Indicator
Paste the code into the Pine Editor or search for
“Universal Market Ranges” on TradingView.
Key Settings:
- MA Length – moving average sensitivity
- ATR Length – band stability and width
- Minimum Deviation (ATR) – moving average update filter
→ lower values: MA updates more frequently but filters less noise
- Band Multipliers – define the significance of each zone
- MA Smoothing Type – determines the reaction character
█ USE CASES
Universal Market Ranges can be used for:
- trend trading – entries on trend regime changes
- defining dynamic SL and TP levels
- contrarian strategies – entries on price returns to zones
- analyzing price range and movement quality
Zone interpretation:
- price near the MA → market equilibrium
- price in OB1 → clear extension
- price in OB2 → extreme deviation from equilibrium
█ NOTES
- The indicator works on all instruments and timeframes
- Best results are achieved by adapting band multipliers to the market
- Can be combined with other technical analysis methods such as Fibonacci levels, FVG, and pivot levels
- This is not a signal-only system — it is a context-based analytical tool

Multi-Period Opening Range [ORB]Multi-Period Opening Range Indicator
A comprehensive Opening Range (OR) tool for traders who want to track multiple timeframe ORs simultaneously with complete visual customization.
📊 WHAT IS OPENING RANGE?
The Opening Range is the high and low price established during a specific period at the start of a trading session. Professional traders use these levels as critical support/resistance zones throughout the day.
✨ KEY FEATURES
Five Customizable OR Periods:
5-Minute OR : 9:30-9:35 AM EST (Quick scalping reference)
15-Minute OR : 9:30-9:45 AM EST (Standard OR period)
30-Minute OR : 9:30-10:00 AM EST (Extended morning range)
1-Hour OR : 9:30-10:30 AM EST (Full morning session)
Overnight OR : 6:00-7:00 PM EST (After-hours reference)
Complete Visual Customization:
Individual Toggle Controls : Turn each OR period on/off independently
Custom Colors : Set unique colors for each timeframe's lines and fills
Adjustable Line Thickness : Choose from 1-5 pixel width
Label Styles : "5Min OR-High" or simple "OR-High" format
Label Background Options : Choose colored backgrounds or clean text-only labels
Label Sizes : Tiny, Small, Normal, or Large text
Smart Display Options:
OR-High, OR-Mid, OR-Low : Each level clearly labeled with price tooltips
Midpoint Toggle : Show/hide dashed midpoint line
Fill Toggle : Enable/disable shaded area between levels
Historical Ranges : Show/hide previous session ORs
Line Extension : Set projection distance (0-1440 minutes, default 5 min)
Color-Coded Labels : Semi-transparent backgrounds match each OR theme (optional)
🎨 DEFAULT COLOR SCHEME
Active by Default:
5-Min OR : Red lines (no fill)
1-Hour OR : Sky blue lines (no fill)
Overnight OR : Brown lines with shaded fill
Disabled by Default:
15-Min OR (Purple) - enable when needed
30-Min OR (Orange) - enable when needed
📈 HOW TO USE
Setup:
Add to any intraday timeframe (1min, 5min recommended)
Enable your preferred OR periods
Customize colors for visual distinction
Set line extension (default 5 minutes)
Trading Applications:
Breakout Trading : Enter when price breaks OR-High/Low
Range Trading : Trade between levels during consolidation
Support/Resistance : Use multiple ORs as confluence zones
Risk Management : Set stops beyond OR levels
Session Analysis : Compare OR widths to gauge volatility
Advanced Techniques:
Watch for false breakouts returning inside range
Combine with volume for confirmation
Use overnight OR for pre-market sentiment
Layer multiple ORs for high-probability zones
⚙️ CUSTOMIZATION OPTIONS
Display Settings:
Show/hide historical ranges, midpoint lines, and fills
Line thickness: 1-5 pixels (default: 1)
Label size: Tiny to Large
Label style: With period prefix or generic
Label background: With background or no background
Extend lines: 0-1440 minutes (default: 5)
Per-Period Controls:
Each OR has independent settings for enable/disable, line color, fill color, and transparency.
💡 PRO TIPS
Start with 5-min and 1-hour ORs only
Use distinct colors for each timeframe
Keep historical ranges OFF for cleaner charts
Adjust extension: 5-10 min for active trading, 60+ for planning
Combine OR breakouts with volume spikes
Use overnight OR to understand after-hours action
Wait for clean breakouts with volume confirmation
🔧 TECHNICAL SPECS
Timezone : America/New_York (EST/EDT)
Compatible Timeframes : Any intraday under 1 day
Optimal Timeframes : 1-minute, 5-minute charts
Real-Time Updates : Dynamic line extension with new bars
📌 BEST PRACTICES
Use on liquid instruments (ES, NQ, SPY, QQQ)
Wait for volume-confirmed breakouts
Place stops beyond OR levels you're trading
Size positions based on OR width
Respect 1-hour OR as major support/resistance
🎯 IDEAL FOR
Day traders, scalpers, futures traders (ES/NQ/YM), equity traders (SPY/QQQ), and anyone using Opening Range methodology in their trading strategy.
Note: For educational purposes. Practice proper risk management and combine with your complete trading strategy.

Market Range OracleMarket Range Oracle is an advanced volatility-adaptive projection tool designed to help traders anticipate future price behaviour, identify probabilistic ranges, and understand how markets historically expand or contract from the price open.
📊 By analysing historical bar-to-bar performance, ATR-filtered volatility, and fast-RSI momentum, the indicator creates a complete forward-looking range map for any timeframe.
📈 What Market Range Oracle Does
Calculates Expected Price Movement From the Open for any selected timeframe, the indicator measures thousands of past bars (or your chosen lookback) to determine:
Average % Gain
Average % Loss
Max Adjusted Gain (ATR-filtered projected peaks)
Max Adjusted Loss (ATR-filtered projected troughs)
Rate of green and red candle closes in the selected lookback period
Projected price levels for all of the above
These projections are then plotted directly on the chart or drawn as offset lines with detailed labels, all the colours, text size, show/hide elements are customisable from the indicator dashboard.
🧠 How does work and how to use it
The indicator computes projections across three independent timeframes:
Plots Timeframe — where visual projection bands are drawn
Lines & Labels Timeframe — creates separate-TF projection levels & labels
Forecast Timeframe — allows forward bar forecasting for the next candle
Forecast projections (when enabled) can be used to show the next future candle of any timeframe.
Example 1: Plots Timeframe set to current timeframe and the Forecast Timeframe option to the same timeframe, this will show an adaptive range moving with the price for current timeframe.
Example 2 : Find the potential Future range long term, the current timeframe is an weekly and we set the Forecast Timeframe to 2 weeks, as want to see potential top and bottom range for the next 2 weeks
Example 3 : Scalping with Market Range Oracle - Set the Bands to current timeframe and set the Projections lines and labels to a higher timeframe (in our case 15 minutes and a 4h)
⚡ Momentum Overlay (Fast RSI Hybrid)
A fast-RSI (RSI-2) colour code system measures short-term momentum and the top and bottom of the ranges display momentum.
Also the middle RSI 50 value equivalent EMA shows directional bias visualized with colour-shifting dashed line on the chart to help traders with clear trend direction.
🔔 Built-In Alert System
Alerts trigger on Price-Level Events and on momentum shift:
Price reaches projected Avg Loss
Price reaches projected Max Gain
Price reaches projected Max Loss
Midpoint Cross Events
Price crosses above mid-range
Price crosses below mid-range
Fast RSI bullish momentum
Fast RSI bearish momentum
Fast RSI strong bullish spike
Fast RSI strong bearish spike
🧩 Market Range Oracle is ideal for scalping, day-trading, swing trading, and position traders.
💬 Notes
Market Range Oracle does not predict future price — it projects statistically probable ranges based on historical behaviour and volatility. It is a decision-support tool to help traders navigate expected expansion from the open.

Flout Ranges + STDVs [bilal]# Flout Ranges + STDVs
## What It Does
Automatically draws FLOUT, CBDR, and ASIA session ranges with standard deviation levels and highlight zones. Perfect for ICT-style trading and session-based strategies.
## Main Features
**📊 Session Ranges**
- FLOUT, CBDR, and ASIA ranges drawn automatically
- Works for both Indices and Forex (just toggle Forex Mode)
- Customizable colors and labels for each range
**📈 Standard Deviation Levels**
- Shows key STDV levels from your ranges
- FLOUT: -6 to +6 from midpoint
- CBDR/ASIA: 0 to 7 from range low
- Helps identify expansion targets and reversal zones
**🎯 Highlight Zones**
- Zone 1 (default 3.5-4.0 STDV): Common reversal area
- Zone 2 (default 5.5-6.0 STDV): Extended targets
- Shaded boxes make them easy to spot
- Automatically extends forward into London session
**📐 Smart Trendlines**
- Connects the open prices at key times
- Switches to X-pattern on trending FLOUT days
- Helps identify directional bias
## Quick Setup
1. Add indicator to your 1-5 minute chart
2. Toggle **Forex Mode** if trading forex (otherwise leave off for indices)
3. Turn on STDV lines for the ranges you want to see
4. Adjust highlight zones if needed (defaults work great)
## Why Use This?
- **Save Time**: No more manual drawing of ranges and levels
- **Stay Consistent**: Same levels calculated every session
- **Better Entries**: Use STDV zones for high-probability setups
- **Cleaner Charts**: Toggle what you need, hide what you don't
## Pro Tips
💡 Watch for reactions at 3.5-4.0 STDV zones - these are prime reversal areas
💡 Combine multiple ranges for allignements setups
---
*All times in New York timezone. Best used on 1-5 minute charts.*

ICT Sessions Ranges [SwissAlgo]ICT Session Ranges - ICT Liquidity Zones & Market Structure
OVERVIEW
This indicator identifies and visualizes key intraday trading sessions and liquidity zones based on Inner Circle Trader (ICT) methodology (AM, NY Lunch Raid, PM Session, London Raid). It tracks 'higher high' and 'lower low' price levels during specific time periods that may represent areas where market participants have placed orders (liquidity).
PURPOSE
The indicator helps traders observe:
Session-based price ranges during different market hours
Opening range gaps between market close and next day's open
Potential areas where liquidity may be concentrated and trigger price action
SESSIONS TRACKED
1. London Session (02:00-05:00 ET): Tracks price range during early London trading hours
2. AM Session (09:30-12:00 ET): Tracks price range during the morning New York session
3. NY Lunch Session (12:00-13:30 ET): Tracks price range during typical low-volume lunch period
4. PM Session (13:30-16:00 ET): Tracks price range during the afternoon New York session
CALCULATIONS
Session High/Low: The highest high and lowest low recorded during each active session period
Opening Range Gap: Calculated as the difference between the previous day's 16:00 close and the current day's 09:30 open
Gap Mitigation: A gap is considered mitigated when the price reaches 50% of the gap range
All times are based on America/New_York timezone (ET)
BACKGROUND INDICATORS
NY Trading Hours (09:30-16:00 ET): Optional gray background overlay
Asian Session (20:00-23:59 ET): Optional purple background overlay
VISUAL ELEMENTS
Horizontal lines mark session highs and lows
Subtle background boxes highlight each session range
Labels identify each session type
Orange shaded boxes indicate unmitigated opening range gaps
Dotted line at 50% gap level shows mitigation threshold
FEATURES
Toggle visibility for each session independently
Customizable colors for each session type
Automatic removal of mitigated gaps
All drawing objects use transparent backgrounds for chart clarity
ICT CONCEPTS
This tool relates to concepts discussed by Inner Circle Trader regarding liquidity pools, session-based analysis, and gap theory. The indicator assumes that session highs and lows may represent areas where liquidity is concentrated, and that opening range gaps may attract price until mitigated.
USAGE NOTES
Best used on intraday timeframes (1-15 minute charts)
All sessions are calculated based on actual price movement during specified time periods
Historical session data is preserved as new sessions develop
Gap detection only triggers at 09:30 ET market open
DISCLAIMER
This indicator is for educational and informational purposes only. It displays historical price levels and time-based calculations. Past performance of price levels is not indicative of future results. The identification of "liquidity zones" is a theoretical concept and does not guarantee that orders exist at these levels or that prices will react to them. Trading involves substantial risk of loss. Users should conduct their own analysis and risk assessment before making any trading decisions.
TIME ZONE
Set your timezone to: America/New_York (UTC-5)

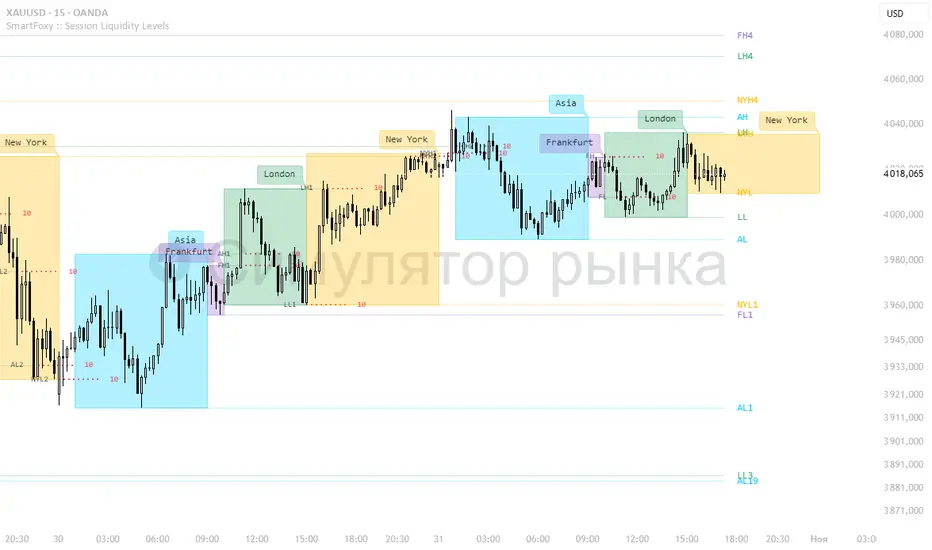
Killzone Session High/Low Levels [SmartFoxy]Killzone Session High/Low Levels
The Killzone Session High/Low Levels indicator by SmartFoxy provides a complete intraday framework for understanding session-based liquidity, market structure rotation, and breakout behavior across global trading sessions.
It automatically plots the High/Low ranges for each selected session, highlights session killzones, and tracks breakout events with optional alerts.
This tool is designed for traders who rely on session dynamics (Asia, Frankfurt, London, New York) to identify liquidity targets, sweep zones, key ranges, and continuation/reversal opportunities.
________________________________________
How It Works
The indicator detects the active trading sessions for each day and builds structural High/Low ranges for them:
• Asia Session Range (High/Low);
• Frankfurt Session Range;
• London Session Range;
• New York Session Range;
• Optional custom session (NY Open, or any killzone).
For each session, the script can display:
• Session box or column;
• High/Low levels;
• Labels for every range (H/L);
• True session boundaries using user-defined timezone;
• Auto-extended levels up to the latest candle;
• Break levels after a breakout;
• Conditional removal or recoloring after a level is breached.
This gives traders a clean visual map of session liquidity and how price interacts with it throughout the day.
________________________________________
Key Features
1. Multiple Global Sessions •➤ Asia, Frankfurt, London, New York, plus one custom session for advanced killzone mapping.
2. Session High/Low Liquidity Levels •➤ Automatic plotting of every session’s High and Low, with optional labels and price markers.
3. Session Boxes or Columns •➤ Two display modes allow traders to visualize the session either as a filled box or a clear vertical column.
4. Breakout Logic & Temporary Levels .
When price breaks a session High/Low:
• Levels can be extended for a selected number of bars
• Or removed instantly after a breakout
• Or recolored to highlight the sweep event
This enables clean identification of liquidity grabs, breakouts, and continuation setups.
5. Alerts for Session Breakouts .
Set alerts when price breaks:
• Any session level
• Only levels formed on the current day
Perfect for traders who want real-time notifications of sweeps or key structure breaks.
6. Full Customization
You can configure:
• Session times;
• Timezone;
• Colors;
• Labels;
• Line styles and widths;
• Breakout behavior;
• Killzone range handling.
Everything is adjustable to match any trading style.
________________________________________
How to Use
1. Enable the sessions you want to track •➤ Asia, Frankfurt, London, New York, or custom.
2. Choose display mode
Box mode for visual range blocks;
Column mode for clean vertical alignment.
3. Enable High/Low Levels .
These act as liquidity magnets and key rejection zones.
4. Turn on Breakout Levels (optional)
Useful for spotting sweeps and continuation setups.
5. Turn on Alerts if you want notifications when price breaks levels.
6. Use session levels as liquidity reference points .
They work exceptionally well with smart money concepts (SMC), ICT, and intraday structure analysis.
________________________________________
Why This Indicator Is Useful
Shows exactly where liquidity is placed each session;
Highlights market structure transitions as sessions hand over control;
Helps identify stop hunts, sweeps, reversals, and continuation patterns;
Provides real-time alerts for structural breaks;
Organizes the chart and reduces noise;
Works with any intraday timeframe and any market.
This makes it valuable for scalpers, day traders, and SMC/ICT-style analysts.
________________________________________
Summary
Killzone Session High/Low Levels delivers a complete, highly customizable intraday mapping system based on global trading sessions.
It clarifies the session structure, reveals liquidity targets, and empowers traders to make confident trading decisions using clean, objective market data.
Trend Heat Meter by JaeheePurpose
A compact, overlay gauge that shows where the current close sits within the last 50 bars’ high-low range. It converts price position into a 0–100% “heat” scale and renders a vertical gradient from Frozen (low end) to Overheated (high end).
How it works
• Looks back 50 bars to get highest(high, 50) and lowest(low, 50).
• Normalizes the current close into a percentile: (close − low) / (high − low) * 100.
• Draws a vertical cold→hot bar at the right side of the chart, with a pointer and a fixed-width percentage readout (two decimals) to avoid jitter.
• Labels the extremes as Overheated (top) and Frozen (bottom).
• The script is an overlay and does not modify candles or generate orders.
What makes it different
• Pure position metric: No EMA smoothing or oscillation math. It’s a direct percentile of price inside a rolling range, so interpretation is immediate.
• Jitter-free readout: Fixed-width numeric formatting keeps the value visually stable as price ticks.
• High signal legibility: A single, color-coded “thermometer” avoids multi-plot clutter and works well on any chart style.
• Non-repainting logic: Uses only in-bar values and a rolling 50-bar window; no future bars are referenced.
Inputs
• Use Black Text (White→Black): Switches label/pointer text from white to black for dark or light chart themes.
(Length and visual rows are internally set to 50 and 21 for a consistent footprint.)
Practical use
Trend context
• >70% = price is trading near the upper segment of its recent range → bullish pressure / “hot.”
• <30% = price is trading near the lower segment of its recent range → bearish pressure / “cold.”
Confluence
• Combine with your entry method (structure breaks, OB/FVG, KZ sessions, etc.).
– Prefer long setups when the meter stays >50% and rising.
– Prefer short setups when the meter stays <50% and falling.
Risk management
• Treat extreme reads (>85% or <15%) as potential exhaustion zones inside ranges; wait for confirmation before fading.
Timeframes & markets
• Works on any timeframe and symbol. Large-cap, liquid instruments typically provide the cleanest read.
Notes and limitations
• The meter shows relative position, not momentum or volatility. Pair it with your preferred filters for full trade qualification.
• It does not produce buy/sell signals, alerts, or TP/SL levels.
• Visual table draws only on the last bar for efficiency.
Compatibility
• Pine Script® v6
• Overlay: true
Disclaimer
This script is for educational purposes only and is not financial advice. Trading involves risk. Test on a demo and use proper risk management.

NQ 65 Point Futures Session 30 Second Opening RangeNQ 65 Point Futures Session Open Range Pro
Overview
This Pine Script indicator is designed specifically for NASDAQ-100 E-mini (NQ) futures traders who utilize opening range breakout strategies across multiple global trading sessions. The indicator provides comprehensive session-based opening range analysis with advanced 65-point interval projections.
Key Features
Multi-Session Opening Range Analysis
RTH (Regular Trading Hours): 8:30 AM CT - New York session opening range
Globex (Asian Session): 5:00 PM CT - Asian market session opening range
Europe Session: 2:00 AM CT - European market session opening range
Core Functionality
High/Low/Mid Lines: Displays opening range boundaries and midpoint for each session
Customizable Colors: Full color customization for each session's lines
Price Labels: Optional price display on all levels with session identification
Statistics Table: Real-time table showing high, low, and range width for active sessions
Advanced 65-Point Interval System
RTH-Specific Feature: Plots 5 levels above and below RTH opening range at 65-point intervals
Projection Levels: +65, +130, +195, +260, +325 above RTH high and corresponding negative levels below RTH low
Customizable Labels: Toggle price display and session names on interval lines
Color-Coded: Separate colors for upside and downside projections
Enhanced Trading Tools
Breakout Detection: Automatic identification of opening range breakouts with visual signals
Alert System: Built-in alerts for all session breakouts (up and down)
Range Boxes: Optional visual boxes highlighting opening ranges
Multiple Timeframe Support: Works across various chart timeframes
Display Options
Label Customization: Multiple size options (Tiny, Small, Normal, Large)
Session Toggle: Individual on/off controls for each session
Transparency Controls: Adjustable transparency for range boxes
Professional Styling: Clean, professional appearance suitable for live trading
Trading Applications
This indicator is particularly valuable for:
Gap Trading: Identifying key levels after overnight gaps
Breakout Trading: Clear visual confirmation of range breakouts
Support/Resistance: Using opening ranges as dynamic S/R levels
Session Transition: Understanding how price behaves across global sessions
Risk Management: Using 65-point intervals for position sizing and target setting
Technical Specifications
Version: Pine Script v5
Overlay: True (plots directly on price chart)
Max Lines: 500 (accommodates extensive level plotting)
Timezone: America/Chicago (Central Time)
Data Frequency: 30-second precision for opening range calculation
Usage Notes
Designed specifically for NQ futures but may work on other instruments
Best performance on intraday timeframes (1m, 5m, 15m, 30m)
Opening ranges calculated based on first 30 seconds of each session
All alerts are customizable through TradingView's alert system
Customization Options
The indicator offers extensive customization including:
Color schemes for each session
Label display preferences
Line transparency and thickness
Statistical table positioning
Alert message customization

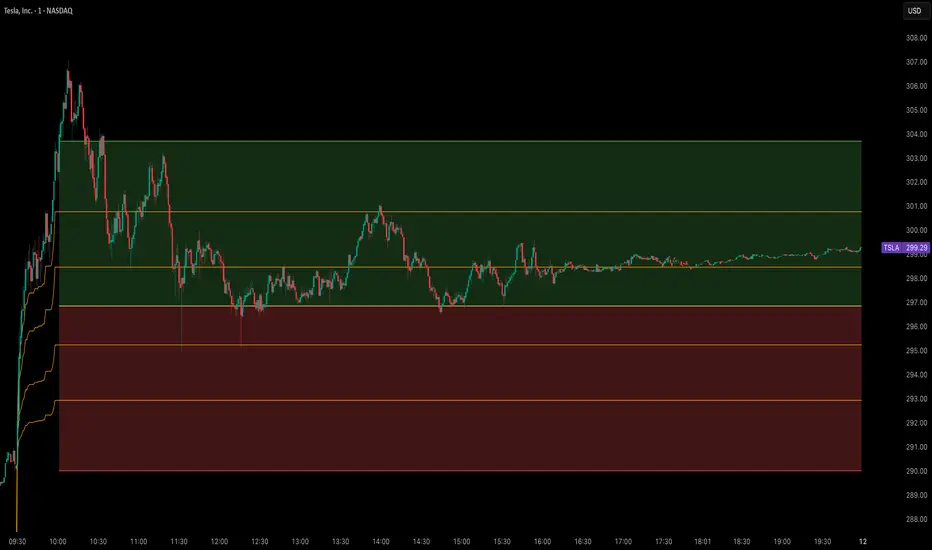
Options Betting Range - FixedOptions Betting Range
Options Betting Range is a powerful TradingView indicator designed to streamline options trading by visualizing high-probability price ranges for key symbols. With automated trendlines and clear labels, it empowers traders to make precise, data-driven decisions based on customizable prediction and execution dates.
## Key Features
Broad S&P 500 Coverage: Supports most S&P 500 stock symbols, excluding those with insufficient options volume for reliable data, alongside major ETFs and indices like SPY, IWM, QQQ, DIA, TLT, ^GSPC, ^IXIC, ^RUT, ^NDX, and ^SOX.
Automated Trendlines: Plots dashed and solid trendlines to mark high/low price boundaries, triggered only on specified prediction dates for clean, uncluttered charts.
Customizable Inputs: Configure prediction and execution dates to align with your trading strategy.
Clear Visuals: Color-coded labels (green for highs, purple for lows) display price ranges and percentage spreads for rapid decision-making.
Single-Execution Logic: Draws trendlines once per prediction date, ensuring chart clarity and efficiency.
## How It Works
Based on the latest daily open interest data, the indicator calculates swing ranges for different strike dates, drawing trendlines and labels to visualize potential price boundaries for options trading.
## Why Use It?
Streamlined Analysis: Automates range visualization, saving time and reducing manual charting.
Strategic Clarity: Objective price levels minimize emotional bias and enhance trade planning.
Versatile Application: Ideal for day traders, swing traders, and options strategists across multiple markets.
## Tips for Best Use
Regular Updates: To maintain the accuracy of options betting ranges, periodically update the indicator. On the view page, hover over the indicator name and click the blue whirlwind icon to complete the update.
## Get Started
Add Options Betting Range to your TradingView chart, select a supported symbol, and customize your prediction/execution dates. Leverage the visualized price ranges to execute precise options trading strategies with confidence.

ADR/ATR Ranges & DashboardADR/ATR Ranges & Dashboard
Description:
The ADR/ATR Ranges & Dashboard indicator is a comprehensive tool designed to visualize key market volatility levels and provide traders with a clear daily framework. This script combines Average Daily Range (ADR) and Average True Range (ATR) metrics across multiple timeframes to assist in defining realistic intraday price targets and stop levels.
Key Features:
ADR Levels (Upper/Lower) plotted automatically based on a customizable period.
Daily High/Low and Previous Day High/Low plotted for context and range awareness.
Custom Range High/Low: Define your own time range to track session-specific extremes.
Dashboard Panel summarizing ADR values, distances to key levels, and custom range data.
Multi-timeframe ATR Dashboard (M1, M5, M15, H1, H4, D1) for detailed volatility insight.
Fully customizable colors and line styles (via the Style tab).
Adjustable dashboard font size and position.
How ADR differs from ATR:
ADR calculates the average difference between daily highs and lows over a set number of days — showing how much price typically moves per day.
ATR measures the average range (including gaps) within a given timeframe — providing a more comprehensive view of volatility.
Ideal for:
Day traders, scalpers, and swing traders needing clear intraday structure.
Volatility-based trading strategies (range breakouts, mean reversion, etc.).
Identifying realistic take-profit and stop-loss zones based on historical price behavior.
Created by: Precious Life Dynamics

Opening Range Breakout Cloud Indicator by TenAMTraderOpening Range Breakout Cloud Indicator – by TenAMTrader
This indicator visually maps out the Opening Range of the trading day — the price high and low between a configurable start and end time (default: 9:30 AM–10:00 AM EST). It helps traders identify breakout levels, key intraday zones, and price behavior relative to the early range.
🔹 What It Shows:
Opening High, Low, and Midpoint lines for each day.
Clouds between the midpoint and high/low for visual clarity.
Optional Second Range (e.g., 9:30–9:45 AM) for more aggressive early signals.
Historical Ranges are preserved, allowing you to view previous days' levels on the chart.
Custom Alerts when price crosses the Opening High, Low, or Midpoint.
Full customization: colors, range times, and display toggles.
🔔 Use It For:
Spotting breakouts or rejections at key levels.
Finding early support/resistance zones.
Planning trades using intraday structure.
⚠️ Use this tool as part of a broader trading strategy. No indicator guarantees results — always trade at your own discretion.
ICT Dealing RangeICT Dealing Range
This indicator identifies and plots ICT (Inner Circle Trader) Dealing Ranges - key institutional areas where smart money accumulates or distributes positions before significant moves.
What is a Dealing Range?
A Dealing Range is a significant price area where institutional traders accumulate or distribute their positions. These ranges form through a specific sequence of price movements that indicate institutional order flow:
Bullish Dealing Range Sequence:
1. Initial High (H)
2. Initial Low (L)
3. Higher High (HH)
4. Lower Low (LL)
5. Break above HH (confirmation)
Bearish Dealing Range Sequence:
1. Initial Low (L)
2. Initial High (H)
3. Lower Low (LL)
4. Higher High (HH)
5. Break below LL (confirmation)
My Trading Strategy
Entry Methods:
1. Range Extreme Retests:
- After range formation, wait for price to return to either extreme
- Long entries at range bottom with stops below
- Short entries at range top with stops above
2. Mid-Line Strategy:
- Use the mid-line as a pivot point for reversals
- Long entries on mid-line bounce with stops below
- Short entries on mid-line rejection with stops above
Stop Loss Placement:
- When entering at extremes: Place stops beyond the mid
- When entering at mid-line: Place stops beyond the opposing extreme
- Always respect the structure's boundaries
Take Profit Targets:
- Minimum 2:1 Risk-Reward ratio
- For extreme entries: Target the opposite extreme
- For mid-line entries: Target the nearest extreme
Risk Management
- Never enter without a clear invalidation point
- Maintain minimum 2:1 RR ratio
- Consider market structure and higher timeframe context
Indicator Features
- Auto-detection of dealing range patterns
- Color-coded boxes (green for bullish, red for bearish)
- Optional mid-line display
- Customizable colors and styles
- Adjustable pivot lookback periods
Notes
This tool is based on ICT concepts but should be used in conjunction with other forms of analysis. The dealing range provides a framework for understanding institutional order flow, but proper risk management and market context are essential for successful trading.
Remember: The best trades often come from clean retests of these ranges after their initial formation. Patience in waiting for proper setups is key to successful implementation.

DMR Dynamic Market Range By ANTExplanation of the DMR Dynamic Market Range Script
a. What is This Script and How Is It Useful?
This Pine Script, named "DMR Dynamic Market Range by ANT," is designed for use on TradingView, focusing on dynamically assessing market conditions. It calculates key levels, specifically the high and low of the previous two days, to establish trading zones that assist traders in making informed decisions.
The script highlights:
Previous Day's High and Low : It captures the high and low prices from the previous two days to help set up trading ranges.
Trade Zones : It identifies whether the current price is in a 'tradeable' zone or 'non-tradeable' zone. The zones are determined based on the relationship between the current price, today's open price, and the calculated high and low levels.
Targets and Stop Losses : The script dynamically provides target and stop-loss levels based on user-defined input points, which can help manage risk effectively.
This script is beneficial for traders looking to enter (or avoid) trades based on defined price action criteria and can effectively streamline the analysis process in fast-moving markets.
Customize Input Parameters: (settings)
Adjust the target and stop-loss points based on your risk tolerance and trading style. The default values (30, 70, 100 for targets and 10 for stop-loss) may not suit every trader.
Experiment with different values to find what works best for your trading strategy.
b. How to Effectively Use This Script
The DMR script can be utilized across various trading instruments, including:
Indexes : Suitable for gauging market sentiment and overall trends; can assist in short-term trading strategies.
Options: Helps determine the likely movement of the underlying assets, providing insight into probable volatility and directional bias.
ETFs (Exchange-Traded Funds): Useful for trading diversified portfolios; traders can define entry and exit points relevant to the basket of stocks.
Stocks: Ideal for individual stock trading, as traders can analyze stock movements concerning broader market trends.
When utilizing this script, traders should:
Identify key trading levels before entering trades based on the calculated high and low ranges.
Use the dynamic targets and stop-loss levels to protect capital and maximize potential gains.
Continuously monitor the script's signals and adapt to ongoing market changes.
c. Best Time Frames for Different Instruments
The optimal time frames for using the DMR script can vary based on the trading instrument.
Here’s a summary in tabular format for clearer guidance:
Instrument Best Time Frames
Index 5-minute, 15-minute, 1-hour
Options 1-minute, 5-minute, 15-minute
ETF 5-minute, 15-minute, 1-hour
Stocks 5-minute, 15-minute, 1-hour, Daily
Indexes: Shorter time frames (5 to 15 minutes) can capture quick market movements, while 1-hour frames can provide a broader market overview.
Options Trading: Given the time sensitivity of options, using very short time frames (1-5 minutes) can be effective to seize rapid price movements before expiry.
ETFs: Similar to indices, shorter frames help in effectively tracking movements of the underlying assets.
Stocks: A mix of short (5-15 minutes) for day trading and daily charts for swing trading can provide balanced insights.
Conclusion
Utilizing the DMR Dynamic Market Range script can greatly enhance a trader's ability to analyze market conditions, identify opportunities, and manage risk effectively. By adapting the script through the different listed recommendations, traders can maximize their trading strategy’s effectiveness across various instruments.

CofeeShopCrypto CoffeeBreak RSI**This Indicator DOES NOT REPAINT**
For me the RSI who's been a very powerful tool but one of the things that's been missing from it time and time again is the ability to show true dynamic support and resistance that is generated by the movements of the RSI.
This version of the Relative Strength Index is designed to visualize and mark Support and Resistance conditions on the Relative Strength Index (RSI) itself, and leaving behind those known dynamic support and resistance (S/R) zones.
It also has the ability during live marks to show you whether the majority of momentum is to the bullish or bearish side and if there is a conflict between the current momentum and the support or resistance zone that you are inside of. In short it will create the zones during live market.
This means you don't have to wait to only look at previous values you can also make an assessment during live breakouts on current support and resistance levels as well as using previous support and resistance levels as markers for any limits in movement.
Inputs Tab:
Show Dynamic Zone Creator - Gives you a live action SR Generator on your chart at your current bars which extends a bit into the future for a better visual sense of activity.
The color of this area can be set manually or you can let the script color this area automatically.
This Generator helps to plot Support and Resistance Zones on your chart.
If no zone is triggered then it will move on.
If a zone is triggered, it will change to the appropriate color and leave the zone behind as the new candles form.
Show Dynamic Zone Mid Level - This is just a midline of the Zone Creator to get an earlier visualization of what's happening inside the zone when it is very large.
I use this midline as a breakpoint when price and RSI values come back to this level and both break it. If only ONE breaks the level, I do not take it as a confirmation.
Extend RSI support and resistance boxes into the future - this is strictly up to the user which value you set. It will simply extend the zones that were left behind into the future as many bars as you choose. Depending on the chart or asset that you trade and how much volatility there is at the time you should be able to determine a good length for these boxes.
How many bars reflect the dynamic S/R zone - raising this value can overlap more zones using more bars going backwards. This can intensify the color of the current zone being created. The lowest value you should use is 2. But the higher you make this value you will also be able to see previous zones created with more intensity. Raising this value above the RSI value can give you a very nice previous depletion of color on previous zones where you'll be able to watch them fade away and it will intensify the current ones being created.
Only show this many previous support and resistance zones - this is a way to limit the number of zones that are being left behind on your chart which could possibly slow down the activity of calculations and how your chart moves with more indicators on it. Technically you can show 400 to 500 previous zones on your chart but you don't really need to see that many in the past so set this to something that is relative to how far in history you need to reference SR levels.
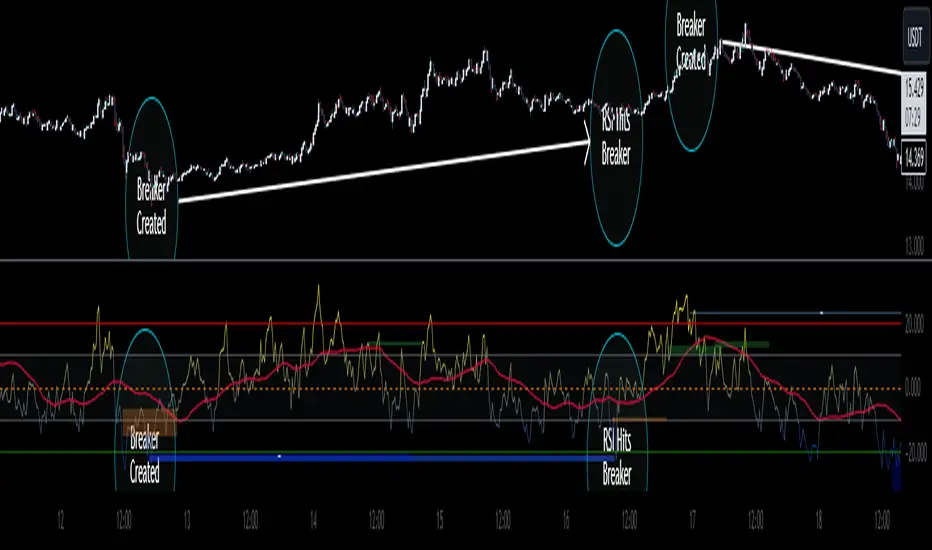
------------- Lets talk about how to take trades and see false breakouts. -------------
Support Created, Not broken, False Breakout
In the image below you can see how the Dynamic Zone Generator left behind a Support Level however the RSI was unable to break above it.
This creates a price swing on the chart.
The RSI later comes back to this level, however while price breaks this level, the RSI does not.
This confirms that it is a false breakout.
------------------------------------------------------------------------------------------
Now lets take a look at what a confirmed breakout is for a short along with a Continuation of short move. This is quickly followed by a divergence.
In the image below you can see how the RSI was in its ranging area and broke below that range. In this case it would be be below -10. During this time it never created a support level or resistance level underneath it implicating that it has continuous movement.
You can see later that when it broke back inside of the range did not go long instead there was a red resistance area created below the RSI. The RSI then again broke below -10 and it broke through this resistance area below it indicating another quick short entry. This is the setup for a quick continuation. Be careful of these setups as they are usually followed quickly by a divergence.
----------------------------------------------------------------------------------
The Dynamic Zone Creator takes its time to calculate. It cant predict the future so you'll have to just let it do its thing. Once the candles close and they confirm, you'll have the color, and zone size you need.
The Dynamic Zone Creator works against your currently OPEN candles.
It will give you a high and a low area of a zone which you can use in later points of the oscillator to determine if you have valid breakouts and or bounces of price and momentum.
When set to automatic coloring, its zone background and midline will automatically change their colors to match the momentum of the RSI and price.
If there is no support or resistance found, the Zone Creator will simply move onto the next candles in play.
If there IS support or resistance found, the Zone Creator will leave behind a phantom zone or Support or Resistance.
Keep in mind these zones left behind will turn into opposing Support or Resistance depending on if price and momentum break these areas simultaneously.
----------------------------Reason for closed source----------------------------
This indicator will be updated in the future to also produce trendlines, signals, and incorporate different methods of validate pivots and volume by calculations I have created of my own.
To avoid publishing this script more than once and give you all a direct access, without having to find a secondary or tertiary publication with the addons code is protected and will be updated here.
I have put several days into this particular script and will continue over the next few weeks to add in complimentary coding as this version of the script is really just stage one.
IMGBasic - HTF Structure / Order Blocks / Breakers - V1.0IMG Indicators Overview
The IMG Indicators are crafted as comprehensive educational tools for price action traders. They incorporate a variety of concepts including:
1. Multiple Timeframe Analysis
2. Order Blocks (OB)
3. Breakers (BRKR)
4. Fair Value Gaps (FVGs)
5. Overlaps of OB and FVG
6. Overlaps of BRKR and FVG
7. Analysis of Internal and External Liquidity
8. Strategies for Identifying Potential Entries, Stop-loss, and Target Levels
9. Risk Management and Position Sizing
These Price Action concepts can be applied to any market (Stocks / Options / Forex / Futures / Crypto ) and any timeframe.
Introduction to the IMG Basic Indicator
The IMG Basic Indicator serves as the foundational level within the IMG suite of indicators. Its core function is to acquaint traders with elementary price action concepts such as:
1. Higher Timeframe Market Structures through Multiple Timeframe Analysis
2. Higher Timeframe Order Blocks
3. Higher Timeframe Breakers
4. Breaks in Higher Timeframe Market Structure
Higher Timeframe Market Structure:
Market Structure can be defined using several techniques. The IMG indicators employ the Close through High/Low technique, which necessitates a candle close through a structural level to validate a structural break and designate a new range.
Example: H12 Market Structure visualisation on a H12 Chart with annotations:
By selecting a particular Market Structure timeframe in the settings, the indicator immediately illustrates both current and historical market structures for the chosen timeframe across all subordinate timeframes, subject to the limitations of your Tradingview subscription.
Example: H12 Market Structure visualisation on a H1 Chart with annotations:
Higher Timeframe Order Blocks (OB)
An Order Block represents the last candle of the opposite direction preceding a Market Structure Break. For instance, a bullish Order Block is identified as the final bearish candle leading to a bullish market structure break, and vice versa for bearish Order Blocks.
Example: H12 OB visualisation on a H12 Chart with annotations:
When activated, the indicator will highlight the Higher Timeframe Order Blocks responsible for a Market Structure Break on all subordinate timeframes relative to the chosen Market Structure Timeframe.
Note: if multiple OBs exist, the indicator will display the OB closest to the new range extreme
Example: H12 OB visualisation on a H1 Chart with annotations:
Higher Timeframe Breaker Blocks (BRKR)
A Breaker Block is identified as the most recent Order Block that has been breached by price, followed by an opposite Market Structure Break. For example, a bullish Breaker Block is the last bearish Order Block that price has passed through, followed by a bullish structural break, and the inverse is true for bearish Breakers.
Example: H12 Breaker visualisation on a H12 Chart with annotations:
Once enabled, the system will display Higher Timeframe Breaker Blocks after an opposite Market Structure Break is confirmed on all subordinate timeframes.
Example: H12 Breaker visualisation on a H1 Chart with annotations:
ALERTS: Higher Timeframe Market Structure Breaks (HTF MSBs)
The system provides notifications of confirmed Market Structure Breaks based on the selected Higher Timeframe Market Structure Timeframe. For instance, selecting a weekly structure will trigger an alert when price closes through a weekly structural level, and the same logic applies to other timeframes like D, H12, H4, H1 etc.
To enable alerts, right-click on the indicator and select “Add Alert on IMG ...”. You may customise the alert name as desired and then click 'Create' to finalise the alert setup.
General Note:
There is no system, indicator, algorithm, or strategy that can provide absolute certainty in predicting market movements. Use trading indicators as a tool to assist with trading decisions and manage your risk wisely.
For a complete user manual / knowledge base on the IMG Indicators, click on the User Manual link in the signature below
Stay safe and Happy Trading!

Previous Range Values, BasicOur P.R.V (Previous Range Values)(Basic) indicator is pretty simple; it plots the previous ranges of the high/low for the structured timeframes. This helps to quickly identify the primary Historical supports and resistances according to the Gregorian time structure. Additionally, a 'custom' field allows for a wider selection other than the scripts default, however the custom selection uses the pre-defined timeframes opposed to manual inputs since the conversion is in minutes and would limit/cap the available range. The plotted lines are designed to remain "out of the way" from the current candle.
To disable a range, simply change the opacity to 0%
Additional script features allow for fully adjustable settings and configurations:
• Adjustable; Range Colors
• Adjustable; Toggles

NixTrading Range MasterChart #2:
A potent countertrend indicator based on volatility. Works best in rangebound markets. Basically, it lets you know when price hits support or resistance of a range. Countertrend signals in general should be ignored ( filtered out ) during low-volatility trending phases. We use it as supportive signal for margin zones and volume spikes (NixVS). It has built-in alerts functionality.
Example of using NixRM:
1. Trade setup 1. After high-volume spikes (colored yellow bars), we get reverse signals from the indicator.
2. Trade setup 2. Price hits horizontal support/resistance zone and we get a signal from NixRM. This is our trade setup 2. Margin zones are best for identifying support and resistance, so consider using them.
3. Trade setup 3. See chart #2. When a major chart pattern is in its final stages and we get a signal from the indicator. In this case, BTC formed a massive Ending Diagonal with NixRM signal at the top.
4. Trade setup 4. As far as trending markets are concerned, the indicator should be used only for trading retracements, combined with moving averages. Example, chart #3:
Filter out:
1. Major breakouts (from price channels. Triangles, H&S, Diagonals etc.)
2. Trending markets.
_________________________________________________________________
#RU
Перспективный контртрендовый индикатор. Лучше всего работает в диапазонных фазах рынка. Дает сигнал, когда цена подходит к границе диапазона. При развитии трендовых движений большинство контртрендовых сигналов следует игнорировать. Есть возможность включить дополнительные сигналы, оповещающие о выходе цены за границы диапазона. Отличное дополнение к маржинальным зонам и Желтым барам (NixVS). Содержит функционал алертов.
Примеры использования:
1. Сетап 1. См. график #2. Сигнал индикатора после формирования Желтого бара NixVS.
2. Сетап 2. Сигнал во время тестирования зоны поддержки/сопротивления. Лучше всего работает с маржинальными зонами.
3. Сетап 3. Сигнал возникает на поздней стадии формирования графического паттерна.
4. Сетап 4. Может использоваться в трендовых фазах для входа в сделки на откатах (отскоках) в сочетании со скользящими средними.
Избегать:
1. Сигналы после пробоя важных поддержек/сопротивлений, в частности после классических паттернов.
2. Трендовые рынки. В особенности, слабо волатильные, то есть, однонаправленные без существенных откатов.
Наши индикаторы: ru.tradingview.com

888 BOT #alerts█ 888 BOT #alerts (open source)
This is an Expert Advisor 'EA' or Automated trading script for ‘longs’ and ‘shorts’, which uses only a Take Profit or, in the worst case, a Stop Loss to close the trade.
It's a much improved version of the previous ‘Repanocha’. It doesn`t use 'Trailing Stop' or 'security ()' functions (although using a security function doesn`t mean that the script repaints) and all signals are confirmed, therefore the script doesn`t repaint in alert mode and is accurate in backtest mode.
Apart from the previous indicators, some more and other functions have been added for Stop-Loss, re-entry and leverage.
It uses 8 indicators, (many of you already know what they are, but in case there is someone new), these are the following:
1. Jurik Moving Average
It's a moving average created by Mark Jurik for professionals which eliminates the 'lag' or delay of the signal. It's better than other moving averages like EMA , DEMA , AMA or T3.
There are two ways to decrease noise using JMA . Increasing the 'LENGTH' parameter will cause JMA to move more slowly and therefore reduce noise at the expense of adding 'lag'
The 'JMA LENGTH', 'PHASE' and 'POWER' parameters offer a way to select the optimal balance between 'lag' and over boost.
Green: Bullish , Red: Bearish .
2. Range filter
Created by Donovan Wall, its function is to filter or eliminate noise and to better determine the price trend in the short term.
First, a uniform average price range 'SAMPLING PERIOD' is calculated for the filter base and multiplied by a specific quantity 'RANGE MULTIPLIER'.
The filter is then calculated by adjusting price movements that do not exceed the specified range.
Finally, the target ranges are plotted to show the prices that will trigger the filter movement.
Green: Bullish , Red: Bearish .
3. Average Directional Index ( ADX Classic) and ( ADX Masanakamura)
It's an indicator designed by Welles Wilder to measure the strength and direction of the market trend. The price movement is strong when the ADX has a positive slope and is above a certain minimum level 'ADX THRESHOLD' and for a given period 'ADX LENGTH'.
The green color of the bars indicates that the trend is bullish and that the ADX is above the level established by the threshold.
The red color of the bars indicates that the trend is down and that the ADX is above the threshold level.
The orange color of the bars indicates that the price is not strong and will surely lateralize.
You can choose between the classic option and the one created by a certain 'Masanakamura'. The main difference between the two is that in the first it uses RMA () and in the second SMA () in its calculation.
4. Parabolic SAR
This indicator, also created by Welles Wilder, places points that help define a trend. The Parabolic SAR can follow the price above or below, the peculiarity that it offers is that when the price touches the indicator, it jumps to the other side of the price (if the Parabolic SAR was below the price it jumps up and vice versa) to a distance predetermined by the indicator. At this time the indicator continues to follow the price, reducing the distance with each candle until it is finally touched again by the price and the process starts again. This procedure explains the name of the indicator: the Parabolic SAR follows the price generating a characteristic parabolic shape, when the price touches it, stops and turns ( SAR is the acronym for 'stop and reverse'), giving rise to a new cycle. When the points are below the price, the trend is up, while the points above the price indicate a downward trend.
5. RSI with Volume
This indicator was created by LazyBear from the popular RSI .
The RSI is an oscillator-type indicator used in technical analysis and also created by Welles Wilder that shows the strength of the price by comparing individual movements up or down in successive closing prices.
LazyBear added a volume parameter that makes it more accurate to the market movement.
A good way to use RSI is by considering the 50 'RSI CENTER LINE' centerline. When the oscillator is above, the trend is bullish and when it is below, the trend is bearish .
6. Moving Average Convergence Divergence ( MACD ) and ( MAC-Z )
It was created by Gerald Appel. Subsequently, the histogram was added to anticipate the crossing of MA. Broadly speaking, we can say that the MACD is an oscillator consisting of two moving averages that rotate around the zero line. The MACD line is the difference between a short moving average 'MACD FAST MA LENGTH' and a long moving average 'MACD SLOW MA LENGTH'. It's an indicator that allows us to have a reference on the trend of the asset on which it is operating, thus generating market entry and exit signals.
We can talk about a bull market when the MACD histogram is above the zero line, along with the signal line, while we are talking about a bear market when the MACD histogram is below the zero line.
There is the option of using the MAC-Z indicator created by LazyBear, which according to its author is more effective, by using the parameter VWAP ( volume weighted average price ) 'Z-VWAP LENGTH' together with a standard deviation 'STDEV LENGTH' in its calculation.
7. Volume Condition
Volume indicates the number of participants in this war between bulls and bears, the more volume the more likely the price will move in favor of the trend. A low trading volume indicates a lower number of participants and interest in the instrument in question. Low volumes may reveal weakness behind a price movement.
With this condition, those signals whose volume is less than the volume SMA for a period 'SMA VOLUME LENGTH' multiplied by a factor 'VOLUME FACTOR' are filtered. In addition, it determines the leverage used, the more volume , the more participants, the more probability that the price will move in our favor, that is, we can use more leverage. The leverage in this script is determined by how many times the volume is above the SMA line.
The maximum leverage is 8.
8. Bollinger Bands
This indicator was created by John Bollinger and consists of three bands that are drawn superimposed on the price evolution graph.
The central band is a moving average, normally a simple moving average calculated with 20 periods is used. ('BB LENGTH' Number of periods of the moving average)
The upper band is calculated by adding the value of the simple moving average X times the standard deviation of the moving average. ('BB MULTIPLIER' Number of times the standard deviation of the moving average)
The lower band is calculated by subtracting the simple moving average X times the standard deviation of the moving average.
the band between the upper and lower bands contains, statistically, almost 90% of the possible price variations, which means that any movement of the price outside the bands has special relevance.
In practical terms, Bollinger bands behave as if they were an elastic band so that, if the price touches them, it has a high probability of bouncing.
Sometimes, after the entry order is filled, the price is returned to the opposite side. If price touch the Bollinger band in the same previous conditions, another order is filled in the same direction of the position to improve the average entry price, (% MINIMUM BETTER PRICE ': Minimum price for the re-entry to be executed and that is better than the price of the previous position in a given %) in this way we give the trade a chance that the Take Profit is executed before. The downside is that the position is doubled in size. 'ACTIVATE DIVIDE TP': Divide the size of the TP in half. More probability of the trade closing but less profit.
█ STOP LOSS and RISK MANAGEMENT.
A good risk management is what can make your equity go up or be liquidated.
The % risk is the percentage of our capital that we are willing to lose by operation. This is recommended to be between 1-5%.
% Risk: (% Stop Loss x % Equity per trade x Leverage) / 100
First the strategy is calculated with Stop Loss, then the risk per operation is determined and from there, the amount per operation is calculated and not vice versa.
In this script you can use a normal Stop Loss or one according to the ATR. Also activate the option to trigger it earlier if the risk percentage is reached. '% RISK ALLOWED' wich is calculated according with: '%EQUITY ON EACH ENTRY'. Only works with Stop Loss on 'NORMAL' or 'BOTH' mode.
'STOP LOSS CONFIRMED': The Stop Loss is only activated if the closing of the previous bar is in the loss limit condition. It's useful to prevent the SL from triggering when they do a ‘pump’ to sweep Stops and then return the price to the previous state.
█ ALERTS
There is an alert for each leverage, therefore a maximum of 8 alerts can be set for 'long' and 8 for 'short', plus an alert to close the trade with Take Profit or Stop Loss in market mode. You can also place Take Profit limit and Stop Loss limit orders a few seconds after filling the position entry order.
- 'MAXIMUM LEVERAGE': It is the maximum allowed multiplier of the % quantity entered on each entry for 1X according to the volume condition.
- 'ADVANCE ALERTS': There is always a time delay from when the alert is triggered until it reaches the exchange and can be between 1-15 seconds. With this parameter, you can advance the alert by the necessary seconds to activate it earlier. In this way it can be synchronized with the exchange so that the execution time of the entry order to the position coincides with the opening of the bar.
The settings are for Bitcoin at Binance Futures (BTC: USDTPERP) in 15 minutes.
For other pairs and other timeframes, the settings have to be adjusted again. And within a month, the settings will be different because we all know the market and the trend are changing.
