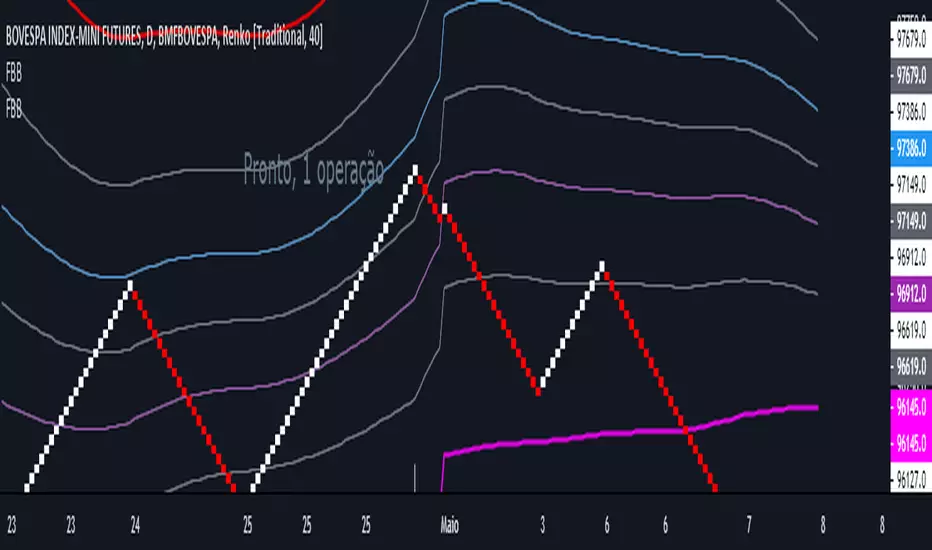
Estratégia DKtrader by Kristofer dos AnjosEstratégia Criada para o gráfico renko de 10R 15R 20R e o tempo gráfico de 5 10 e 15 minutos.
Поиск скриптов по запросу "renko"
Volume+ (RVOL By Time of Day)This script is an enhanced volume indicator.
It calculates relative volume (RVOL) based on the average volume at that time of day (rather than using a moving average).
For example, using this indicator you can see today’s volume during the first 5-minute candle of the market open compared to the previous day’s volume at the market open. Or you can see today’s volume at the market close during the last 15-minute candle compared to the average of the past 20 days of volume at the market close.
Due to the different quantity of candlesticks in a session between Stocks and Forex/Crypto, I separated those markets into separate settings, making this an all-in-one volume indicator that works on all markets.
Settings:
Stocks
If you set the lookback period to 1 on the 5-minute chart and look at the 9:30am candle for a stock, then the current volume bar will show you what today’s volume is compared to yesterday’s 9:30am 5-minute candle.
If you set the lookback period to 15, then the current volume bar will show you what today’s volume is compared to the average of the last 15 days of 9:30am 5-minute candles.
Max Lookback: 64 Sessions
Stocks
This setting is for traders who want to use this indicator on a timeframe lower than the 5-minute chart.
Due to limitations in how many historical bars PineScript can reference, referencing 1-minute and 3-minute bars requires a lot more historical data so I separated the two to allow the 5-minute+ timeframes to have a longer lookback period.
Max Lookback: 12 Sessions
Forex/Crypto
When you set the script to Forex/Crypto, it does the same thing for stocks but calculates based on a 24-hour period.
So if you set the lookback period to 1 on the 1-hour chart and look at the 11:00am candle for a currency pair, then the current volume bar will show you what today’s volume is compared to yesterday’s 11:00am 1-hour candle.
If you set the lookback period to 10, then the current volume bar will show you what today’s volume is compared to the average of the last 10 days of 11:00am 1-hour candles.
Max Lookback: 17 Sessions
What Doesn’t It Work On?
Because I had to manually calculate how many volume candles to look back per timeframe to get the previous session’s candle, I had to hard-code the math in this script.
That means that this indicator will only work on 1m, 3m, 5m, 15m, 30m, 45m, 1h, 2h, 3h, 4h, Daily and Weekly timeframes. If you try to use it on any other timeframe it will revert to a regular volume indicator.
Why Is It Useful?
Similar to volume profile by price, this gives you a volume profile by time in a way that the default volume indicator does not.
For example, you can use this to determine when a stock has a particularly strong opening drive, or when a currency pair has a weak fake-out leading up to the London open, or for general confirmation on trading signals with time-specific volume information to work with.
Colors
The purple line and the faint gray bar is the RVOL value.
The blue number is the percentage of the current volume bar relative to RVOL.
There are four different bar color settings:
Heatmap – Changes color to be brighter based on higher RVOL
Price – Changes color based on price action (like the default TradingView volume indicator)
Traffic – Changes color based on RVOL percentages (for fast visual cues)
Trigger – Changes color only when the specified alert conditions are met
Heatmap:
Traffic:
Trigger:
Price:
Heatmap:
Turns very bright green at 2.0 RVOL
Turns light green at 1.0 RVOL
Turns normal green at 0.75 RVOL
Turns medium green at 0.5 RVOL
Turns very dark green at 0.25 RVOL
Is gray otherwise.
Price:
Turns red if the price action candle closed bearish.
Turns green if the price action candle closed bullish.
Traffic:
Turns red if RVOL is between 1.0 and 1.5.
Turns orange if RVOL is between 1.5 and 2.0.
Turns dark green if RVOL is between 2.0 and 3.0.
Turns bright green if RVOL is above 3.0.
Is gray otherwise.
Trigger:
Turns teal if any of the given alert conditions in the user settings are met.
Alerts
Alerts are optional. You have to set them like any other indicator, by creating a new alert and selecting this indicator.
If you leave the "Alert At RVOL %" setting at 0, then alerts will only be triggered if the current candle exceeds the 1.0 (100%) RVOL level.
If you change the "Alert At RVOL %" setting then alerts will be triggered if the RVOL percentage (blue number) exceeds your given value. The blue number is a percentage of the average, so if it’s at 0.5, then it’s 50% of the average.
Notes
- This indicator only works with regular time bars. It will not work with range, tick, renko etc.
- This script has lookback limitations due to restrictions on how many historical bars PineScript can reference. The lookback limit varies based on the market type you choose. The more bars required for calculation the lower the lookback limit.
- If you use it on the Daily timeframe the lookback period will count as 1 week. If you use it on the Weekly timeframe the lookback period will count as 1 month. So a Lookback of 3 on the Daily would be 3 weeks of averages, a Lookback of 5 on the Weekly would be 5 months of averages (for that Day of Week or Week number).
- Big thanks to @tb12345 for the idea and for helping to field-testing the indicator!

[astropark - Premium] 5m Bitmex ScalperThis strategy is private for bitmex scalping on 5m - 15m.
News soon.
Thanks
-- astropark --

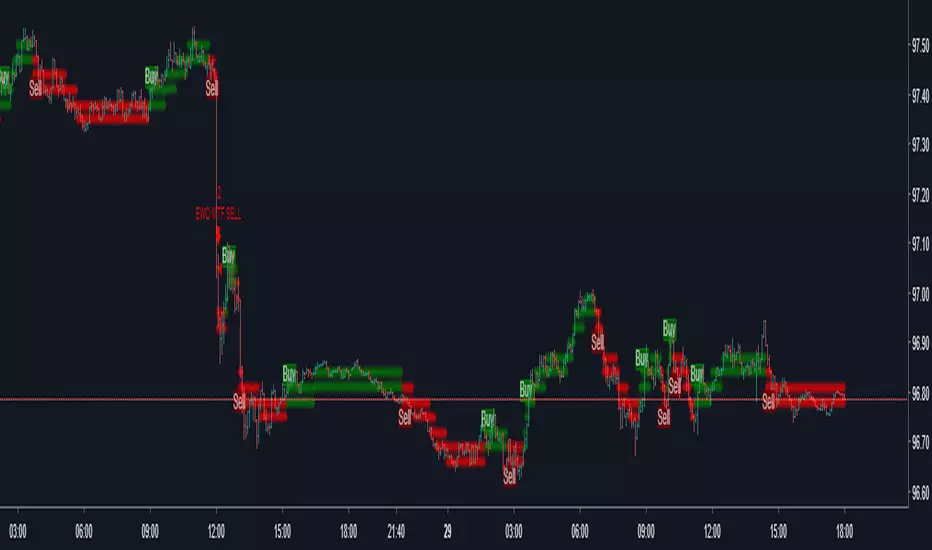
Intraday Color AlertThis indicator give good buy & sell signals especially short time period. Few changes made from Mr.Johnman's script. Go long when green color appear and go short when red color appear. Take a trade on candle High (long) & Low (short).
How to set SL & Target for this Indicator ?
Open the Renko Chart from your broker's trading chart (I'm using Zerodha from India). Find the Range from it, the has to be your SL & Target.
With Regard's
Kaliyamoorthi

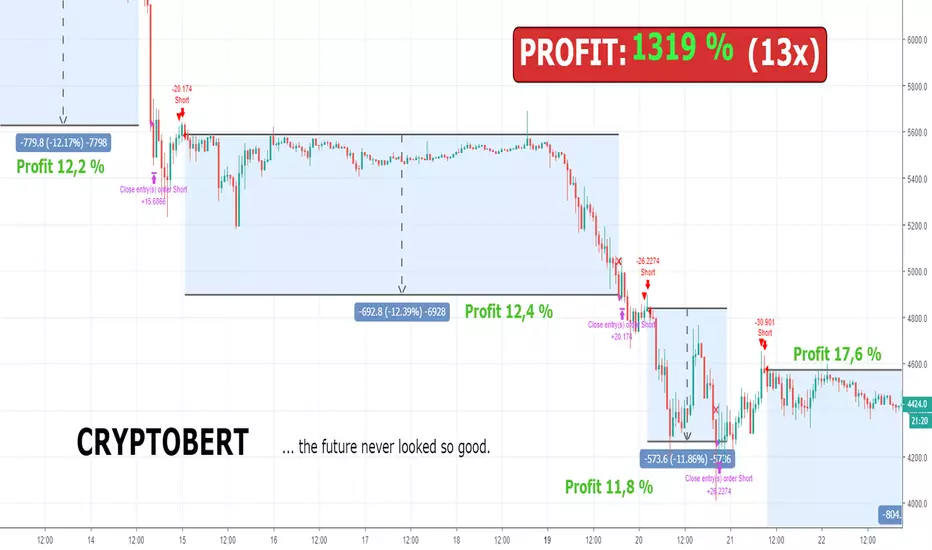
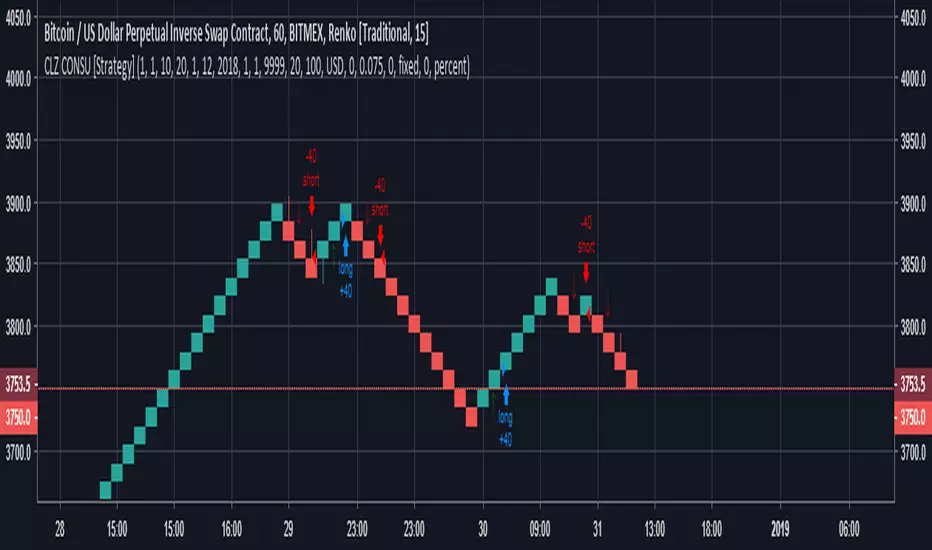
Bert LONG BTC Study (Alerts) - Profit 2018: 1319 % (no leverage)Bert LONG Term BTC study (BITMEX) - script for setting alerts and trading bots
This is a revolutionary strategy for bitcoin (XBT) trading. The strategy is perfectly configured for trading on the Bitmex exchange. No further configuration and setup is required.
The strategy itself recognizes a volatile period or whether the market is in downtrend, uptrend or sideways. Accordingly, it applies the appropriate orders to reach maximum profit.
The strategy can be handled manually, you can receive alerts (popup, email, sms) or can be fully automated by bot (works with: Autoview, Gunbot, Profitview, Jubot and others) without any manual intervention.
What is the minimum and maximum capital I can trade with?
You can trade with 0.0001BTC – 1000BTC. That is one of many advantages of using this strategy on XBT. There is enough liquidity to execute the order for the market price with a big investment amount.
What is the recommended setting?
Timeframe: 45m
Chart: Bitcoin/USD Dollar Perpetual Inverse Swap Contract (XBT)
Leverage: 2x
Orders: Long and Shorts
Why was this strategy created?
You have basically two option how to make money in crypto market. HODL (buy the coin and believe it will rise to the moon) and TRADING (only 3-5% traders are profitable, most of them are full time traders with 5+ years of experience in trading).
If you HODL btc in this year, you are -70 % this year
If you are TRADING, the results depend on how good you are (think about this, if you decide to be a heart surgeon, rocket star or NBA player, do you think you can be? Yes, you can but the chances are very small. The same probability you have that you will be in the 3-5% profitable traders 😊). It takes time, you need experience and still 96% all of you will never be a profitable traders!
If you use Bert BTC long term strategy, you are + 1319 % this year
How well the Bert BTC strategy performs?
Profit in 2018 was 1319 % / 13x (without leverage)
Profit in 2018 was 11 477 % / 115x (with leverage 2)
If you invested (with leverage 2) 1 000 USD you have now 114 766 USD
If you invested (with leverage 2) 10 000 USD you have now 1 147 660 USD
Detailed trades report for 2018 (you can calculate your own profit with specific investments and leverage) – download excel here
Notes:
You will hardly find better strategy on the market which achieves similar results with minimal risk and can operate in any market condition (downtrend, uptrend, sideways).
We guarantee the strategy does not repaint, and we use real candles (not heikin ashi or renko which does not reflect real prices).
We wish you to become financially independent and all your secret wishes to be fulfilled.
And in case if you still want to HODL or you want to be TRADING all the days watching to your monitors, consider to try our strategy at least with a minimum capital invested, you will see that you will not regret in long run. Be patient and the money will come to you!
For access to this strategy visit website: www.cryptobert.io
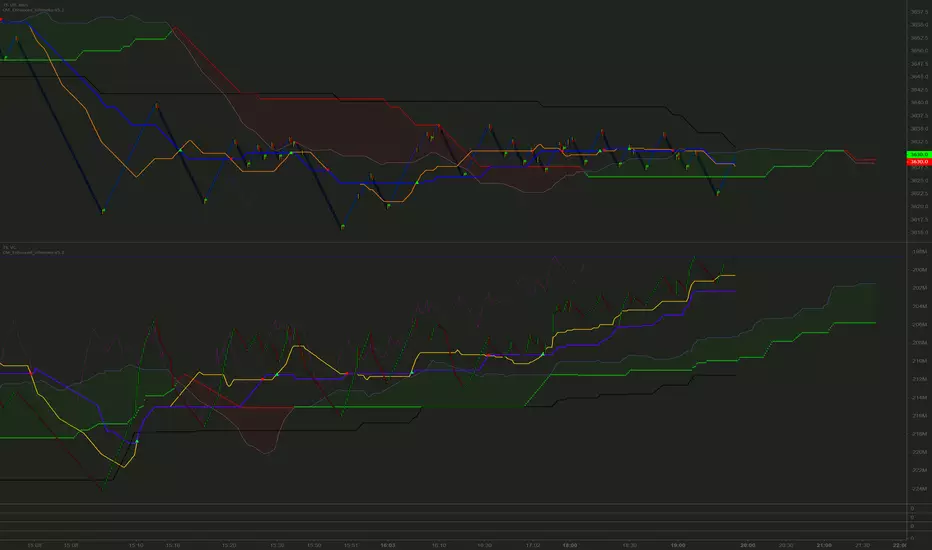
CM_Enhanced_Ichimoku Cloud-V5.3This is the same continuation of CM ichimoku you can find around, fixed little issues here and there, specially removed the check marks from input section (when you give access to styles no need for that), made the cloud color logic much simpler than what I found in 5.2 (seriously), changed the numbers to better fit my renko based system, and finally, the most important part, added an input section so now the users can choose ANY indicator/oscillator as input for ichi IF they want to (in the picture above you can see it working on my volume candle at the same time)
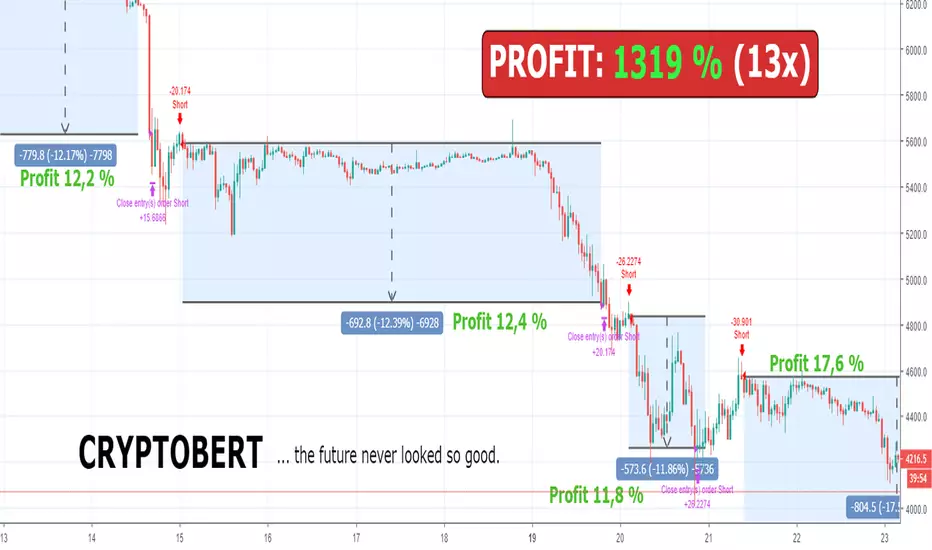
Bert LONG BTC Strategy - Profit 2018: 1319 % (without leverage)Bert LONG Term BTC Strategy (BITMEX)
This is a revolutionary strategy for bitcoin (XBT) trading. The strategy is perfectly configured for trading on the Bitmex exchange. No further configuration and setup is required.
The strategy itself recognizes a volatile period or whether the market is in downtrend, uptrend or sideways. Accordingly, it applies the appropriate orders to reach maximum profit.
The strategy can be handled manually, you can receive alerts (popup, email, sms) or can be fully automated by bot (works with: Autoview, Gunbot, Profitview, Jubot and others) without any manual intervention.
What is the minimum and maximum capital I can trade with?
You can trade with 0.0001BTC – 1000BTC. That is one of many advantages of using this strategy on XBT. There is enough liquidity to execute the order for the market price with a big investment amount.
What is the recommended setting?
Timeframe: 45m
Chart: Bitcoin/USD Dollar Perpetual Inverse Swap Contract (XBT)
Leverage: 2x
Orders: Long and Shorts
Why was this strategy created?
You have basically two option how to make money in crypto market. HODL (buy the coin and believe it will rise to the moon) and TRADING (only 3-5% traders are profitable, most of them are full time traders with 5+ years of experience in trading).
If you HODL btc in this year, you are -70 % this year
If you are TRADING, the results depend on how good you are (think about this, if you decide to be a heart surgeon, rocket star or NBA player, do you think you can be? Yes, you can but the chances are very small. The same probability you have that you will be in the 3-5% profitable traders 😊). It takes time, you need experience and still 96% all of you will never be a profitable traders!
If you use Bert BTC long term strategy, you are + 1319 % this year
How well the Bert BTC strategy performs?
Profit in 2018 was 1319 % / 13x (without leverage)
Profit in 2018 was 11 477 % / 115x (with leverage 2)
If you invested (with leverage 2) 1 000 USD you have now 114 766 USD
If you invested (with leverage 2) 10 000 USD you have now 1 147 660 USD
Detailed trades report for 2018 (you can calculate your own profit with specific investments and leverage) – download excel here
Notes:
You will hardly find better strategy on the market which achieves similar results with minimal risk and can operate in any market condition (downtrend, uptrend, sideways).
We guarantee the strategy does not repaint, and we use real candles (not heikin ashi or renko which does not reflect real prices).
We wish you to become financially independent and all your secret wishes to be fulfilled.
And in case if you still want to HODL or you want to be TRADING all the days watching to your monitors, consider to try our strategy at least with a minimum capital invested, you will see that you will not regret in long run. Be patient and the money will come to you!
For access to this strategy visit website: www.cryptobert.io
Colorize Consequential [Strategy]This script allows the user to find the best entry-point based on the trend using Renko with any time-frame.
With the ability to analyze in a date-range allow you to have a better view of the backtesting result.
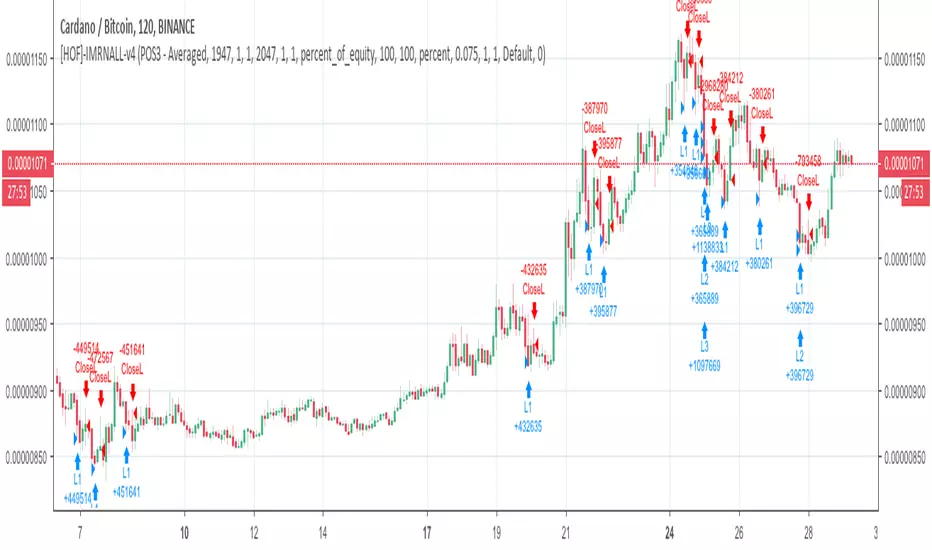
[HOF] IMRNALL - v4Strategy created for backtesting of rules described in WhatsApp group.
Source code will not be shared.
Script has very smooth equity curves, and works on all CRYPTO pairs on 1h and 2h timeframes. Takes no parameters except a minimal option on how to split orders based on various conditions.
NO REPAINTING!! NO RENKO CHARTS!!
Script works on the principle of mean-reversion, which is why you see High Win Rate. Also, PF is high since we are only entering the market on very favourable conditions and sell as soon as possible.
Using `POS1 - High Returns` results in very few trades with increased profits - around 2700% profit for this chart.
𝙇𝙄𝙌𝙐𝙄𝘿 𝙅𝘼𝘿𝙀 🇸🇨🇷🇮🇵🇹𝙇𝙄𝙌𝙐𝙄𝘿 𝙅𝘼𝘿𝙀 🇸🇨🇷🇮🇵🇹 v0.1
-Unique LJS breakout/reversal system
-Multi timeframe trend restricted trading
-Renko, ADX, MAs
-Risk Management, TP, SL
More to come!

Trader Set - Volume MomentumThis is a Momentum indicator but on "Volume" The formula is heavily tweaked version of TSI with chance of using different averaging types, the period numbers are fixed and user don't need to type anything for them!
Please don't contact me for getting access, these tools are available for my students only. These are part of my "methodology" that I teach. The English version of the website and learning material is under development and I will announce it under each related script when they are ready so that those who are interested can participate in the course.
Trader Set - Ergodic MomentumThis is a price momentum indicator that is based on Ergodic formula (TSI), but the formula is tweaked and different types of averaging is allowed. by changing the type of average calculation and some predefined values (totally different from what is suggested by now) we get a nasty indicator that can easily be used both for cycle observation side by side with momentum of the price itself !
Please don't contact me for getting access, these tools are available for my students only. These are part of my "methodology" that I teach. The English version of the website and learning material is under development and I will announce it under each related script when they are ready so that those who are interested can participate in the course.

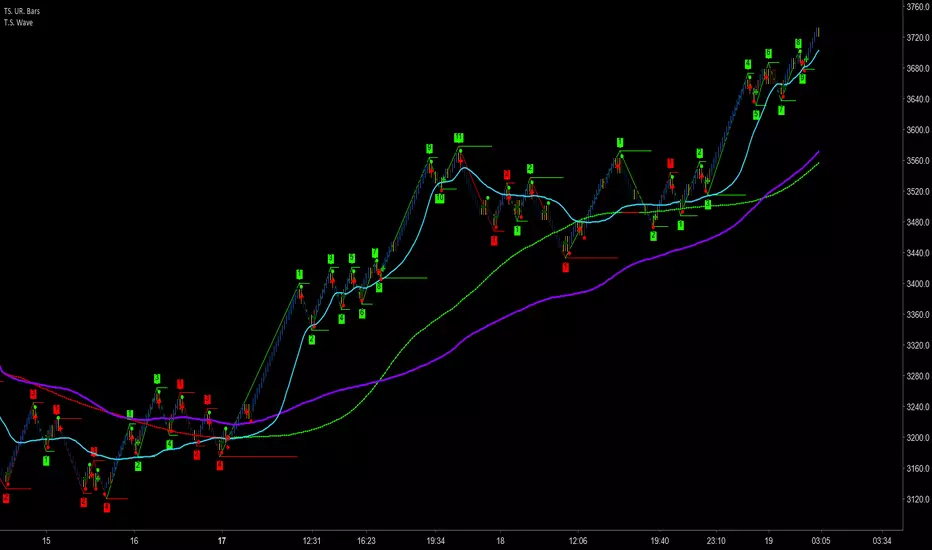
Trader Set - Wave CountThis is a wave counting tool for my methodology with little addition of drawing high low sections of wave reversal as local support / resistance.
Please don't contact me for getting access, these tools are only available for my students. The English version of website and learning materials are under development and soon they will be ready. I will announce it under every script related to my methodology so that you get informed and participate in the course if you want to.
Trader Set - Choppiness Index HelperThis is simply a helper indicator that sits on the chart to mimic the color code of the choppiness index oscillator. It can be used when you maximize the chart to better focus on the chart and other parts of the system.
Please don't ask for getting access, these indicators are available only for my students. The English website and the related learning materials are under development and soon they will be published and I will announce it in the comment section of every related indicator.

Trader Set - Choppiness IndexFinally made this work as desired, time to publish another super useful script in the tool set for my methodology. This indicator easily shows when the market is moving as a CHOPPY market so that traders either don't take position or be very cautious with their positions.

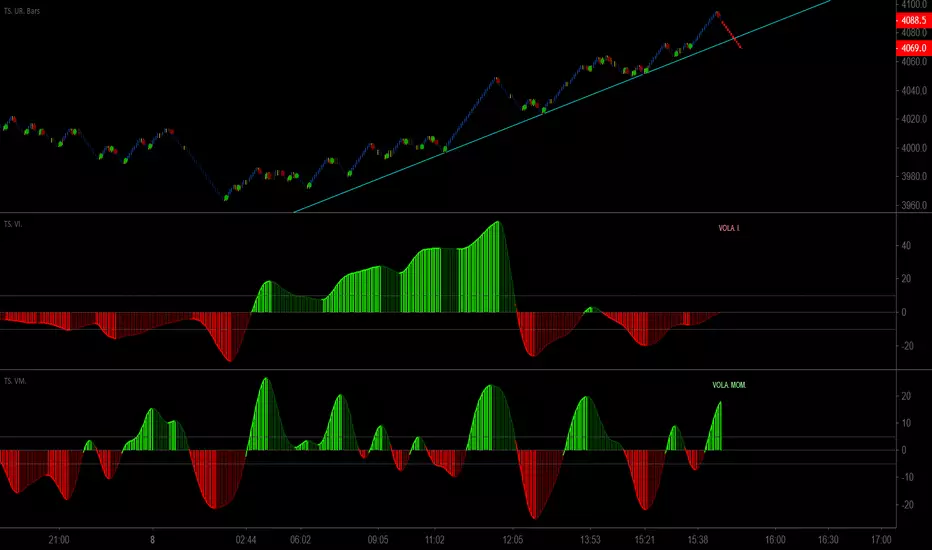
Trader Set - Volatility IndexOne of the last tools I forgot to publish till today. This is a Volatility Index Oscillator that uses a custom and original formula. This tool will be used hand in hand with's momentum one to easily identify the trend reversal points before it actually happens !
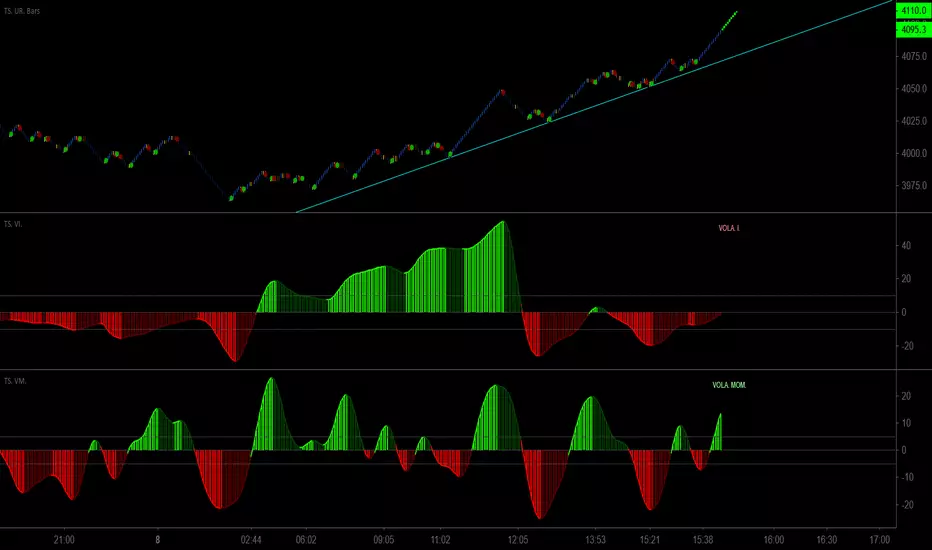
Trader Set - Volatility MomentumThis another one of the tools I missed publishing till today, this is a momentum indicator of volatility index (original formula), it will work hand in hand with volatility index oscillator (will publish right after this one) to easily identify divergences just before the market's direction change !
Paisa Wave SetupPaisa wave setup is made up of below ideas
Trend
****************************
Wave Tunnel
Raghee Wave
Trend pattern
Propulsion (TODO)
Support/ Resistance
****************************
Pivots -Renko
HL levels
Darvas box (TODO)
Oscillators (Individual scripts)
****************************
Slow Stoch
Awesome Oscillator
Trend is your friend.
Base of this script is Trend.
Look for trend on bigger timeframes like 1D, 4Hr & ride the trend with lower timeframes like 1Hr, 30min or 15min.
I have explained my setup many times on my tweet handle TraderPaisa and will continue to do so.
I will be adding more features and more explanation here later.

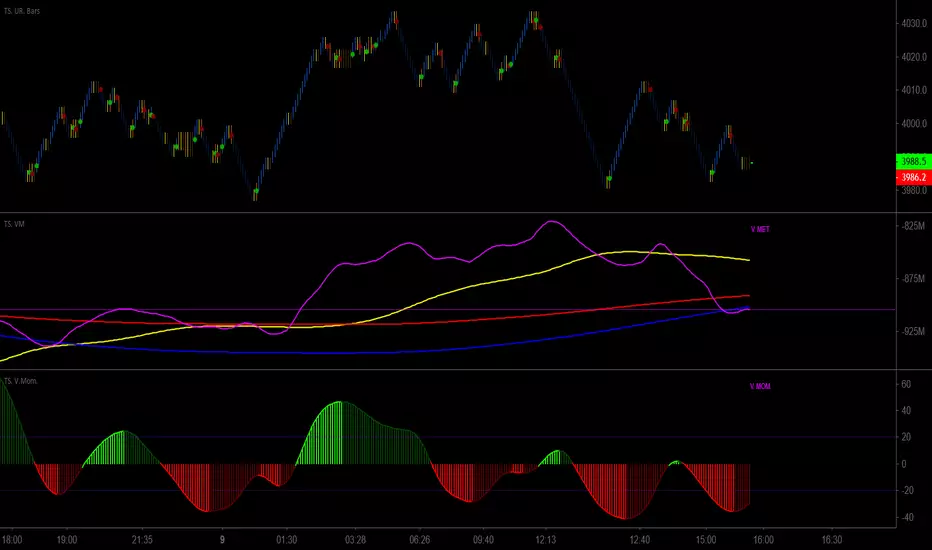
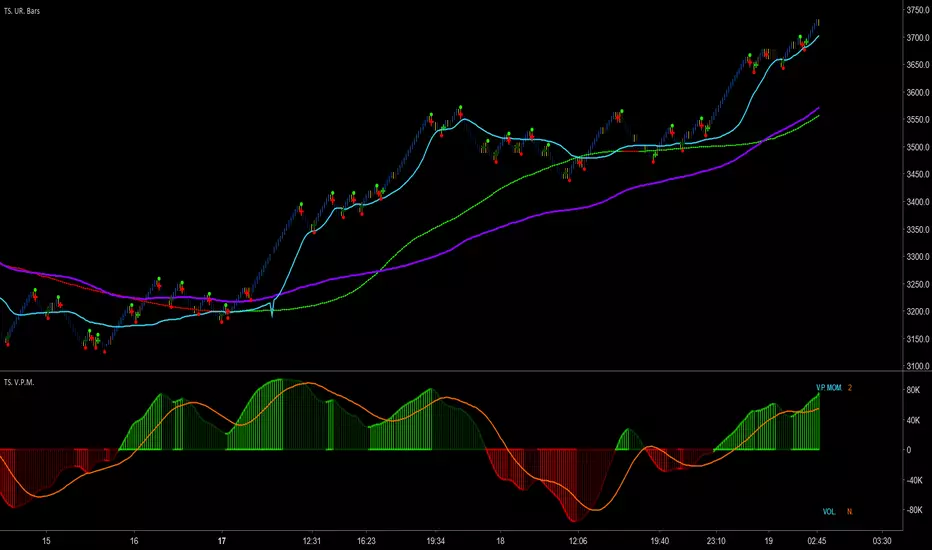
Trader Set - Volume Price MomentumThis is the latest tool in my methodology, a momentum indicator that combines PRICE and VOLUME.
There are two modes that you can use this : Normal, and Power Of Two. In the picture, the top one is set to normal, as you can see, it goes in the negative zone on each retrace, on the bottom one, we set it to the power of two mode, it still shows the same divergence in momentum vs price move but there is no negative section, instead, it only shows the POWER of the momentum without any direction indication.
Please don't contact me for getting access to these tools, they are only available to my students. Right now, the English version of the website and learning material is under development. The moment they are ready, I will announce it under every related script in the comment section.
Trader Set - Signal HelperThis is a signalling helper indicator that combines parts of signalling sections of my methodology. Using the provided two parts, it's easy to identify good signals from false ones.
This helper indicator is developed just to make the trader's life easier to identify if there is a possible signal or not, if there is a signal, he/she would need to check other filters and sections of my methodology for approval of a possible trade.
Please don't contact me for access to the script. It'll will only be available for my students. Right now the English part of the website and learning material is under development, as soon as they are ready, I will announce it under each related script for those who are interested for participating in courses.
PpSignal Step Moving AverageStep Moving Average
The indicator calculates the moving average and draws price movement in steps. To some extent, it is similar to a Renko chart, because a new horizontal line is drawn after the prices moves a fixed distance in any direction.

Trader Set - Buy Sell PowerThis is an original oscillator I Developed for my methodology, the Idea and base thought of formula came from MACD, we all know that momentum, if being set correctly, is a leading indicator and actually, it's one of few real leading indicators, keeping that in mind a heavy R&D was done and the result is a formula that can show the momentum of buyers or sellers in the market, for buying momentum, the formula is totally different than selling momentum, but knowing that the correlation is there, I added both formulas into one oscillator that would be easy to understand and use in my methodology.
Please don't contact me for the access, access is given only to my students, the English version of the website and learning material is under development. As soon as they are ready, I will announce it under every related script in comment section.
