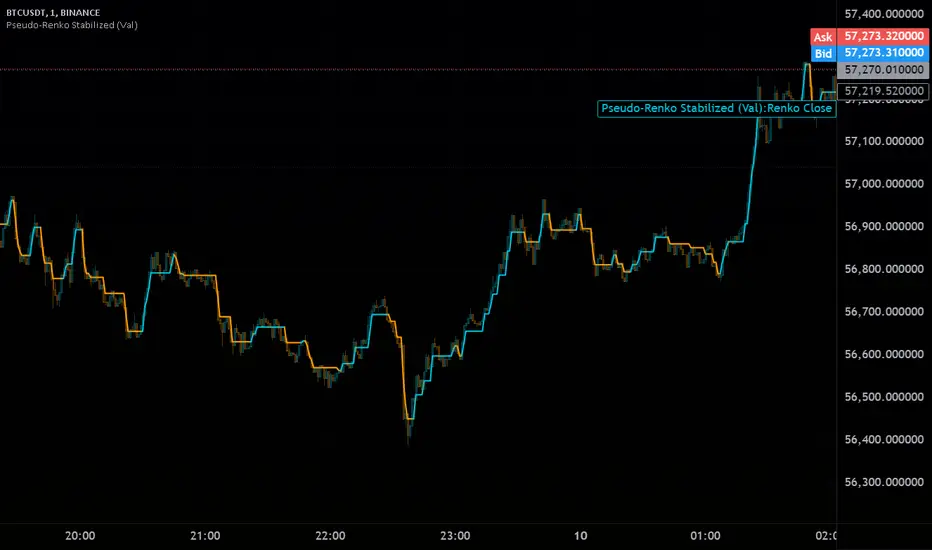
Pseudo-Renko Stabilized (Val)█ CALCULATE PSEUDO-RENKO VALUE
Calculates and returns the Pseudo-Renko Stabilized value (or close price) based on a given input value, along with the direction of the current Renko brick. This function adapts the traditional Renko brick size dynamically based on the volatility of the input value using a combination of SMA and EMA calculations. The calculated price represents the closing price of the most recent Pseudo-Renko brick, while the direction indicates the trend ( 1 for uptrend, -1 for downtrend).
Parameters:
* `val` :
* Type: ` float `
* Description: The input value upon which the Pseudo-Renko calculations are performed. You can use any price series or custom value as input.
* `sensitivity` :
* Type: ` float `
* Default Value: ` 1.0 `
* Description: Controls the sensitivity of the brick size to the volatility of the `val`. Higher values lead to larger bricks, resulting in a smoother Renko chart. Lower values produce smaller bricks, leading to a more reactive chart.
* Possible Values: Any positive float.
* `length` :
* Type: ` int `
* Default Value: ` 7 `
* Description: The length used for calculating the EMA and SMA in the dynamic brick size calculation. It influences how quickly the brick size adapts to changing volatility of the `val`.
* Possible Values: Any positive integer.
Return Values:
* `lastRenkoClose` :
* Type: ` float `
* Description: The closing price of the last completed Pseudo-Renko brick based on the `val`.
* `renkoDirection` :
* Type: ` int `
* Description: The direction of the current Pseudo-Renko brick based on the `val`:
* ` 1 `: Uptrend
* ` -1 `: Downtrend
* ` 0 `: No change (initially, or no brick change since the previous bar)
Example Usage:
//@version=5
indicator("Pseudo-Renko Stabilized (Val)", overlay=true)
// Get user inputs
sensitivityInput = input.float(0.1, "Sensitivity",0.01,step=0.01)
lengthInput = input.int(5, "Length",2)
// Example usage with the 'close' price as the input value
= pseudo_renko(math.avg(close,open), sensitivityInput, lengthInput)
// Plot the Renko close price
plot(renkoClose, "Renko Close", renkoDirection>0?color.aqua:color.orange,2)
// You can also use other values as input, such as:
// = pseudo_renko(high, sensitivityInput, lengthInput)
// = pseudo_renko(low, sensitivityInput, lengthInput)
This example demonstrates how to use the `pseudo_renko` function within an indicator. It takes user inputs for `sensitivity` and `length`, then calculates the Pseudo-Renko values using the average of the `close` and `open` prices as the `val`. The resulting `renkoClose` price is plotted on the chart, with a color change based on the `renkoDirection`. It also illustrates how you can use other values, like `high` and `low`, as input to the function.
Note: The Pseudo-Renko algorithm is based on adapting the Renko brick size dynamically based on the input `val`. This provides more flexibility compared to the normal, but is experimental. The `sensitivity` and `length` parameters, along with the choice of the `val`, offer further customization to tune the algorithm's behavior to your preference and trading style.
Поиск скриптов по запросу "renko"
Hancock - RenkoThis is the first release of Renko indicator.
Renko is plotted over candles and best calculates the number of Renko bricks printed up or down per candle which can be viewed from the data window. It plots the high and low of a the bricks, if numerous bricks are printed on a candle, as well as the open and close of a Renko brick.
This will be actively developed and improved over the next few months and i will be basing other indicators from this Renko.
Happy trading
Hancock

HKM - Renko Emulator with EMA TrendThis is a Renko based Emulator to plot on any chart type which prints the box as printed on a Renko charts and is a Non-Repaint version. You can use either Traditional or ATR Method on current chart Timeframe. Option to plot an EMA Line is provided with Trend indication.

Renko Trend Indicator with High/LowRenko Trend Indicator with High/Low
Version: 1.0
Pine Script Version: 5
Type: Indicator
Overlay: Yes
Description
The Renko Trend Indicator with High/Low provides a visual representation of market trends using Renko-style calculations based on either a fixed brick size or ATR (Average True Range). It helps traders identify trend direction, potential reversals, and key support/resistance levels.
The indicator plots Renko-based trend signals directly on your chart and provides a colored Renko close line, making trend analysis simpler and clearer.
Features
Customizable Renko Brick Size
Fixed brick size or dynamic ATR-based bricks.
Step input for precise control over brick size.
Trend Identification
Detects uptrend and downtrend based on Renko logic.
Plots visual signals for trend direction:
Green triangle below bars → Uptrend
Red triangle above bars → Downtrend
Renko Close Line
Shows the Renko-adjusted closing price as a line.
Line color changes with trend (green for uptrend, red for downtrend).
Inputs
Name Type Default Description
Brick Size float 50 Size of Renko bricks (price units)
Use ATR for Brick Size? bool false Enable ATR-based dynamic brick sizing
ATR Period int 14 Number of periods for ATR calculation if enabled
How It Works
The indicator calculates Renko bricks using either a fixed size or ATR.
It maintains internal variables:
renko_close → Current Renko price
renko_high → Highest point of the current trend
renko_low → Lowest point of the current trend
trend → Current trend direction (1 for uptrend, -1 for downtrend)
last_extreme → Last extreme point to detect trend reversal
When price moves above or below the Renko threshold, the trend is updated.
Trend signals are plotted on the chart for easy visualization.
Plots
Plot Name Description Color
Up Trend Triangle below bar when trend is up Green
Down Trend Triangle above bar when trend is down Red
Renko Close Line connecting Renko-adjusted close prices Green (up) / Red (down)
Usage
Add the indicator to any chart with your preferred timeframe.
Configure the brick size or enable ATR-based bricks for dynamic calculation.
Observe the trend triangles and Renko line to identify trend direction and potential reversals.
Can be used in combination with other indicators or strategies for trading decisions.
Notes
This indicator is for analysis purposes only and does not place trades automatically.
ATR-based bricks adapt to market volatility, while fixed bricks provide a static reference.
Works best on liquid markets with regular price movements.
Example Chart
Green triangles below bars signal a buying trend.
Red triangles above bars signal a selling trend.
The colored Renko line shows the trend progression visually.
Author
DB
Pine Script Version: 5
License: MIT

Superior-Range Bound Renko - Alerts - 11-29-25 - Signal LynxSuperior-Range Bound Renko – Alerts Edition with Advanced Risk Management Template
Signal Lynx | Free Scripts supporting Automation for the Night-Shift Nation 🌙
1. Overview
This is the Alerts & Indicator Edition of Superior-Range Bound Renko (RBR).
The Strategy version is built for backtesting inside TradingView.
This Alerts version is built for automation: it emits clean, discrete alert events that you can route into webhooks, bots, or relay engines (including your own Signal Lynx-style infrastructure).
Under the hood, this script contains the same core engine as the strategy:
Adaptive Range Bounding based on volatility
Renko Brick Emulation on standard candles
A stack of Laguerre Filters for impulse detection
K-Means-style Adaptive SuperTrend for trend confirmation
The full Signal Lynx Risk Management Engine (state machine, layered exits, AATS, RSIS, etc.)
The difference is in what we output:
Instead of placing historical trades, this version:
Plots the entry and RM signals in a separate pane (overlay = false)
Exposes alertconditions for:
Long Entry
Short Entry
Close Long
Close Short
TP1, TP2, TP3 hits (Staged Take Profit)
This makes it ideal as the signal source for automated execution via TradingView Alerts + Webhooks.
2. Quick Action Guide (TL;DR)
Best Timeframe:
4H and above. This is a swing-trading / position-trading style engine, not a micro-scalper.
Best Assets:
Volatile but structured markets, e.g.:
BTC, ETH, XAUUSD (Gold), GBPJPY, and similar high-volatility majors or indices.
Script Type:
indicator() – Alerts & Visualization Only
No built-in order placement
All “orders” are emitted as alerts for your external bot or manual handling
Strategy Type:
Volatility-Adaptive Trend Following + Impulse Detection
using Renko-like structure and multi-layer Laguerre filters.
Repainting:
Designed to be non-repainting on closed candles.
The underlying Risk Management engine is built around previous-bar data (close , high , low ) for execution-critical logic.
Intrabar values can move while the bar is forming (normal for any advanced signal), but once a bar closes, the alert logic is stable.
Recommended Alert Settings:
Condition: one of the built-in signals (see section 3.B)
Options: “Once Per Bar Close” is strongly recommended for automation
Message: JSON, CSV, or simple tokens – whatever your webhook / relay expects
3. Detailed Report: How the Alerts Edition Works
A. Relationship to the Strategy Version
The Alerts Edition shares the same internal logic as the strategy version:
Same Adaptive Lookback and volatility normalization
Same Range and Close Range construction
Same Renko Brick Emulator and directional memory (renkoDir)
Same Fib structures, Laguerre stack, K-Means SuperTrend, and Baseline signals (B1, B2)
Same Risk Management Engine and layered exits
In the strategy script, these signals are wired into strategy.entry, strategy.exit, and strategy.close.
In the alerts script:
We still compute the final entry/exit signals (Fin, CloseEmAll, TakeProfit1Plot, etc.)
Instead of placing trades, we:
Plot them for visual inspection
Expose them via alertcondition(...) so that TradingView can fire alerts.
This ensures that:
If you use the same settings on the same symbol/timeframe, the Alerts Edition and Strategy Edition agree on where entries and exits occur.
(Subject only to normal intrabar vs. bar-close differences.)
B. Signals & Alert Conditions
The alerts script focuses on discrete, automation-friendly events.
Internally, the main signals are:
Fin – Final entry decision from the RM engine
CloseEmAll – RM-driven “hard close” signal (for full-position exits)
TakeProfit1Plot / 2Plot / 3Plot – One-time event markers when each TP stage is hit
On the chart (in the separate indicator pane), you get:
plot(Fin) – where:
+2 = Long Entry event
-2 = Short Entry event
plot(CloseEmAll) – where:
+1 = “Close Long” event
-1 = “Close Short” event
plot(TP1/TP2/TP3) (if Staged TP is enabled) – integer tags for TP hits:
+1 / +2 / +3 = TP1 / TP2 / TP3 for Longs
-1 / -2 / -3 = TP1 / TP2 / TP3 for Shorts
The corresponding alertconditions are:
Long Entry
alertcondition(Fin == 2, title="Long Entry", message="Long Entry Triggered")
Fire this to open/scale a long position in your bot.
Short Entry
alertcondition(Fin == -2, title="Short Entry", message="Short Entry Triggered")
Fire this to open/scale a short position.
Close Long
alertcondition(CloseEmAll == 1, title="Close Long", message="Close Long Triggered")
Fire this to fully exit a long position.
Close Short
alertcondition(CloseEmAll == -1, title="Close Short", message="Close Short Triggered")
Fire this to fully exit a short position.
TP 1 Hit
alertcondition(TakeProfit1Plot != 0, title="TP 1 Hit", message="TP 1 Level Reached")
First staged take profit hit (either long or short). Your bot can interpret the direction based on position state or message tags.
TP 2 Hit
alertcondition(TakeProfit2Plot != 0, title="TP 2 Hit", message="TP 2 Level Reached")
TP 3 Hit
alertcondition(TakeProfit3Plot != 0, title="TP 3 Hit", message="TP 3 Level Reached")
Together, these give you a complete trade lifecycle:
Open Long / Short
Optionally scale out via TP1/TP2/TP3
Close remaining via Close Long / Close Short
All while the Risk Management Engine enforces the same logic as the strategy version.
C. Using This Script for Automation
This Alerts Edition is designed for:
Webhook-based bots
Execution relays (e.g., your own Lynx-Relay-style engine)
Dedicated external trade managers
Typical setup flow:
Add the script to your chart
Same symbol, timeframe, and settings you use in the Strategy Edition backtests.
Configure Inputs:
Longs / Shorts enabled
Risk Management toggles (SL, TS, Staged TP, AATS, RSIS)
Weekend filter (if you do not want weekend trades)
RBR-specific knobs (Adaptive Lookback, Brick type, ATR vs Standard Brick, etc.)
Create Alerts for Each Event Type You Need:
Long Entry
Short Entry
Close Long
Close Short
TP1 / TP2 / TP3 (optional, if your bot handles partial closes)
For each:
Condition: the corresponding alertcondition
Option: “Once Per Bar Close” is strongly recommended
Message:
You can use structured JSON or a simple token set like:
{"side":"long","event":"entry","symbol":"{{ticker}}","time":"{{timenow}}"}
or a simpler text for manual trading like:
LONG ENTRY | {{ticker}} | {{interval}}
Wire Up Your Bot / Relay:
Point TradingView’s webhook URL to your execution engine
Parse the messages and map them into:
Exchange
Symbol
Side (long/short)
Action (open/close/partial)
Size and risk model (this script does not position-size for you; it only signals when, not how much.)
Because the alerts come from a non-repainting, RM-backed engine that you’ve already validated via the Strategy Edition, you get a much cleaner automation pipeline.
D. Repainting Protection (Alerts Edition)
The same protections as the Strategy Edition apply here:
Execution-critical logic (trailing stop, TP triggers, SL, RM state changes) uses previous bar OHLC:
open , high , low , close
No security() with lookahead or future-bar dependencies.
This means:
Alerts are designed to fire on states that would have been visible at bar close, not on hypothetical “future history.”
Important practical note:
Intrabar: While a bar is forming, internal conditions can oscillate.
Bar Close: With “Once Per Bar Close” alerts, the fired signal corresponds to the final state of the engine for that candle, matching your Strategy Edition expectations.
4. For Developers & Modders
You can treat this Alerts script as an ”RM + Alert Framework” and inject any signal logic you want.
Where to plug in:
Find the section:
// BASELINE & SIGNAL GENERATION
You’ll see how B1 and B2 are built from the RBR stack and then combined:
baseSig = B2
altSig = B1
finalSig = sigSwap ? baseSig : altSig
To use your own logic:
Replace or wrap the code that sets baseSig / altSig with your own conditions:
e.g., RSI, MACD, Heikin Ashi filters, candle patterns, volume filters, etc.
Make sure your final decision is still:
2 → Long / Buy signal
-2 → Short / Sell signal
0 → No trade
finalSig is then passed into the RM engine and eventually becomes Fin, which:
Drives the Long/Short Entry alerts
Interacts with the RM state machine to integrate properly with AATS, SL, TS, TP, etc.
Because this script already exposes alertconditions for key lifecycle events, you don’t need to re-wire alerts each time — just ensure your logic feeds into finalSig correctly.
This lets you use the Signal Lynx Risk Management Engine + Alerts wrapper as a drop-in chassis for your own strategies.
5. About Signal Lynx
Automation for the Night-Shift Nation 🌙
Signal Lynx builds tools and templates that help traders move from:
“I have an indicator” → “I have a structured, automatable strategy with real risk management.”
This Superior-Range Bound Renko – Alerts Edition is the automation-focused companion to the Strategy Edition. It’s designed for:
Traders who backtest with the Strategy version
Then deploy live signals with this Alerts version via webhooks or bots
While relying on the same non-repainting, RM-driven logic
We release this code under the Mozilla Public License 2.0 (MPL-2.0) to support the Pine community with:
Transparent, inspectable logic
A reusable Risk Management template
A reference implementation of advanced adaptive logic + alerts
If you are exploring full-stack automation (TradingView → Webhooks → Exchange / VPS), keep Signal Lynx in your search.
License: Mozilla Public License 2.0 (Open Source).
If you build improvements or helpful variants, please consider sharing them back with the community.

[INDICATOR]Renko Emulator OCC v1 by JustUncleLThis "Study" project has been created by request and is used in conjunction with the "Strategy" version.
*** EXPERIMENTAL ***
*** USE AT YOUR OWN RISK ***
Description:
Indicator based around Renko Bar Chart emulator (ATR) with direction change used to signal buy/sell trades.
I have generally found that setting the strategy ATR resolution to 3-5x that of the chart you are viewing tends to yield the good results, regardless of which chart time used. Positions get taken automatically following THE Renko Bar after a crossover.

Hancock - Renko Brick ProductionThis is the accompanying script that shows how many renko bricks were produced in each direction per candle. It gives a basic indication of volatility, some might find it useful.
Happy trading
Hancock


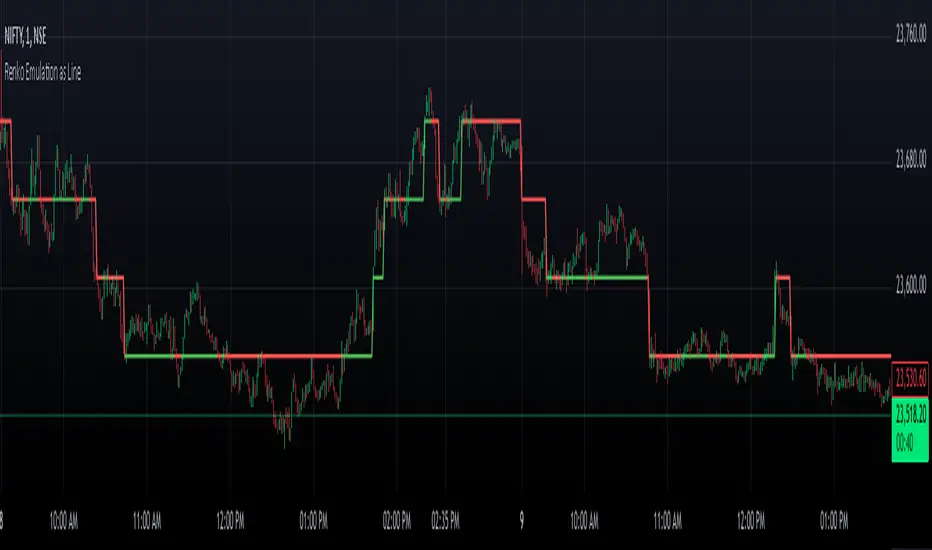
Renko Chart EmulationRenko charts are a popular tool in technical analysis, known for their ability to filter out market noise and focus purely on price movements. Unlike traditional candlestick or bar charts, Renko charts are not time-based but are constructed using bricks that represent a fixed price movement. This makes them particularly useful for identifying trends and key levels of support and resistance. While Renko charts are commonly found on platforms with specialized charting capabilities, they can also be emulated in Pine Script as a line indicator.
The Renko emulation indicator in Pine Script calculates the movement of price based on a user-defined brick size. Whenever the price moves up or down by an amount equal to or greater than the brick size, a new level is plotted, indicating a shift in price direction. This approach helps traders visualize significant price moves without the distractions of smaller fluctuations. By plotting the Renko levels as a continuous line and coloring it based on direction, this indicator provides a clean and straightforward representation of market trends.
Traders can use this Renko emulation line to identify potential entry and exit points, as well as to confirm ongoing trends. The simplicity of Renko charts makes them a favorite among those who prefer a minimalist approach to technical analysis. However, it is essential to choose an appropriate brick size that aligns with the volatility of the trading instrument. A smaller brick size may result in frequent signals, while a larger one can smooth out the chart, focusing only on the most substantial price movements. This script offers a flexible solution for incorporating Renko-style analysis into any trading strategy.
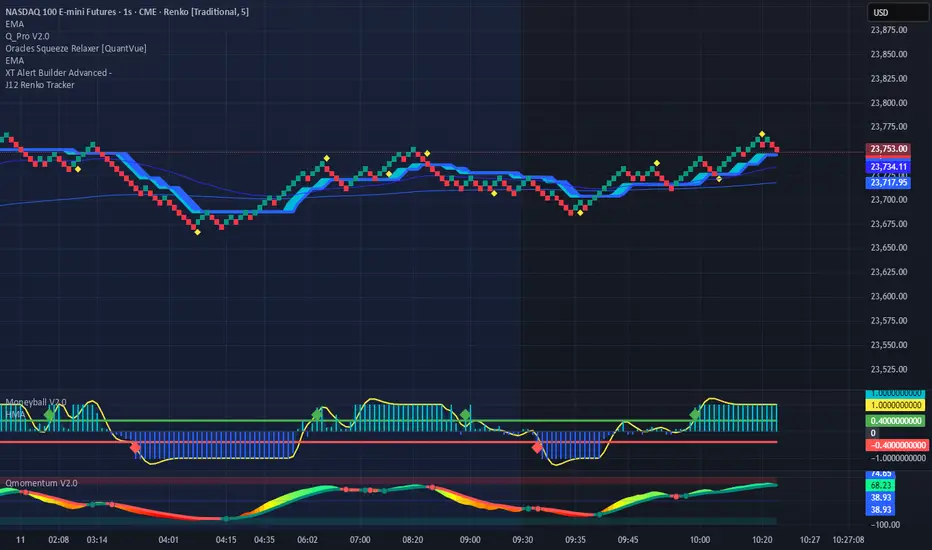
Renko Price TrackerRenko Sequential Signal – qLine + Moneyball Confirmation
This indicator is designed for Renko chart traders who want to combine price action relative to a key line (qLine) with Moneyball buy/sell signals as a confirmation. It helps filter trades so you only get signals when both conditions align within a chosen time window.
How It Works
First Event – Price Trigger
Detects when the Renko close crosses above/below your selected qLine plot from the qPro indicator.
You can choose between:
Cross – only triggers on an actual crossover/crossunder.
State (Close) – triggers whenever price closes above/below qLine.
Second Event – Moneyball Confirmation
Waits for Moneyball’s Buy Signal (for long) or Bear/Sell Signal (for short) plot to fire.
You select the exact Moneyball plot from the source menu.
You can specify how the Moneyball signal is interpreted (== 1, >= 1, or any nonzero value).
Sequential Logic
The Moneyball signal must occur within N Renko bricks after the price event.
The final buy/sell signal is printed on the Moneyball bar.
Key Features
Works natively on Renko charts.
Adjustable confirmation window (0–5 bricks).
Flexible detection for both qLine and Moneyball signals.
Customizable label sizes, arrow display, and alerts.
Alerts fire for both buy and sell conditions:
BUY: qLine ➜ Moneyball Buy
SELL: qLine ➜ Moneyball Sell
Inputs
qLine Source – Pick the qPro qLine plot.
Price Event Type – Cross or State.
Moneyball Buy/Sell Signal Plots – Select the correct plots from your Moneyball indicator.
Confirmation Window – Bars allowed between events.
Visual Settings – Label size, arrow visibility, etc.
Use Case
Ideal for traders who:
Want a double-confirmation entry system.
Use Renko charts for cleaner trend detection.
Already have qPro and Moneyball loaded, but want an automated, rule-based confluence check.
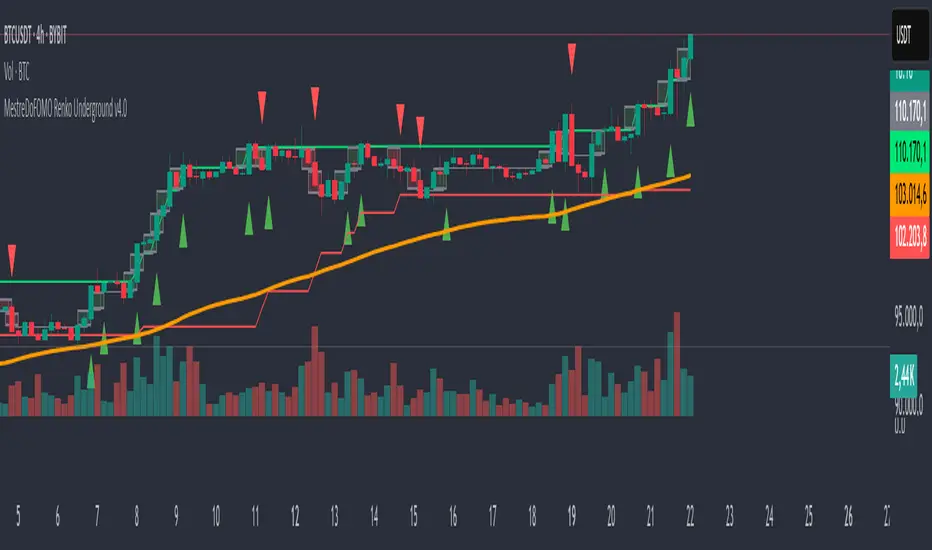
MestreDoFOMO Renko Underground v4.0Description:
The "MestreDoFOMO Renko Underground v4.0" is a custom indicator for TradingView that creates a dynamic Renko chart to help identify trends and reversal points in the market. Unlike traditional candlestick charts, Renko focuses solely on significant price movements, ignoring time and market noise. This script includes advanced features like support and resistance channels, moving averages, and alerts to assist with your trading decisions.
How It Works:
Dynamic Renko Bricks:
The brick size (price units to form each "box" on the chart) is calculated automatically using the ATR (Average True Range) with an adjustable multiplier. This means the size adapts to the asset's volatility (e.g., BTC/USDT). When the price moves up or down by the brick size, a new brick is created (green for up, red for down).
Reversal Signals:
Green triangles (🔼) appear below bars when the trend shifts to bullish, and red triangles (🔽) appear above when it shifts to bearish. These signals only appear on direction changes, reducing false signals.
Renko Channel:
The script draws two lines (green for resistance and red for support) based on the highs and lows of the last 10 bricks (or the value you set). This helps identify key price zones.
Moving Average on Bricks:
An orange line shows the moving average (EMA or SMA, your choice) of the last 20 bricks, helping confirm the overall trend.
Alerts:
You can set up alerts in TradingView to be notified when the trend shifts to bullish or bearish, perfect for active trading.
Visualization:
A gray dashed line shows the level of the last brick, providing a clear reference for the next expected move.
How to Use:
Add the indicator to your chart (e.g., BTC/USDT 1D).
Adjust parameters like the ATR multiplier, channel length, and moving average type in the settings menu.
Watch the bricks and signals to identify trends, and use the channels and moving average to plan entries and exits.
Enable alerts to receive real-time notifications.
Tip:
Test on different timeframes (1H, 4H, 1D) and adjust the ATR multiplier to match the volatility of the asset you're trading. Combine with other indicators (like RSI) for better results!
alpha Renko intraday wave timeI was asked to share my experimental Renko intraday wave time. So here it is warts and all. The same for the rest - except the Weis cumulative volume.
Renko wave time is in minutes. This script is strictly intraday and has not been played with extensively.
You must use traditional Renko and set the script wave size to the same size as the Renko brick size.
If you click on the sideways wishbone or "V" in the middle upper part of the chart you will get all of the scripts in this particular sandbox. After clicking the sideways wish bone click on "make it mine". You will then have the whole sandbox. The only published script is the Weis cumulative wave.
The "Boys MAs" is supposed to be a script for daily charts and from within some kind of consolidation. In any case I am intrigued by some signals. You have a variety of sandbox options in the format section of the boys MAs.
These codes are pretty rough with lots of abandoned lines of script.

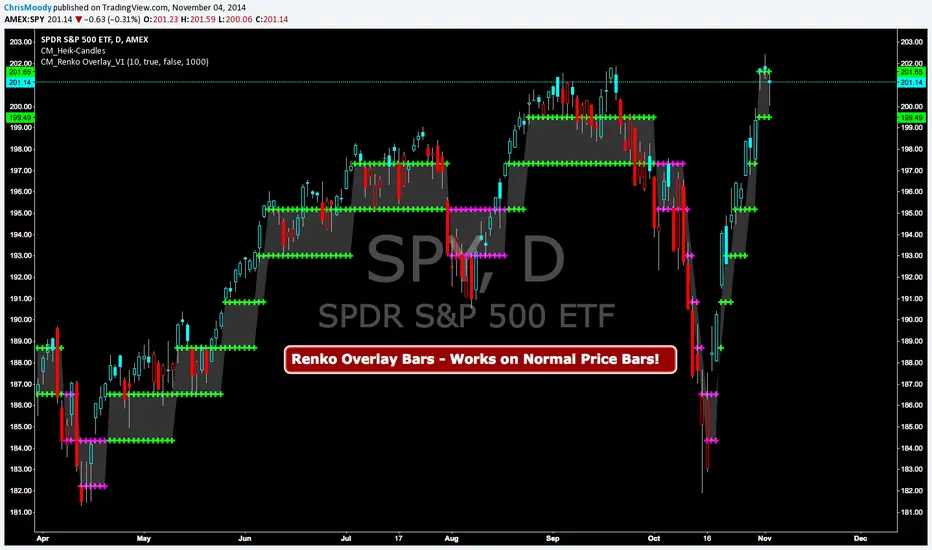
CM Renko Overlay BarsCM_Renko Overlay Bars V1
Overlays Renko Bars on Regular Price Bars.
Default Renko plot is based on Average True Range. Look Back period adjustable in Inputs Tab.
If you Choose to use "Traditional" Renko bars and pick the Size of the Renko Bars the please read below.
Value in Input Tab is multiplied by .001 (To work on Forex)
1 = 10 pips on EURUSD - 1 X .001 = .001 or 10 Pips
10 = .01 or 100 Pips
1000 = 1 point to the left of decimal. 1 Point in Stocks etc.
10000 = 10 Points on Stocks etc.
***V2 will fix this issue.
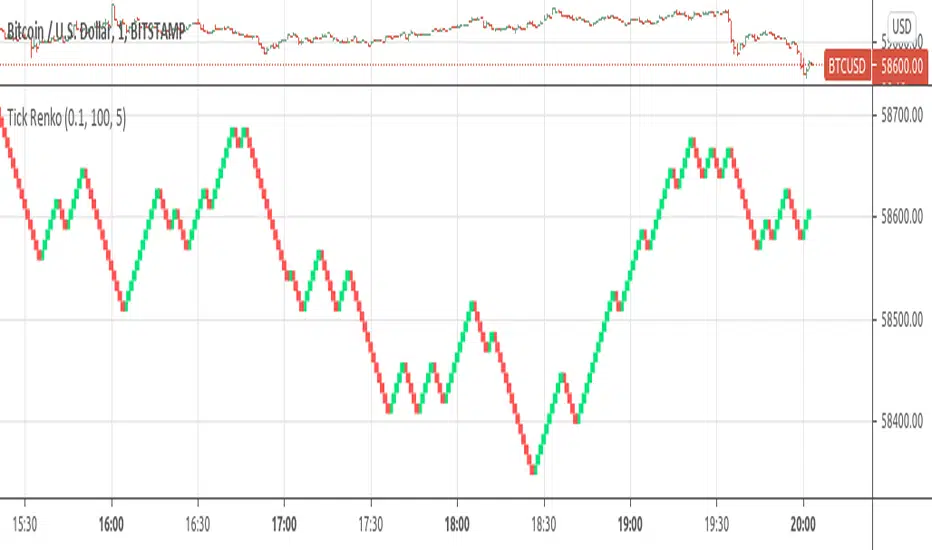
Tick Renko Chart - Percent BasedA Renko Tick chart based on continuously adjusting percentage.
Live Renko bricks formed by tick data
Adjustable brick width
Outline mode, or line mode for more bricks
Scalp with a Renko, get weird.
The settings can and will break the script if you turn them up too high. Turning off outline mode will not look as nice, but can potentially allow for a larger number of bricks.

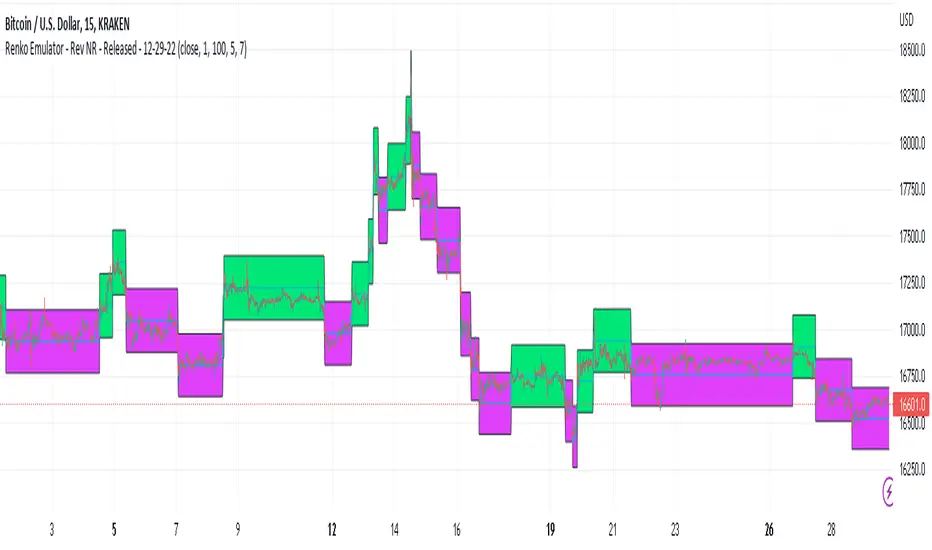
Renko Emulator - Rev NR - Released - 12-29-22Renko Emulator - Rev NR - Released 12-29-22
By Hockeydude84
Simple script to Emulate Renko Charting behavior on standard candle stick charts. Code provide capability to select between standard(ish) Renko bricks (in this code it's defined by percent vs ticks/value), or an ATR brick option. For ATR bricks, the code provides an option to inhibit emulator movement (formation of new bricks) by providing a minimum threshold that must be present. This threshold is the "Standard Brick" input (the input pulls double duty). Code also provides multiple plotting options.
Use the code to help see trends and reduce the chop/erroneous data. Also helps to identify where trend deviations are present.
HA,Renko, Linebreak,Kagi and Average all Charts Layouts in One This is an educational study, using the security functions provided by @PineCoders(big thanks to them for creating this ) in order to see the difference between multiple candle close plots using:
Heikin Ashi
Renko
Linebreak
Kagi
Average of them all.
Both the different securities and the average can be used as a source for different indicators like moving averages or oscillators getting with them some new and unique opportunities.
If you have any questions, let me know !

Tick RenkoTick Renko, bars are formed on live chart.
note:there is a issue that creates artifacts while there is not enough history loaded.
Brick count (Renko)Brick is a part of Renko chart. It is reasonable to think, that is the number of green brick is higher than the number of red brick then the trend is bullish. This indicator plots the relative number of red bricks vs green bricks.


Renko 2-block entry, 1-block exit (signals EVERY block)Renko 2-block entry, 1-block exit (signals EVERY block)

RenkoIndicatorIntroduction:
The Renko Indicator is a powerful tool designed to help traders identify trends and potential trade opportunities in the financial markets. This indicator overlays a Renko chart on the main price chart and generates Buy and Sell signals based on Renko brick movements. Renko charts are unique in that they focus solely on price movements, ignoring the element of time. In this guide, we will walk you through how to use the Renko Indicator effectively in your trading strategy.
Indicator Components:
The Renko Indicator consists of several components, each serving a specific purpose in aiding your trading decisions.
Market Sentiment Calculation:
At the top of the script, the indicator calculates market sentiment by analyzing recent price action. It determines whether the market sentiment is Bullish, Bearish, or Neutral based on the highest and lowest prices within specific time periods. This information provides you with a broader context for potential trading decisions.
Renko Chart Creation:
The indicator creates a Renko chart overlay on the main price chart using the Average True Range (ATR) method. ATR is used to calculate the brick size for the Renko chart, allowing you to adjust the sensitivity of the chart to price movements.
Renko Open and Close Midpoint:
The script plots the midpoint of Renko open and close prices as a line on the main chart. This visualization helps you understand the direction of Renko bricks and identify trends.
Buy and Sell Signal Generation:
The script generates Buy and Sell signals as label shapes on the chart. A Buy signal is generated when the Renko close price crosses above the Renko open price, indicating potential upward momentum. Conversely, a Sell signal is generated when the Renko close price crosses below the Renko open price, suggesting potential downward momentum.
Alert Conditions:
To ensure you never miss a trading opportunity, the script sets up alert conditions for Buy and Sell signals. These alerts notify you when the specified conditions for potential trades are met. Alerts can be customized to your preference, allowing you to receive notifications via your chosen communication channels.
How to Use the Renko Indicator:
Market Sentiment Analysis:
Start by analyzing the calculated market sentiment. This information helps you understand the broader trend in the market. A Bullish sentiment indicates potential upward movement, a Bearish sentiment suggests potential downward movement, and a Neutral sentiment signals uncertainty.
Renko Chart Interpretation:
Observe the Renko chart overlay and its midpoint line. Upward-trending Renko bricks suggest Bullish momentum, while downward-trending bricks indicate Bearish momentum. Use the Renko chart to identify trends and confirm your trading bias.
Buy and Sell Signals:
Pay close attention to the Buy and Sell signals generated by the indicator. A Buy signal occurs when the Renko close price crosses above the Renko open price. Conversely, a Sell signal occurs when the Renko close price crosses below the Renko open price. These signals highlight potential entry points for trades.
Alert Notifications:
Make use of the alert conditions to receive real-time notifications for Buy and Sell signals. Alerts help you stay informed even when you're not actively watching the charts, allowing you to promptly take action on potential trade opportunities.
Risk Management and Considerations:
Confirmation: While the Renko Indicator provides valuable insights, it's crucial to use it in conjunction with other technical and fundamental analysis tools for confirmation.
Backtesting: Before implementing the indicator in live trading, conduct thorough backtesting on historical data to assess its performance and suitability for your trading strategy.
Position Sizing: Determine appropriate position sizes based on your risk tolerance and the signals provided by the indicator. Avoid overleveraging your trades.
Market Conditions: Be mindful of market conditions and news events that could impact price movements. Use the Renko Indicator as a tool to enhance your decision-making process, not as a standalone strategy.
Conclusion:
The Renko Indicator offers a unique perspective on price movements and can be a valuable addition to your trading toolkit. By analyzing market sentiment, interpreting Renko chart patterns, and acting on Buy and Sell signals, you can make informed trading decisions. Remember to practice proper risk management and integrate the Renko Indicator into a comprehensive trading strategy to achieve consistent and successful trading outcomes.

Renko Live Price Simulation-AYNETHow It Works:
Inputs:
Box Size (box_size): The size of a Renko brick (in price units).
Candle and Wick Colors: Users can customize colors for up and down candles and toggle wicks on or off.
Logic:
The script tracks the renko_open, renko_close, renko_high, and renko_low variables to simulate the formation of Renko bricks.
A new Renko brick is formed when the price moves up or down by the specified box size.
Candle Plotting:
The plotcandle function is used to draw the simulated Renko bricks on the chart.
Wicks are optional and controlled via the show_wicks input.
Visual Guides:
Two lines represent the thresholds for forming the next up or down Renko brick.
Features:
Real-Time Updates:
Bricks dynamically update as the live price moves.
Customizable Parameters:
Box size, candle colors, and wicks can be tailored to user preferences.
Overlay on Regular Chart:
The Renko simulation overlays the existing candlestick chart, providing context for real-time price action.
Threshold Levels:
Visual guides show how far the current price is from forming the next Renko brick.
Usage Instructions:
Copy and paste the script into the Pine Script editor in TradingView.
Customize the box size and colors to your preference.
Apply the indicator to your chart to visualize the Renko simulation in real time.
Applications:
Trend Analysis:
Renko bricks simplify price trends by filtering out minor fluctuations.
Entry/Exit Points:
Use Renko bricks as potential trade triggers when new bricks form.
Volatility Visualization:
The frequency of brick formation reflects the asset's volatility.
This code provides a live Renko simulation overlay that can be further customized based on user needs. Let me know if you'd like additional features, such as alerts or enhanced visualizations! 😊
