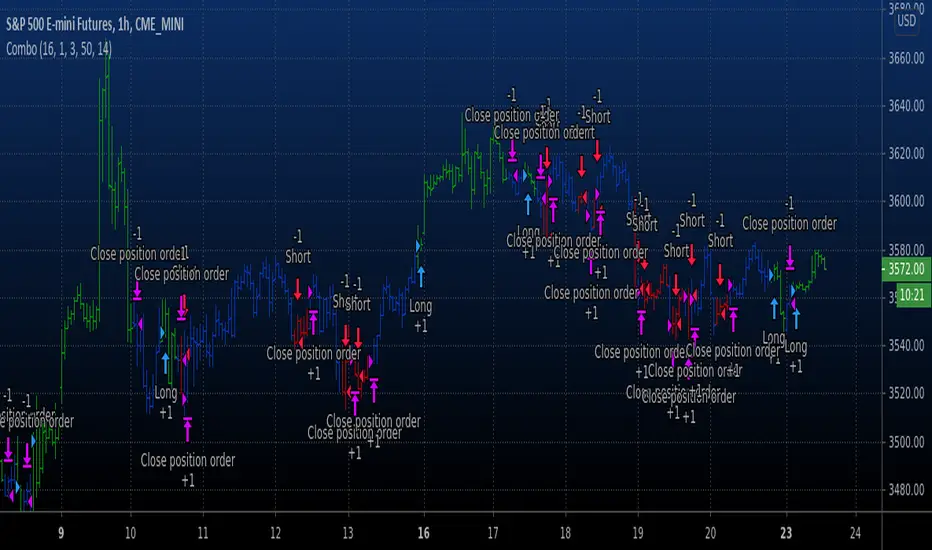
Pivot Reversal Strategy with backtest date rangeThis is standard Pivot Reversal Strategy with backtest date range added.
In parameters you can select from/to date for backtesting range.
Поиск скриптов по запросу "reversal"
Pivot Reversal Strategy - TimeFramedThis is Pivot Reversal Strategy including the time frames for backtesting.
Livermore's One Day ReversalThis is an indicator based on Jessie Livermore's "One Day Reversal" from the book "How to Trade in Stocks" by Richard Smitten.
3-Bar-Reversal-Pattern Strategy Backtest This startegy based on 3-day pattern reversal described in "Are Three-Bar
Patterns Reliable For Stocks" article by Thomas Bulkowski, presented in
January, 2000 issue of Stocks&Commodities magazine.
That pattern conforms to the following rules:
- It uses daily prices, not intraday or weekly prices;
- The middle day of the three-day pattern has the lowest low of the three days, with no ties allowed;
- The last day must have a close above the prior day's high, with no ties allowed;
- Each day must have a nonzero trading range.
Please, use it only for learning or paper trading. Do not for real trading.
Bollinger Band and Moving Average v0.1 by JustUncleLThis is another Bollinger Band strategy+indicator in my series of Bollinger based setups. This one is seems to work best with 5min charts and 20 to 30min expiry. The strategy follows variation of a Bollinger band + Moving Averages
reversal strategy, it uses the 2 moving averages mainly to determine market direction.
Triple Bollinger BandsI found myself using multiple bollinger bands a lot so I decided to add them all to one script and add the ability to adjust them by 0.2. It has helped me by not taking up as much space in the upper left corner as well as improving my in's and outs of trend continuation trades. If you manage to find a double top at +2 or greater deviation, and with a bearish divergence on the RSI as shown in this picture, GO SHORT SON! This was a fast and easy 35 - 40 pips and if you used your fibonacci for an exit you had little doubt of the final result and could have even been prepared for an immediate reversal knowing you were then at an oversold -2.8 deviation. I could go on and on........
Outside Reversal SetUpwww.tradingview.com
This is an outside reversal set up from Frank Ochoa's book Secrets of a Pivot Boss. He recommends using this in confirmation with Pivots but I guess you can play with any other indicator of your choice.
PATTERN PSYCHOLOGY " The power behind this pattern lies in the psychology behind the traders involved in this setup. If you have ever participated in a breakout at support or resistance only to have the market reverse sharply against you, then you are familiar with the market dynamics of this setup .
Basically, market participants are testing the waters above resistance or below support to make sure there is no new business to be done at these levels. When no initiative buyers or sellers participate in range extension, responsive participants have all the information theyneed to reverse price back toward a new area of perceived value."
1-2-3 Reversal Strategy This System was created from the Book "How I Tripled My Money In The
Futures Market" by Ulf Jensen, Page 183. This is reverse type of strategies.
The strategy buys at market, if close price is higher than the previous close
during 2 days and the meaning of 9-days Stochastic Slow Oscillator is lower than 50.
The strategy sells at market, if close price is lower than the previous close price
during 2 days and the meaning of 9-days Stochastic Fast Oscillator is higher than 50.
EMA100 Bounce Tracker (Support Only)Reversal Traders can use this to trade bounces from the EMA100 on any TF! :)
Reversal Triggers + 200 EMA + Prior D1 + Bias TableKeep it simple stupid.
D1 bias
H1 bias
H1 ORB (momentum)
Reversal off EMA-XsEMA-Xs works mostly on Forex due to the small prices and price fluctuations. It does work on Gold, oddly enough, and some others like UKX 100...but mostly on forex. It doesn't work as well on JPY pairs but occasionally does; the JPY pairs give less signals, but when a JPY pair gives a signal, its a high probability setup. Another script EMA-XL works better on the higher priced instruments like S&P, DJI, OIL, BTC etc.
This script will show 3 moving averages: 13, 34, 200 and works on the 5m, 1hr, 4hr, daily charts. Signals "B" or "S" will be on the chart above or below the candles respectively.
When to open:
The script gives buy and sell signals based on a counter-trend move away from the MA's. When the price rises a specific percent above/below the EMA, it'll give a signal. It's best to take a trade when it gives a cluster of consecutive signals near the same price. If using on the 5m, definitely wait for consecutive signals. Also, use this in conjunction with support and resistance areas. Using with fibs for confirmation really makes this a good tool with high probability: IE, when price hits a fib and the script gives a signal, its a high probability setup.
When to close:
1. After a fast move up/down you may use this to counter trade a scalp 10+ pips, but you need to be quick; applies mostly to the 5m chart.
2. If you have the tenacity wait until you see an opposite signal. With this method you may be holding a loosing trade for a while. But what I've noticed is if it trends against you, price usually with come near to the first time it signaled. You may want to stack trades on each cluster of signals. IE first trade is 1000 units, next is 2000 units, etc... then close when prices comes near the first time it signaled. By this time, if you held, you should have profit. This strategy will really test your mental resilience.
3. Wait until it comes back to one of the trendlines; remember this is a counter trend signal so price is moving away from the MA and it always returns to touch one of the MA's...LOL eventually
4. Applying to scalping on the 5m, keep the stops tight because if the instrument trends hard and fast, you'll be upside-down quickly.
If you put a lot of time into using this signal generator, you can really make good profit. But with all tools, you need to master it. There are nuances to the simple logic of this script that can be both fun and frustrating. With all endeavors, if you put the time into it, you will reap the rewards.
Good luck and let me know if you have any questions/comments.
Triple RSI | MisinkoMasterThe Triple RSI is my latest indicator meant to capture reversals in trends, using concepts from other indicators to make it both responsive and smooth.
How does it work?
1. Calculate RSI with length of √n, n/2 & n
n = user defined input (length)
2. Calculate the base Triple RSI
TRSI = RSI(√n) + RSI(n/2) - RSI(n)
This subtracts the slowest RSI from the faster RSIs, which speeds up the RSI and makes it more "momentum based".
3. Smooth it with MAs
We smooth it using 2 RMAs and 1 HMA (Relative & Hull Moving Average), this is fitting to the RSI, as on its own it uses RMA, and the HMA is just the cherry on top
First we smooth it using RMA(n/2), and then we smooth that using RMA(√n) and finish off with smoothing that with HMA(√n).
The point of this is to smooth the noisy indicator, but also keep it reactive, hence cutting the length of the MAs.
The RMAs are very smooth, which is useful, and the HMA is responsive enough to keep it up fast but also make it a bit smoother.
This combining of multiple methodologies (mainly borrowed from TEMA & HMA that were reinforced by me) gives us smooth and accurate signals, making for a great trend following tool
Trend classification:
I tried to make it really simple, there are 3 ways you can check the direction:
1. Values
If the value is below 0, the trend is negative, if above 0, the trend is positive.
2. Color of the RSI
If green, it signals an uptrend, if red a downtrend.
3. Backround color:
The backround is colored every time a reversal occurs, red for reversal TO negative trend, green for reversal TO positive trend, this is really useful for looking at more history at once.
Z-Score For Loop | MisinkoMasterThe Z-Score For Loop is a new trend following oscillator designed to catch reversals ahead of anyone else, providing users with top tier signals.
It works like so:
1. Calculate the Z-score of the source (like close, open etc.)
The formula is the following
(current value - mean)/Standard Deviation
For mean there is the option to use different types of averages, this allows for more flexibility, but the recommendation is using mainly SMA/EMA, maybe WMA, because the other ones might cause too much noise.
This itself is pretty noisy, so we now need to filter it a bit, which is where the next step comes in
2. Add the For Loop Logic
Basicly, what this means is that we compare the current Z-score value to the previous values, rewarding it for every previous score it beats, and punishing it for every previous score it is lower than.
This comes in handy, because using other filtering methods like the median, Average (e.g. MA) or even mode did smooth it, but made it suffer a lot of speed. The For Loop balanced the speed & noise really well, which lead to it being fast & accurate.
The idea of using the For Loop was that the Z-score was anything but lagging on its own - which is good if you want speed, but the falses it gave was unforgivable.
Adding a bit of lag to it smoothed it and made it acceptable noise wise, and really good speed wise.
The For Loops work really well as trend Following tools, and the Z-score is a concept I never saw being used in a For Loop before (correct me if I am wrong), which lead to this being quite a convenient choice for indicator and publishing
Smarter Money Concepts Dashboard [PhenLabs]📊Smarter Money Concepts Dashboard
Version: PineScript™v6
📌Description
The Smarter Money Concepts Dashboard is a comprehensive institutional trading analysis tool that combines six of our most powerful smarter money concepts indicators into one unified suite. This advanced system automatically detects and visualizes Fair Value Gaps, Inverted FVGs, Order Blocks, Wyckoff Springs/Upthrusts, Wick Rejection patterns, and ICT Market Structure analysis.
Built for serious traders who need institutional-grade market analysis, this dashboard eliminates subjective interpretation by automatically identifying where smart money is likely positioned. The integrated real-time dashboard provides instant status updates on all active patterns, making it easy to monitor market conditions at a glance.
🚀Points of Innovation
● Multi-Module Integration: Six different SMC concepts unified in one comprehensive system
● Real-Time Dashboard Display: Live tracking of all active patterns with customizable positioning
● Advanced Volume Filtering: Institutional volume confirmation across all pattern types
● Automated Pattern Management: Smart memory system prevents chart clutter while maintaining relevant zones
● Probability-Based Wyckoff Detection: Mathematical probability calculations for spring/upthrust patterns
● Dual FVG System: Both standard and inverted Fair Value Gap detection with equilibrium analysis
🔧Core Components
● Fair Value Gap Engine: Detects standard FVGs with volume confirmation and equilibrium line analysis
● Inverted FVG Module: Advanced IFVG detection using RVI momentum filtering for inversion confirmation
● Order Block System: Institutional order block identification with customizable mitigation methods
● Wyckoff Pattern Recognition: Automated spring and upthrust detection with probability scoring
● Wick Rejection Analysis: High-probability reversal patterns based on wick-to-body ratios
● ICT Market Structure: Simplified institutional concepts with commitment tracking
🔥Key Features
● Comprehensive Pattern Detection: All major SMC concepts in one indicator with automatic identification
● Volume-Confirmed Signals: Multiple volume filters ensure only institutional-grade patterns are highlighted
● Interactive Dashboard: Real-time status display with active pattern counts and module status
● Smart Memory Management: Automatic cleanup of old patterns while preserving relevant market zones
● Full Alert System: Complete notification coverage for all pattern types and signal generations
● Customizable Display Options: Adjustable colors, transparency, and positioning for all visual elements
🎨Visualization
● Color-Coded Zones: Distinct color schemes for bullish/bearish patterns across all modules
● Dynamic Box Extensions: Automatically extending zones until mitigation or invalidation
● Equilibrium Lines: Fair Value Gap midpoint analysis with dotted line visualization
● Signal Markers: Clear spring/upthrust signals with directional arrows and probability indicators
● Dashboard Table: Professional-grade status panel with module activation and pattern counts
● Candle Coloring: Wick rejection highlighting with transparency-based visual emphasis
📖Usage Guidelines
Fair Value Gap Settings
● Days to Analyze: Default 15, Range 1-100 - Controls historical FVG detection period
● Volume Filter: Enables institutional volume confirmation for gap validity
● Min Volume Ratio: Default 1.5 - Minimum volume spike required for gap recognition
● Show Equilibrium Lines: Displays FVG midpoint analysis for precise entry targeting
Order Block Configuration
● Scan Range: Default 25 bars - Lookback period for structure break identification
● Volume Filter: Institutional volume confirmation for order block validation
● Mitigation Method: Wick or Close-based invalidation for different trading styles
● Min Volume Ratio: Default 1.5 - Volume threshold for significant order block formation
Wyckoff Analysis Parameters
● S/R Lookback: Default 20 - Support/resistance calculation period for spring/upthrust detection
● Volume Spike Multiplier: Default 1.5 - Required volume increase for pattern confirmation
● Probability Threshold: Default 0.7 - Minimum probability score for signal generation
● ATR Recovery Period: Default 5 - Price recovery calculation for pattern strength assessment
Market Structure Settings
● Auto-Detect Zones: Automatic identification of high-volume thin zones
● Proximity Threshold: Default 0.20% - Price proximity requirements for zone interaction
● Test Window: Default 20 bars - Time period for zone commitment calculation
Display Customization
● Dashboard Position: Four corner options for optimal chart layout
● Text Size: Scalable from Tiny to Large for different screen configurations
● Pattern Colors: Full customization of all bullish and bearish zone colors
✅Best Use Cases
● Swing Trading: Identify major institutional zones for multi-day position entries
● Day Trading: Precise intraday entries at Fair Value Gaps and Order Block boundaries
● Trend Analysis: Market structure confirmation for directional bias establishment
● Risk Management: Clear invalidation levels provided by all pattern boundaries
● Multi-Timeframe Analysis: Works across all timeframes from 1-minute to monthly charts
⚠️Limitations
● Market Condition Dependency: Performance varies between trending and ranging market environments
● Volume Data Requirements: Requires accurate volume data for optimal pattern confirmation
● Lagging Nature: Some patterns confirmed after initial price movement has begun
● Pattern Density: High-volatility markets may generate excessive pattern signals
● Educational Tool: Requires understanding of smart money concepts for effective application
💡What Makes This Unique
● Complete SMC Integration: First indicator to combine all major smart money concepts comprehensively
● Real-Time Dashboard: Instant visual feedback on all active institutional patterns
● Advanced Volume Analysis: Multi-layered volume confirmation across all detection modules
● Probability-Based Signals: Mathematical approach to Wyckoff pattern recognition accuracy
● Professional Memory Management: Sophisticated pattern cleanup without losing market relevance
🔬How It Works
1. Pattern Detection Phase:
● Multi-timeframe scanning for institutional footprints across all enabled modules
● Volume analysis integration confirms patterns meet institutional trading criteria
● Real-time pattern validation ensures only high-probability setups are displayed
2. Signal Generation Process:
● Automated zone creation with precise boundary definitions for each pattern type
● Dynamic extension system maintains relevance until mitigation or invalidation occurs
● Alert system activation provides immediate notification of new pattern formations
3. Dashboard Update Cycle:
● Live status monitoring tracks all active patterns and module states continuously
● Pattern count updates provide instant feedback on current market condition density
● Commitment tracking for market structure analysis shows institutional engagement levels
💡Note:
This indicator represents institutional trading concepts and should be used as part of a comprehensive trading strategy. Pattern recognition accuracy improves with understanding of smart money principles. Combine with proper risk management and multiple confirmation methods for optimal results.
Tyson Type Signal BarSIGNAL BARS for trading equities and indexes
Use these bars for trading futures, index and can scalp or do reversals, or find trends
Combine with price action for best results
Liquidity Pro Map [ChartPrime]⯁ OVERVIEW
Liquidity Pro Map is a market-structure tool that simulates liquidity distribution by splitting price history into buy-side and sell-side profiles. Using candle volume and the standard deviation of close, the indicator builds two mirrored volume maps on the right-hand side of the chart. It also extends liquidity levels backwards in time until they are crossed by price, allowing you to see which zones remain untouched and where liquidity is most likely resting. Cumulative skew lines and highlighted POC levels give additional clarity on imbalance between buyers and sellers.
⯁ KEY FEATURES
Dual Liquidity Profiles: The chart is divided into buy-side (green) and sell-side (red) liquidity profiles, letting you instantly compare both sides of order flow.
Level Extension Logic: Each liquidity level is extended back in time until price crosses it. If not crossed, it persists all the way to the indicator’s lookback period, marking zones that remain “untapped.”
Dynamic Binning with Standard Deviation: The indicator distributes candle volumes into bins using close-price deviation, creating a more realistic liquidity map than static price levels.
priceDeviation = ta.stdev(close, 25) * 2
priceReference = close > open ? low - priceDeviation : high + priceDeviation
Cumulative Volume Skew Lines: Polylines on the right-hand side show the aggregated buy and sell volume profiles, making it easy to spot imbalance.
POC Identification: Highest-volume levels on both sides are marked as POC (Point of Control) , providing key zones of interest.
Clear Color Coding: Gradient shading intensifies with volume concentration—dark teal/green for buy zones, dark pink/red for sell zones.
⯁ HOW IT WORKS (UNDER THE HOOD)
Volume Distribution: Each bar’s volume is assigned to a price bin based on its reference price (close ± standard deviation offset).
Buy vs. Sell Splitting: If bins above last close price, volume is allocated to sell-side liquidity; otherwise, it’s allocated to buy-side liquidity.
Level Extension: Boxes marking liquidity bins extend back until crossed by price. If uncrossed, they anchor all the way to the start of the lookback window.
Cumulative Polylines: As bins are stacked, cumulative buy and sell values form skew polylines plotted at the right edge.
POC Levels: The highest-volume bin on each side is highlighted with labels and arrows, marking where the heaviest liquidity is concentrated.
⯁ USAGE
Use buy/sell profiles to see where liquidity is likely resting. Green shelves suggest potential support zones; red shelves suggest resistance or sell liquidity pools.
Watch untouched extended levels —these often become magnets for price as liquidity is swept.
Track POC levels as primary liquidity targets, where reactions or fakeouts are most common.
Compare cumulative skew lines to judge which side dominates in volume. Heavy buy skew may indicate absorption of sell pressure, and vice versa.
Adjust lookback period to switch between intraday liquidity maps and larger swing-based profiles.
Use separator feature to hide bins borders for better visual clarity.
Use as a confluence tool with OBs, support/resistance, and liquidity sweep setups.
⯁ CONCLUSION
Liquidity Pro Map transforms candle volume into a structured simulation of where liquidity may rest across the chart. By dividing buy vs. sell profiles, extending untouched levels, and marking cumulative skew and POC, it equips traders with a clear visual map of potential liquidity pools. This allows for better anticipation of sweeps, reversals, and areas of high market activity.
Mean Reversion Indictor, Based on Standard Deviations Description:
The Reversal Candle Mean Reversion Indicator is designed for traders seeking to identify potential reversal points in the market based on key price action and volatility. This indicator combines price action analysis (sweeping prior highs or lows) with mean reversion theory, highlighting opportunities where the price tests or touches a moving average's standard deviation bands.
By focusing on these moments of price extremes, the indicator helps traders spot bullish and bearish reversal signals when the price retraces from volatile movements. These conditions often signal a return to the mean—an ideal setup for reversal traders who thrive on fading exaggerated price moves.
How It Works:
1. Price Action Reversal Signal:
* Bullish Reversal: The indicator flags a bullish signal when the current candle's low sweeps the prior candle's low, and the candle closes higher than the prior candle's close.
* Bearish Reversal: The indicator flags a bearish signal when the current candle's high sweeps the prior candle's high, and the candle closes lower than the prior candle's close.
2. Mean Reversion Confirmation:
* Mean Reversion Signal is triggered when the price touches or tests the upper or lower bands, calculated using a user-selected moving average (SMA, EMA, WMA, VWMA, or Hull MA) and standard deviation.
* The indicator combines price action and volatility, providing stronger reversal signals when the price reaches an extreme distance from the moving average.
3. Customization Options:
* Moving Average Type: Choose from SMA, EMA, WMA, VWMA, or Hull MA.
* Moving Average Length: Adjust the length of the moving average (default: 20).
* Standard Deviation Multiplier: Set the number of standard deviations for the volatility bands (default: 2.0).
* Custom Candle Colors: Choose custom colors for bullish and bearish reversal candles to easily spot signals.
How to Use for Trading Reversals:
1. Identify Extremes:
* Watch for candles where the price tests or touches the standard deviation bands. These are key moments when the price has moved significantly from the moving average, indicating a potential overbought or oversold condition.
2. Look for Reversals:
* When the price tests a band and simultaneously forms a bullish reversal pattern (sweeping the prior low and closing higher), it signals a potential mean reversion to the upside.
* When the price tests a band and forms a bearish reversal pattern (sweeping the prior high and closing lower), it signals a potential mean reversion to the downside.
3. Entry Points:
* Long Trades: Enter a long trade after a bullish signal appears (green candle) near the lower band, indicating a likely price reversal back towards the mean.
* Short Trades: Enter a short trade after a bearish signal appears (red candle) near the upper band, indicating a likely price pullback.
4. Exit Strategy:
* Set a profit target at the moving average (the mean) or a specific price level based on your strategy.
* Consider using a trailing stop to capture additional profit in case of a stronger reversal beyond the mean.
5. Risk Management:
* Place stops just below the low of the bullish reversal candle or just above the high of the bearish reversal candle to manage risk efficiently.
Geometric Trend Angle [AstroHub]This script, "Geometric Trend Angle," is designed to identify trend reversals based on the geometric angle of the price chart. Here's a detailed explanation of its originality, functionality, and usage:
Originality and Usefulness:
The uniqueness of this script lies in its approach to trend reversal detection through the calculation of the geometric trend angle. Unlike traditional methods, this script combines the analysis of the angle of the price movement with specific conditions for identifying potential trend reversals.
How it Works:
Length and Trend Angle: The user sets the "Length" parameter, determining the period for calculating the trend angle. The script then computes the trend angle, representing the change in prices over the specified period.
Trend Reversal: The script identifies potential trend reversals when the trend angle changes from positive to negative, and the current closing price is higher than the previous closing price.
Green Reversal: Additionally, the script looks for instances where the trend angle changes from negative to positive, and the current closing price is lower than the previous closing price, indicating a potential reversal to the downside.
Graphical Representation: The script visually highlights the identified reversal points on the chart with labels ("Trend Reversal" and "Green Reversal") and draws a line from the reversal point for better visualization.
Alerts: Traders are alerted to potential trend reversals and green reversals, allowing for timely responses to changing market dynamics.
How to Use:
Apply the script to your TradingView chart.
Customize the "Length" parameter based on your preference and analysis.
Observe the colored candles and graphical elements to identify potential trend reversals.
Pay attention to alerts for timely notifications of reversal signals.
Conclusion:
The "Geometric Trend Angle" script provides a unique perspective on trend reversals, combining geometric angle analysis with specific conditions for improved accuracy. Traders can use it as part of their overall analysis to make informed decisions in the dynamic market environment.
BX-Volume Trend and OscillatorBX-Volume Trend and Oscillator (VTO)
This is my second indicator. I created this indicator for myself. I was inspired by the indicators created by Bjorgum, Duyck and QuantTherapy and decided to create multiple indicators that either work well combined with their indicators or something new that applies some of their indicator concepts. I decided to share this because I believe in learning and earing together as a community. I will later share the rest of the indicators I have created. If you guys have any questions or suggestions write them.
The BX-Volume Trend and Oscillator (VTO) is a comprehensive trading indicator designed to help traders identify trends, momentum shifts, and potential reversals by analyzing volume and price action through various metrics. This indicator combines relative volume analysis with custom Xtrender oscillators and moving averages to provide valuable insights into market behavior.
Image: BX-Volume Trend and Oscillator (VTO)
Features:
Relative Volume Analysis: Measures the current volume relative to the average volume over a specified period, helping traders understand if the current trading activity is unusually high or low.
Short-Term Xtrender Oscillator: This oscillator analyzes the difference between two short-term Exponential Moving Averages (EMAs) and smooths it with a custom RSI, highlighting short-term trends and potential reversal points.
Long-Term Xtrender Oscillator: Similar to the short-term oscillator but uses longer-term EMAs and RSI for identifying more sustained trends and shifts.
T3 Moving Average: A smoothed version of the Xtrender oscillator that helps in detecting trend changes more clearly.
Volume Trend Plot: Shows the smoothed relative volume to understand how trading activity aligns with the trend.
Visual Indicators: Uses colors and shapes to highlight significant changes and trends, such as circles to mark potential reversal points.
How to Use the Indicator
Analyze Relative Volume:
Relative Volume Plot: The smoothed relative volume is displayed in white, helping you assess if current trading volumes are above or below the historical average.
High Relative Volume: Indicates strong trading interest, which could support or contradict the prevailing trend.
Image above: is set to daily timeframe
Monitor Short-Term Xtrender Oscillator
Short-Term Xtrender: Plotted as a column histogram with colors changing from green to red based on the oscillator's movement and momentum. Green and lime colors indicate bullish trends, while maroon and red suggest bearish conditions.
Smoothed Short-Term Xtrender (T3): Plotted as a line that adjusts color based on the short-term Xtrender's trend. The line changes color to match the histogram's color, providing a clearer view of momentum shifts.
Reversal Markers: Small circles indicate potential short-term trend reversals, where changes in the T3 moving average suggest shifts in momentum.
Assess Long-Term Xtrender Oscillator:
Long-Term Xtrender: Plotted as a histogram, with color changes similar to the short-term Xtrender. It shows longer-term trends and shifts.
Color Indicators: Lime and green colors suggest an uptrend, while red and maroon indicate a downtrend.
Look for Zero Line Crossings:
The zero line serves as a reference point. Crossings above the zero line may indicate bullish trends, while crossings below may signal bearish trends.
Image above: is set to daily timeframe, and it showcases the Short-Term Xtrender (T3) applied.
Image above: is set to 8hr timeframe: Using the lower timeframe you can spot better details of pullbacks and potential reversals.
Example of Use:
Identify Trend and Momentum: Use the combination of the short-term and long-term Xtrender oscillators to gauge the prevailing market trend. For instance, if both oscillators are above zero and showing upward momentum, it suggests a strong bullish trend.
Spot Reversals: Observe the short-term Xtrender and its smoothed T3 version. If the T3 line changes direction and crosses through previous peaks and troughs, it could signal a potential reversal.
Volume Confirmation: Check the relative volume and its smoothed version to confirm the strength of price movements. Significant changes in volume can validate the trends indicated by the Xtrender oscillators.
By combining these elements, the BX-Volume Trend and Oscillator (VTO) provides a holistic view of market dynamics, helping traders make more informed decisions based on trend strength, potential reversals, and volume activity.
Lastly, my Scripts/Indicators/Ideas /Systems that I share are only for educational purposes!
OBV with MA & Bollinger Bands by Marius1032OBV with MA & Bollinger Bands by Marius1032
This script adds customizable moving averages and Bollinger Bands to the classic OBV (On Balance Volume) indicator. It helps identify volume-driven momentum and trend strength.
Features:
OBV-based trend tracking
Optional smoothing: SMA, EMA, RMA, WMA, VWMA
Optional Bollinger Bands with SMA
Potential Combinations and Trading Strategies:
Breakouts: Look for price breakouts from the Bollinger Bands, and confirm with a rising OBV for an uptrend or falling OBV for a downtrend.
Trend Reversals: When the price touches a Bollinger Band, examine the OBV for divergence. A bullish divergence (price lower low, OBV higher low) near the lower band could signal a reversal.
Volume Confirmation: Use OBV to confirm the strength of the trend indicated by Bollinger Bands. For example, if the BBs indicate an uptrend and OBV is also rising, it reinforces the bullish signal.
1. On-Balance Volume (OBV):
Purpose: OBV is a momentum indicator that uses volume flow to predict price movements.
Calculation: Volume is added on up days and subtracted on down days.
Interpretation: Rising OBV suggests potential upward price movement. Falling OBV suggests potential lower prices.
Divergence: Divergence between OBV and price can signal potential trend reversals.
2. Moving Average (MA):
Purpose: Moving Averages smooth price fluctuations and help identify trends.
Combination with OBV: Pairing OBV with MAs helps confirm trends and identify potential reversals. A crossover of the OBV line and its MA can signal a trend reversal or continuation.
3. Bollinger Bands (BB):
Purpose: BBs measure market volatility and help identify potential breakouts and trend reversals.
Structure: They consist of a moving average (typically 20-period) and two standard deviation bands.
Combination with OBV: Combining BBs with OBV allows for a multifaceted approach to market analysis. For example, a stock hitting the lower BB with a rising OBV could indicate accumulation and a potential upward reversal.
Created by: Marius1032