TradeMaster ProTrading effectively requires a range of techniques, experience, and expertise. From technical analysis to market fundamentals, traders must navigate multiple factors, including market sentiment and economic conditions. However, traders often find themselves overwhelmed by market noise, making it challenging to filter out distractions and make informed decisions. To address this, we present a powerful indicator package designed to assist traders on their journey to success.
The TradeMaster indicator package encompasses a variety of trading strategies, including the SMC (Supply, Demand, and Price Action) approach, along with many other techniques. By leveraging concepts such as price action trading, support and resistance analysis, supply and demand dynamics, these indicators can empower traders to analyze entry and exit positions with precision. Unlike other forms of technical analysis that produce values or plots based on historical price data, Price Action brings you the facts straight from the source - the current price movements.
The indicator package consists of three powerful indicators that can be used individually or together to maximize trading effectiveness.
⭐ About the Pro Indicator
The Pro indicator is the cornerstone of the package, offering a comprehensive range of functions. It's strength lies in our unique structure calculation, which is based on real price action data, capturing every ticks from small intraday fluctuations to the significant high timeframe movements. The Pro Indicator reflects our personal use and deep comprehension of Smart Money Concepts. It provides streamlined tools for tracking algorithmic trends with modern visualizations, without unnecessary clutter.
In the ever-evolving trading landscape, mainstream methods and strategies can quickly become outdated as they are widely adopted. Liquidity is constantly sought after, and the best source for this is exploring and exploiting trading strategies that are widely accepted and applied. Currently, one of these strategies is the SMC (Supply, Demand, and Price Action).
It's no coincidence that our educational materials incorporate concepts such as liquidity grabs (LG) and Smart Money Traps (SMT). As the application of SMC gains popularity among retail traders, trading with this approach becomes more challenging. Therefore, the recent focus has been on reforming the SMC methodology, as it is the only method that relies on real price movements and will always work when applied correctly.
▸ What does proper application of SMC entail?
Many SMC traders associate their key areas of interest with the market structure, which is generally considered acceptable. However, depending solely on a single foundation can lead to significant deviations, which may cause notable impacts on trading results. Moreover, if the basis for the market structure calculation is inaccurate, the consequences can be even more severe. It's akin to risking money on a lottery ticket, believing it will be a winner.
Our methodology is different, and it may ensure longevity in the financial markets. The structure remains crucial, but it is not the sole foundation of everything; instead, it serves as a validation tool. Each calculation, such as order blocks (OB), Fair Value Gaps (FVG), liquidity grabs (LG), range analysis, and more, is independent and unique, separate from the structure. However, validation must ultimately come from the structure itself.
We employ individual and high-quality filters: before a function calculation is validated by the structure, it must undergo rigorous testing based on its own set of validation conditions. This approach aims to enhance robustness and accuracy, providing traders with a reliable framework for making informed trading decisions.
▸ An example for structure validation: Order Block with "Swing Sensitivity"
These order blocks will only be displayed and utilized by the script if there is a swing structure validation with a valid break. In other words, the presence of a confirmed swing Change of Character (ChoCh) or Break of Structure (BoS) is essential for the Order Block to be considered valid and relevant.
This approach ensures that the order blocks are aligned with the overall market structure and are not based on isolated or unreliable price movements. Whether it's Fair Value Gaps (FVG), Liquidity Grabs (LG), Range calculations, or other functionalities, the same underlying principle holds true. The background structure calculation serves as a validation mechanism for the data and insights generated by these functions, ensuring they adhere to the specific criteria and rules established within our methodology. By incorporating this robust validation process, traders can have confidence in the reliability and accuracy of the information provided by the indicator, allowing them to make informed trading decisions based on validated data and analysis.
👉 Usage - the general approach:
Determine your trading style using the Pro Indicator and build your basic strategy. This indicator helps you understand your trading style, whether it's swing trading, scalping or another approach. By analyzing the Pro Indicator, you gain valuable information about potential market trends, entry and exit points, and overall market sentiment.
👉 Example of usage:
In the following chart, you'll notice how we've utilized the indicator to formulate a strategic trading approach. We've employed Order Blocks equipped with volume parameters to identify crucial market zones. Simultaneously, we've leveraged swing/internal market structures to gain insights into potential long and short-term market turnarounds. Lastly, we've examined trend line liquidity zones to pinpoint probable impulses and breakouts within ongoing trends.
Now we can see how the price descended to the order block with the highest volume, which we had previously marked as our point of interest for an entry. As the price closed below the median Order Block, we noted its mitigation. After an internal CHoCH, it's directing us towards the main Order Block as a target.
👉 Smart Money Concepts Functions
Market Structure: identifies and marks key structural changes in the market, in order to visually highlight shifts in market trends and patterns. This feature is designed to alert you of significant changes in the market's behavior, signaling a potential shift from accumulation to distribution phase, or vice versa. It helps traders adapt their strategies based on evolving market dynamics.
Order Blocks: pinpoints crucial zones where large institutional investors ("smart money") have shown strong buying or selling interest recently. Order blocks can serve as a tool for identifying key levels for potential trade entries or exits.
FVGs (Fair Value Gaps): detects discrepancies between the perceived market value and actual market price, revealing potential areas for price correction. With its mitigation settings, you can fine-tune the FVG detection according to the magnitude of value misalignment you consider significant.
Liquidity Grabs: helps track "smart money" footprints by identifying levels where large institutional traders may have induced liquidity traps. Understanding these traps can aid in avoiding false market moves and optimizing trade entries.
Automatic Fibonacci Tool: Simplifying the task of identifying key Fibonacci retracement and extension levels, this tool ties Fibonacci levels to the structure for you. It aids in recognizing significant support and resistance levels, providing a clearer understanding of potential price movements.
The Smart Money Concepts trading strategy - combined with these dynamic features - becomes a powerful analytical asset for any trader, providing in-depth insights into market dynamics, trends, and potential opportunities.
👉 Algorithmic trend and dynamic support and resistance
Trend Rainbow: This proprietary feature uses our unique TRMA** method to define short-term, medium-term, and long-term market trends. It incorporates state-of-the-art visualization techniques to render the trend information in an intuitive, easily interpretable manner. It's a 21st-century tool designed for the modern trader who values both precision and simplicity.
Multi-Timeframe Moving Averages: This feature allows traders to simultaneously monitor moving averages across multiple timeframes, providing a comprehensive perspective on market trends. It helps identify dynamic support and resistance zones, key levels where price movements are likely to slow down or reverse. This function not only aids in planning potential trade entries and exits, but also calculates the precise percentage distance to these levels. Can be as well crucial for risk management, enabling traders to set stop losses and profit targets based on solid, data-driven analysis. The Multi-Timeframe Moving Averages function is a versatile tool that combines strategic planning and risk control into a single, easy-to-use feature.
👉 Unlock the Hidden Market Dynamics
Market Sessions: This feature - by default - provides a clear representation of the four major global trading sessions. Each session is distinctly marked on your trading chart, helping you visualize the specific time periods when these markets are most active. Recognizing these sessions is critical for understanding market dynamics, as the opening and closing of major markets can lead to significant price movements. Whether you're a day trader looking to exploit intra-day volatility or a long-term investor wanting to understand broader market trends, the Market Sessions feature can be a useful tool in your trading toolkit.
Divergence Functions: allow the use of unique indicators along with our proprietary ones to detect potential price reversals. As each asset has a different market maker, divergences can vary greatly across different charts and timeframes. With our Divergence Ranking Table, you can quickly determine which divergences have the highest success rates and which are the least successful on a given chart. This feature allows you to adapt your strategies to the most effective signals, enhancing your trading decisions and boosting your potential profits.
Volume Profile with delta: This feature may give traders an edge by providing an in-depth view of market activity. It illustrates the amount of trading volume at different price levels, combined with the 'delta', which is the difference between buying and selling volume. This information allows you to see areas of high trading activity and understand whether the volume is pushing the price up or down. This real-time insight into the market's supply and demand can be instrumental in identifying key support and resistance levels, predicting potential reversals, and recognizing where the market is likely to move. Similarly to Fibonacci tool, Volume Profile can be tied to the current market structure.
👉 Improve Trading Decisions
Range: This innovative feature assists traders in determining discount, premium, and equilibrium zones. It provides a unique way of visualizing price areas where a security could be overbought or oversold (premium or discount zones), and where the price is expected to be fair and balanced (equilibrium zone). Distance from current price is displayed in percentage terms, which can assist traders with crucial data for risk management and strategic planning. The Range function helps you identify the most favorable price zones for entries and set your stop-loss and take-profit levels more accurately.
Previous OHLC: This functionality offers the capability to display the previous Open, High, Low, Close values. It is primarily set on the daily timeframe and serves as an important reference for traders. Having an overview of these key levels from the previous day gives you a solid foundation on which to base today's trading decisions. Recognizing these levels can help you predict potential turning points in the market, providing an advantage in your trading strategy.
Smart Money Zones: our secret weapon for swing traders. Similarly to order blocks, these zones can accurately identify crucial areas of strong buying or selling interest by large institutional investors. However while Order Blocks focus on recent price action, Smart Money Zones take the whole chart into consideration, resulting in more established support and demand zones.
The summary graph combines six unique indicators (Momentum, Trend Strength, Volume, Volatility, Asset Strength, and Sentiment) along with Structure and Sessions. These indicators use our TRMA** method to provide a comprehensive overview of market dynamics. By consolidating these indicators into a single graph, traders can gain valuable insights into the overall market landscape.
** TRMA (Trend Rainbow Moving Averages) is a complex but customizable moving average matrix calculation that is designed to measure market trend direction, strength and shifting.
⭐ Conclusion
We hold the view that the true path to success is the synergy between the trader and the tool, contrary to the common belief that the tool itself is the sole determinant of profitability. The actual scenario is more nuanced than such an oversimplification. Our aim is to offer useful features that meet the needs of the 21st century and that we actually use.
🛑 Risk Notice:
Everything provided by trademasterindicator – from scripts, tools, and articles to educational materials – is intended solely for educational and informational purposes. Past performance does not assure future returns.
Поиск скриптов по запросу "smart"

ATR VisualizerAdvance Your Market Analysis with the True Range Indicator
The True Range Indicator is a sophisticated screener meticulously developed to bolster your trading execution by presenting an exceptional understanding of the market direction. The centerpiece of this instrument is a distinctive candle configuration depicting the Average True Range (ATR) and the Bear/Bull range. However, it traverses beyond the conventional channels to offer specific market settings to boost your trading decisions.
User-Defined Settings
Broadly, the indicator offers five dynamic settings:
Bear/Bull Range
The Bear/Bull Range outlines the ATR for each candle type - bearish and bullish - and then smartly opts for the pertinent one based on the prevalent market circumstances. This feature aids in comparing the range of bullish and bearish candlesticks, which deepens your understanding of the price action and volatility.
Bearish Range
The Bearish Range isolates and computes the ATR for bearish candles solely. Utilizing this option spots the bear-dominated periods and provides insights about potential market reversals or downward continuations.
Bullish Range
Opposite to the Bearish Range, the Bullish Range setting tabulates the ATR exclusively for bullish candles. It assists in tracking the periods when bulls control, enlightening traders about the possibility of upward continuations or trend reversals.
Average Range
The Average Range provides an unbiased measure of range without prioritizing either bull or bear trends. This model is ideal for traders looking for a holistic interpretation of market behavior, regardless of direction.
Cumulative Average Range
Equally significant is the Cumulative Average Range which calculates the aggregate moving average of the true ranges for an expressed period. This setting is extremely valuable when evaluating the long-term volatility and spotting potential breakouts.
Dual Candle Configuration
Going a step ahead, the True Range Indicator uniquely offers the possibility to incorporate more than one candle estimate on your screen. This ensures simultaneous analysis of multiple market dynamics, thereby enhancing your trading precision multifold.
Concluding Thoughts
In essence, the True Range Indicator is an indispensable companion for traders looking to not only leverage market volatility but also make educated predictions. Equipped with an array of insightful market settings and the ability to display dual candle estimates on-screen, you can customize the functionality to suit your unique trading style and magnify your market performance dramatically.

OSPL Volume [Community Edition]NSE:BANKNIFTY1!
This indicator is based on the concepts popularized by @OptionsScalper123 "Siva" of OiPulse. His ideology Is that large moves come after high volume candles. For Nifty, high volume is considered to be a candle above 125k volume and for BankNifty it’s 50k.
This indicator allows you to cut the noise and focus only on the high volume candle. It shows high volume candle in a brighter shade and lower volume candles in a less visible shade.
You can set the minimum volume threshold limit for Nifty and BankNifty. The indicator smartly recognizes which index you are using it in and uses the respective threshold volume limit.
All colors are customizable.
Thanks for Siva for all the ideas and wonderful products he has given to the community
Thanks to all the wonderful Pinescipters for developing awesome indicators and keeping the source open.
The source code of this indicator is just a few lines. Hope you can use it in your projects and learn something from this just how I learned from other scripts.
Any changes or updates needed in this indicator, please suggest. I was thinking some kind of alerts can be added when volume crosses the threshold. Let me know.
Boost/like this indicator and comment if you find this useful. Cheers and happy trading!!!

Seasonal Open Interest° by toodegreesDescription:
The Open Interest (OI) is a valuable metric that gets released at the end of each trading day. This metric represents the number of outstanding futures contracts held by market participants for a given commodity or market
The concept of utilizing the OI data as a strategic trading tool was first introduced by Larry Williams :
Rise in Price + Rise in OI: strong trend – new money is coming into the market, showing aggressive buying activity
Rise in Price + Decline in OI: weakening trend – less money coming into the market, suggesting that the move is likely to reverse lower
Decline in Price + Decline in OI: strong trend – new money is coming into the market, showing aggressive selling activity
Decline in Price + Rise in OI: weakening trend – less money coming into the market, suggesting that the move is likely to reverse higher
The Inner Circle Trader (ICT) expanded on these ideas, by exposing Smart Money's behaviour:
Rise in Price + Rise in OI: shorts are being stopped out, and new sellers take their place – gradually, longs get stronger and shorts get weaker
Rise in Price + Decline in OI: Smart Money longs are taking profit and liquidating their positions, and weak shorts are exiting the market
Decline in Price + Decline in OI: longs are being stopped out, and new buyers take their place – gradually, shorts get stronger and longs get weaker
Decline in Price + Rise in OI: Smart Money shorts are taking profit and liquidating their positions, and weak longs are exiting the market
Further, ICT showed the importance of OI in consolidations at Institutional Support or Resistance levels:
Consolidation + Rise in OI: bearish sign due to Smart Money is playing the short side and accumulating positions
Consolidation + Decline in OI: bullish sign due to Smart Money covering their short positions
Last but not least, the Seasonal Open Interest shows us a historical reference point of how OI usually, but not always, develops over the trading year.
Depending on the narrative, a higher/lower OI than its Seasonal Tendency can provide an incredible edge by pointing traders towards what side Smart Money is taking.
The Open Interest Meter shows you a visual representation of how many Standard Deviations the Open Interest is deviating from its Seasonal Tendency.
You can also display this visually as a shaded area between the two metrics:
Features:
Plot Open Interest Data
Plot the Seasonal Open Interest for a specific year
See the OI vs. Seasonal OI in a tailored meter
Shade the area between the OI and the Seasonal OI based on their difference

BBD+1. BBD+ can be used on equities, futures, forex and crypto and also on different time frame (daily, weekly and hourly) as well, we advise only look for hourly chart or longer time frame.
2. Consist of fundflow candle, moving average line and triangle signal.
3. The indicator is easy to use and interpret the direction and strength of smart money.
4. Fundflow candle :-
− GREEN candle = smart money inflow > smart money outflow
Green candle above 0 value = opportunity ;
Green candle below 0 value = monitor/hold/rebound
− RED candle = smart money inflow < smart money outflow
Red candle above 0 value = monitor/hold/retracement ;
Red candle below 0 value = risk
− The longer candle indicate higher volume of smart money
5. Moving average line :-
− GREEN line = 5-days moving average (m5)
− BLUE line = 10-days moving average (m10)
− RED line = 20-days moving average (m20)
6. Triangle signal :-
− Arrow-UP triangle = Fundflow candle cross up GREEN line (5-days moving average)
− Arrow-DOWN triangle = Fundflow candle cross down GREEN line (5-days moving average)
7. Five (5) alert conditions are set to notify when desired condition was triggered, i.e.
(1) BBD+ cross-up m5
(2) BBD+ turn GREEN
(3) BBD+ turn RED
(4) BBD+ cross-up ZERO-axis
(5) BBD+ cross-down ZERO-axis
8. Background color indicate the color of smart money candle.
9. BBD+ is not advised to be used solely for the purpose of buy/sell, work best together with indicator TrendX+, DDX+ and MCDX+.

Support and Resistance Based Off Indicators V2Theory Behind It"
There have been hundreds of trading methods and theories that have been proposed by the trading community, each with a unique perspective on trading. One of the most popular theories is known as the Dow theory which was one of the first theories to theorise the concept known today as trends. Now the majority of today's trading strategies are based off the single concept known as "trends."
These concepts and theories have shaped many traders strategies and trading plans to this day. And with a new era of easy access trading, in which nearly anyone with a wifi connection, and computer, or smartphone an trade hundreds of markets brings a light to traders known as retail traders. Which according to Credit Suisse, have accounted for a third of all stock market activity in the United States at points this year. This means that Retail traders are now a community of “market players” that are knowledgeable investors who seek to learn and incorporate their own trading strategies into the market.
This newfound significance of retail traders in the market prompted me to consider a new concept, which I've dubbed the "retail theory." This theory combines the theory that intraday traders move market prices, and if we can figure out what the majority of these retail traders are doing, we can trade based on other traders rather than the actual financial instrument. This notion may be difficult to grasp, so let's break it down.
Let's say there are ten people who can pick any color from a bag. Out of the ten people, Yellow is the favorite colour of two people, blue is the favourite colour of one person, and red is the favourite colour of seven people. Let's pretend we had to bet on which colour the majority of those ten people would choose. While it's evident that we'd all bet on red to win because it's the most popular color, but how does this apply to the markets?
While traders, as we all know, use a variety of indicators to determine where to buy and sell. Some of the most popular indicators that majority of traders use are the moving averages, exponential moving averages, bollinger bands, fib levels, pivot points, vwap, etc. Now tt's impossible to say which indicators are preferred by the majority of traders, but if the majority of indicators align at a certain level, we may infer that the majority of traders will be looking to buy or sell at that level. This is where the indicators-based support and resistance indicator (I know, bad name, but I'm not that creative) comes into play. We can get a good indication of where the bulk of traders will be looking to add or sell by looking at the top indicators on the market and seeing if they are within range of each other. When this is combined with the basic theory of trends, we are able to gain a competitive advantage in the market that few traders have, known as an edge.
If you have any questions based on this theory let me know, but as I said before this theory is based on the concept that we are trading based off majority of what other traders think or are trading off of, not what we think
How It Works:
This indicator checks to see if other types of support and resistance indicators, such as the EMA, VWAP, FIb levels, and so on, are within range of one another. Simply put, when two indicators are within range of each other, a box will appear indicating where they are matching. The color of the box is determined by the number of indicators that line up within the same range, which can be adjusted with user input.
The user also has free range to change all input settings
How To Use:
This is a form of resistance and support indicator that should be used in conjunction with other technical tools. Each box color shows the number of indicators that are aligned with one another. A yellow box, for example, indicates that six or more indicators are within range of each other, but a white box indicates that only two indicators are within range of each other.
These boxes that appear should just be used as a type of support and resistance, but again you can see the strength of the support and resistance by the color.
Notes:
I came out with the concept version about a month ago, and since then it has been nothing but prefect for me. I found with 5 or more indicators line up within each other, then that area tends to be a key "dip buy" area for me. Also acts as a extremely powerful support or resistance if the indicator lines up with trendlines, or horizontal daily supports

Quansium Series A BacktestThis comes with preconfigured setups or strategies. Simply choose one from our list based on the timeframe it was made for. Leverage can be changed; to keep trading safe, a maximum of 2 is allowed. In our findings, this was able to trade crypto (specifically BTC ), MES (Micro E-mini S&P 500 Index Futures ), and stocks. It is important to know that setups A, B, C, and D use variable position sizing, and dynamic stop loss/trailing stop/take profit, these parameters are provided through the alerts. The rest of the strategies were created with a simpler approach in mind, just plainly entry/exits signals.
Quansium as a framework:
Price reformat: we take the price source (Open, Close, High, Low) and remove any noise that affects the accuracy of our signals.
Time awareness: we take several time periods of the data on the chart such as start, end, and whole. We use this to add more depth to our signals.
Position size: our backtest tries to recreate as much as the real world trades as possible so our position is determined by the current equity. We also use the volatility of the market to increase or decrease our exposure or risk.
Risk awareness: stop loss, take profit, trailing stop are the risk exits we use to provide our users some peace of mind. These parameters are totally dynamic and follow the same behavior of the market.
Signals filtering: to make almost non-existent any errors and increase the quality of our trades, our indicators go through multiple phases, this avoid double entries or early exits, and help maintain a record of what has transpired and what’s currently taking place.
Indicators: whenever we can we use custom code or our own functions instead of the defaults ones provided. This gives us total control of what we’re trying to achieve. In many cases we tend to combine several indicators’ logic into one creating a more personalized take on it.
Easiness: since we started our main goal has been to provide the easiest and fastest way to alerts’ creation. It has taken us years to reach this level where now we already provide a list of preset strategies so the user doesn’t have to spend much time tinkering with scripts and more on other matters, because we know life is more than just trading.
Raw signals: we provide the option to turn off as much of our advanced features such as stop loss, take profit, trailing stop, dynamic sizing, etc, etc for a simple approach. Trade signals still go through the signals filtering method mentioned above,
Timeframe pairing: we take trading very seriously, by no way we’ll want the user to lose money (although such thing is expected because past results aren’t an indicative of futures ones), through years of experience we have found what are usually common mistakes the user makes, this feature allows us to only activate the strategy if the right timeframe is chosen.
Trend filters: through the years we have improved the arts of the trend. We like to keep things simple but yet powerful. We observe the macro and micro trend of the security. This helps confirm we are entering at the desirable timing. We also incorporate volume and volatility into decision making, we simply programmed it to trade when these are increasing and higher than the average values observed in both the short and long term. Finally we take into account the strength of the pair to make our final choice of whether to enter or wait, and if anything flashes contrary movement then we cancel the upcoming signal and stop monitoring until the next one comes along.
Full automated risk: stop loss, take profit, and trailing stops usually are set in percentages, and optimized even more using the current market behavior to become more adaptive. But always remains some sort of fixation, so the user must choose a value somewhere. This is where our framework shines the most, as previously mentioned before when we take time into our calculations, we use several periods to observe performance and get values that keep our risk exits natural and closest to the flow of the market itself.
Setups:
A: Centered oscillator with the difference of several moving averages with more sensitive settings. Momentum focused.
B: Centered oscillator using simple moving averages. Trend-Following focused.
C: Centered oscillator using smoothed data with the help of faster moving averages. Trend-Following focused.
D: Centered oscillator with the difference of several moving averages with less sensitive settings. Trend-Following focused.
E: Centered oscillator with the difference of moving averages where the standard deviation is applied first. It uses less sensitive settings. Trend-Following focused.
F: Finds the relationship between multiple readings of the price’s relative strength to better pin-point downs and ups. Trend-Following focused.
G: Centered oscillator with the difference of moving averages where the standard deviation is applied first. It uses more sensitive settings. Momentum focused.
H: Multiple centered oscillators using various moving averages. Trend-Following focused.
I: Centered oscillator using simple moving averages. Momentum focused.
Note: The framework is composed of almost 1000 lines of code as compared to each indicator that makes up the setup which is around 10. The power from Quansium doesn't come from the strategies themselves but rather the overall system that turns simple signals into complex and advanced trades.
Strategy Tester:
Initial Capital: chosen value is $20,000, as an approximate to Bitcoin’s ATH (All-Time High). In previous iterations we noticed some trades won’t go through if the capital was less than the ATH.
Order Size: 100% of equity (although the script controls this, and this is of no regards to the results).
Pyramiding: 1, system doesn’t place multiple entries in a row, only one at a time.
Commission: This simulates order execution with custom trading fees. Commissions are turned off by default because this script works in various markets and each operates differently. In order to reach results that are close to real world conditions, it is imperative the user fills this based upon their broker or exchange data.
When we started, we were focused on finding the best indicator, or creating it ourselves. After years we came to realize that the secret is not in which indicator you use but the framework behind it. All strategies have bad, good, best, worst performance periods. The key of a good system is to help keep you safe when it’s down and maximize your potential when it’s up. We hope this material at the very minimum inspires you to keep going and not lose faith, because it is not the smartest who win but those who persevere.

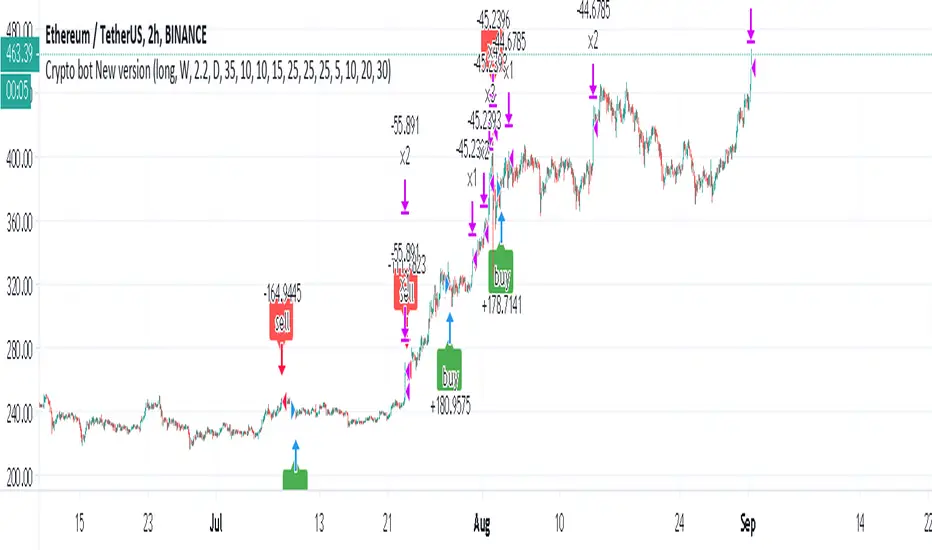
Crypto bot New versionOk this strategy is for those who want to take risks but to do it smartly
based on a modified version of as buy entry
the exit is mix of highest of pivot and fib level (similar to pivot bot that i put early but with my improve setup)
this bot is non repaint one as no security attach to it
set to 10% of lot and 10X levrage
it very good for longs (quite shity for shorts:)
the exit control by high time frame and the factor (set to 2.2)
the buy is control bu HTF
this is my setting for Ethereum
the take profit is set to take at each point 25% and then to move forward with it (5,10,20,30%)
in a bullish market as we are now this is logical setting. in bearish one you need to set your target lower
there is no repaint here
as you see the strategy start from 2018 when ether was around 1300 and despite what happen in the market it was making very decent profit
Risk management is key for winning so if you use my strategy be aware that this strategy is a very slow one but in long term seems to be very good
try to find the settings that suite you
use the factor to see if it make the exit better or worse
the strategy can work on other assets not just crypto but you need to find the best settings for it
LuxAlgo® - Signals & Overlays™Signals & Overlays™ is an all-in-one toolkit made up of more than 20+ features primarily focused on generating useful signals & overlays to fulfill any trader's technical analysis needs with relevant data.
Created directly with TradingView Pine Script Wizard, alexgrover - this is a first of its kind comprehensive script made fully from the ground-up to provide an all-in-one solution for traders.
Signals & Overlays™ can be used alongside other forms of technical analysis, however, it was also designed to be used as a stand-alone toolkit that can fit any trading style. Every feature included considers how not all technical indicators fit every market condition.
The ideal way to utilize this indicator is to explore through all of the features over time, pick & choose 2-3 features best suit your style of trading, and stick with those to create your own unique LuxAlgo trading strategy.
Providing Endless Possibilities Catering To All Trading Styles
Signals & Overlays™ works in any market for discretionary analysis & includes many features:
Beginner-friendly Presets to enable multiple features at once within one-click (locks other settings when enabled).
Confirmation Signals: Normal & Strong signals to help traders confirm trends (not to be followed blindly).
Contrarian Signals: Normal & Strong to help traders spot reversals (also not to be followed blindly).
Exit Signals: "x" marks that apply for both Confirmation Signals & Contrarian Signals to suggest potential take-profit areas during signals.
Signal Optimization Methods: Sensitivity / Agility, optimal sensitvity parameter displayed on dashboard, and Autopilot (dynamic setting).
Candle Coloring: Purple/Green/Red to visualize trends developing between 'normal' & 'strong'.
6+ Indicator Overlays that helps traders visualize trends, find reversal points, and get dynamic areas of support & resistance.
Filters within "Presets / Filters" to allow users to filter Confirmation Signals with Indicator Overlays & other metrics within LuxAlgo Premium.
A complete dashboard with highly actionable metrics such as Trend Strength, current volatility, volume analysis, etc.
Advanced Settings to display customizable TP/SL points, further enhance signal optimizations, & customize dashboard size/location.
Full Any Alert() Function Call Conditions included
Highly useful Filtered Alert Creator section to generate custom filtered signal alerts with Indicator Overlays & other metrics.
+ more. (Check the changelog below for current features)
🔶 USAGE
Basic Signals & Candle Coloring Demonstration
In the image below we can see a basic example of how these 2 core components function within Signals & Overlays™.
As explained earlier, the Confirmation Signals can generate normal labels as well as strong labels marked by the "+" symbol. These signals are directly correlated to the candle coloring in order to see the development of trends & navigate through different market conditions as best as possible.
The candle coloring comes especially in handy when using signals, whereas a positive sign for an uptrend to occur rather than a fake-out is to see candles consistently hold as green. This indicates the market is strong & is likely to continue an uptrend. Vice versa for sell signals & the candles holding as red.
Normal Confirmation Signals often occur with smaller trends, retracements within larger trends, or just as signals a user may not want to trust as much directly. In order to enhance your ability to trust signals more & find more actionable use cases out of LuxAlgo Premium, we recommend going to the settings menu of the indicator & activating some indicator overlays. These are covered in the next section.
🔶 INDICATOR OVERLAYS W/ SIGNALS
In the image below we have enabled the "Smart Trail" & "Reversal Zones" indicator overlays from within the settings of Signals & Overlays™. By using these overlays alongside the signals & candle coloring, users can find more confluence to create trading strategies or plans.
The Smart Trail provides an excellent area of dynamic support/resistance for traders, as well as an additional confluence for general trend following purposes alongside the Confirmation Signals.
The Reversal Zones are particularly useful for areas to immediately take profit on trades, however, during strong trends price may continue rising or falling through the Reversal Zones which makes a good use case of waiting for price to first exit the Reversal Zones before considering the next move in the market.
In the next image below we can see the market is generally ranging, making it more complicated for the standard Confirmation signals to perform greatly as they are meant to excel for finding developing trends. This image displays the Contrarian Signal Mode, Contrarian Gradient candle coloring, as well as the Trend Catcher Indicator Overlay to help us trade these market conditions specifically.
Paired with the Contrarian based candle coloring, these signals can be helpful to a trader looking to find confluent reversals. You can also see the Trend Catcher indicator overlay gives a hybrid approach to analyzing the underlying trend within this price action.
Some traders naturally are Contrarian in nature, so this signal mode may be of primary interest to them, however, most of the use cases will come from the standard Confirmation sigals paired with other overlays or regular technical analysis.
🔶 SIGNALS WITH AI CLASSIFICATION
Our toolkit is able to classify generated signals using a simple machine learning algorithm into four levels. These levels indicate if a signal will most likely indicate a trend continuation (level 3/4) or a reversal/retracement (1/2).
Users are able to filter out certain signals depending on their classification, only keeping signals of interest and potential filtering out false signals.
🔶 FILTERS
In the next image below we can see after resetting the Signals & Overlays™ indicator to it's defaults, we have simply enabled the "Smart Trail Filter" from within the Presets / Filters section at the top of the settings.
By doing this, we can filter out signals that are not aligned with the Smart Trail indicator overlay, which gives direct confluence in every signal that generates on the chart.
Applying filters to signals do not necessarily make them instantly "better" than using the indicator without them. Between every technical indicator, there are trade-offs. So while we can now use Confirmation signals & retests of the Smart Trail as great optimal entry points, at times the indicator may miss signals or retests of the Smart Trail.
The same is seen below with another one of the Filters within Signals & Overlays™; Trend Strength Filter.
We can see the indicator is using the Trend Strength metric to only generate Confirmation Signals that align with a trending market which can clean up a lot of noise during retracements as well as ranging markets.
However, the trade-off present now with this filter enabled is that at times the indicator will miss trends, in which we'd still need to be aware of the price action, candle coloring, or other forms of analysis to give us indications the market may start a new trend opposed to just relying on signals directly.
🔶 CONCLUSION
We believe that success lies in the association of the user with the indicator, opposed to many traders who have the perspective that the indicator itself can make them become profitable. The reality is much more complicated than that.
The aim is to provide an indicator comprehensive, customizable, and intuitive enough that any trader can be led to understand this truth and develop an actionable perspective of technical indicators as support tools for decision making.
You can see the Author's instructions below to get instant access to this indicator & our LuxAlgo Premium indicator suite.
🔶 RISK DISCLAIMER
Trading is risky & most day traders lose money. All content, tools, scripts, articles, & education provided by LuxAlgo are purely for informational & educational purposes only. Past performance does not guarantee future results.

Price alertThis indicator is an indicator for setting alerts.
Set alerts after adding them to the chart.
By setting an alert, you can notify the closing price to your smartphone or smartwatch.

DH: (Strategy) Super SmartSuper Trend: Backtest VersionSUPER SMART SUPERTREND (Strategy Version w/ Backtesting)
Across all time frames and assets I've tested, this indicator gives me better results... Better entries, better exits and well defined trends. In comparison with a STANDARD Supertrend, it is not radically different, but when it does differ "Super Smart SuperTrend" is almost always better.
This is the STRATEGY version of "Super Smart SuperTrend" ready for your backtesting. There is also a STUDY version with ALERTS which might be better for live trading if you want Alerts.
STUDY VERSION WITH ALERTS IS HERE
##################################
##################################
ABOUT THIS INDICATOR
As the name suggests, 'Supertrend' is a trend-following indicator that is notably popular here on Tradingview and elsewhere. It does a remarkably great job of recognizing a trend (in progress) and it will signal you to initiate a position when the trend is clear. Perhaps the greater value of Supertrend is that it helps keep you in your position until that trend is over.
WHAT'S THE BEST ATR PERIOD AND MULTIPLIER?
There are two important data points we must enter for Supertrend to work, namely the 'period (ATR number of candles or days)' and the 'multiplier (value by which ATR is multiplied)' BTW, in case you don't know, ATR signals the degree of price volatility. A common default setting is 10 for the ATR period and 3 for the multiplier.
SORRY, BUT THE MOVIE STARTED HALF HOUR AGO...
Unfortunately Supertrend has a couple of big weaknesses. Generally, it fails in a sideways-moving market and when it does detect a trend, the signal to get in (or out) comes rather late. It's like someone telling you about a great movie they're watching, but by the time you start watching, one-third of the movie is over... bummer, right?
HOW TO IMPROVE SUPERTREND
One solution is to combine Supertrend with other indicators such as MACD, Parabolic SAR, RSI, etc. And another solution is to experiment (backtest) with the Period and Multiplier settings for the asset and timeframe you are considering for trade.
For the STANDARD SETTINGS in this "Super Smart SuperTrend" indicator, I have set 9 for the ATR and 2.2 for the multiplier as default after backtesting on Bitcoin and other crypto (mostly in the 15 minute to 6 HOUR timeframe). Of course you can change this easily to any ATR period and Multiplier you like.
BUT... WHY NOT GET SMART?
I started thinking, it might be best if we let the market determine candle-by-candle what the settings should be. If everyone says that Supertrend works best in conjunction with other indicators, why not do our "conjuncting" programmatically (ie: automatically) sorta like artificial intelligence!
HOW IT WORKS
So here's what I did. Using data from other indicators I came up with a SMART SUPERTREND that auto-adjusts as the market changes. It still has settings so you can fine tune it for specific assets and timeframes, but once the settings are entered, it auto-adjusts as the market and prices evolve.
With "Super Smart SuperTrend" there is no ATR period setting (that is determined programmatically) and now there are TWO multipliers you can experiment with... (a lower one set at 1.7 default and a higher one at 2.5). These multiplier settings create a multiplier range that can be used programmatically to adjust the multiplier as the market and prices evolve.
THE RESULTS
Across all time frames and assets I've tested, I generally get better results. Better entries, better exits and well defined trends. In comparison with a STANDARD Supertrend, it is not radically different, but when it does differ "Super Smart SuperTrend: is almost always better. All this is substantiated by backtesting of course.
SAMPLE BACKTEST RESULTS (BTC/USD)
*Using Indicator Defaults*
TIMEFRAME STANDARD RESULTS SUPER SMART RESULTS
% Profitable | Profit Factor % Profitable | Profit Factor
DAY 58.33% 9.38 75.00% 10.77
4 HOUR 78.43% 18.22 80.95% 21.78
1 HOUR 74.11% 8.98 70.13% 9.34
15 MIN 58.10% 6.10 71.43% 9.48
Keep in mind that "Profit Factor" is key. It basically tells you what you'd make for every ONE DOLLAR invested by consistently trading with the backtested parameters.
SUPER SMART SUPERTREND FEATURES
• There is a STUDY VERSION w/Alerts
• There is a STRATEGY VERSION for Backtesting
• Standard 'Current Time Frame' SuperTrend Line
• Standard 'Higher Time Frame' SuperTrend Line
• Auto-Adjusting Dynamic Optimized SuperTrend Line
> Most Signals Are Same or Better than Standard
> Refine Results w/Sensitivity Inputs (2 Multipliers)
> Impressive Comparison Backtests
• Both Standard and Smart Signals and Alerts
• Toggle Any Line/Signal (On/Off)
• Toggle Backtest
> Standard vs. "Smart Auto-Adjust"
> Backtest Higher Timeframe Only
WHAT MORE COULD YOU ASK FOR?
So glad you asked. Actually, there is more... Super Smart SuperTrend is incorporated into my premier indicator set called: STONEHENGE PLUS: SUPERTREND TRADING TOOLKIT.
By combining Super Smart SuperTrend with dozens of other indicators plus the predictive "Stones" of Stonehenge, you'll be in Trader's Heaven.
That's it. Get "SMART" Today!
STONEHENGE PLUS:
The Complete SuperTrend Trading Toolkit
#################################
#################################
SUPER SMART SUPERTREND ALSO WORKS WITH:
STONEHENGE BASIC: Double Stone Version (Study w/Alerts):
PLEASE HIT THE LIKE BUTTON (and follow me... lots of great stuff in the works!)
As always, I appreciate your support. Please share with others.
ENJOY!
Dan Hollings
Master Crypto Grid Trader
Stonehenge Master Mason
Host of the "High Leverage Lounge"
Please Explore My Other Indicators, Scripts, Grids and Educational Ideas.
@DanHollings on Tradingview.
Additional Links Below...

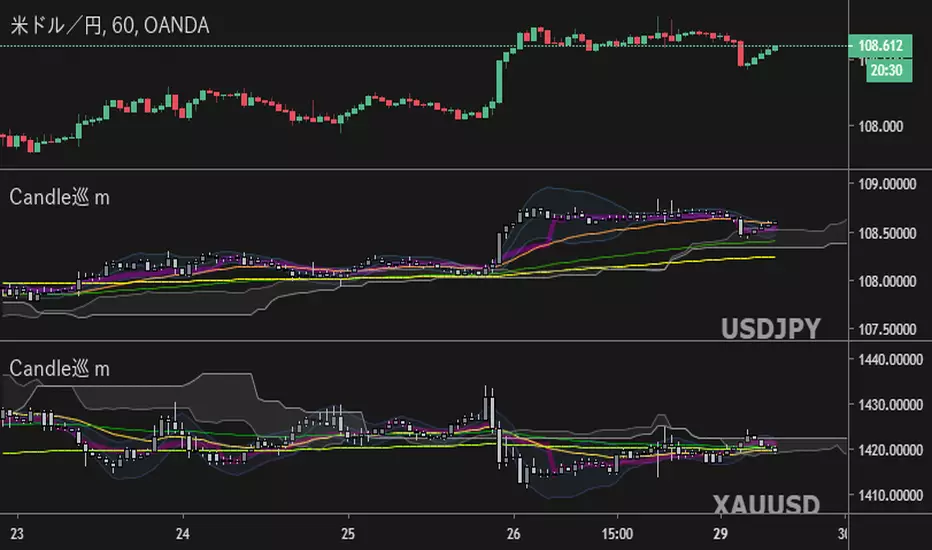
Candles [Meguru] MobileMulti-currency Indication For mobile "Candles[Meguru]Mobile"
The display of exchanges and major currencies has been made selective. (I thought about the use with a smartphone etc. and made it possible to omit the trouble of character input. It is also possible to enter manually.)
モバイル向け多通貨表示インジ『Candles[Meguru]Mobile』
取引所やメジャーな通貨の表示を選択式にしました。(移動時・スマホなどでの利用を考え、文字入力の手間を省略できるよう作成しました。手入力での設定も利用できます。)
反転チャート・時足の固定も可能です。
複数表示することで、多通貨を同時に表示・監視することもできます。
詳細、購入などはこちらにて
note.mu
XT AI Trading System for XBTUSD (BitMEX)- Features:
+ XT-AI-TRADE System with special built-in XT-AI Trend line, trend cloud indicator for XBTUSD (BitMEX) with the best performance.
+ Full backtesting from April 2018 with results as below:
Time frame / Net profit / Percent profitable / Profit factor
H1: 450% / 80% / 74.187
H2: 445% / 100% / Max
H3: 778% / 80% / 17.264
H4: 624% / 85.71% / 119.905
D1: 169% / 100% / Max
+ Separately optimized AI trading algorithm for different time frames: H1/H2/H3/H4/D1 (including Margin and Exchange Trading).
+ Trustworthy backtesting accuracy result with 100% non-repainting, no difference between backtesting and live trading.
+ Real-time push notification system: Email / Telegram... to your PC and Smartphone => Enjoy trading life.
+ 24/7 business operation.
*** Sign up for a trial here : goo.gl

Explosive Signals Version 2.0 Power - Features:
+ Optimized trading methods for multiple time frames 5M 15M 1H 4H (including Margin and Exchange Trading).
+ EST_V2 can be used to track all financial markets (Crypto, Stock, Forex, ...)
+ EST_V2 can be used to track all altcoins trading pairs
+ The tool is based on the average formula, combined with trend-changing signal processing algorithms with calibrated parameters of the experienced team.
+ Real-time push alert system + Email + Popup on your desktop, laptop, tablet and smartphone => have time to enjoy trading live.
+ Our system runs 24/7.

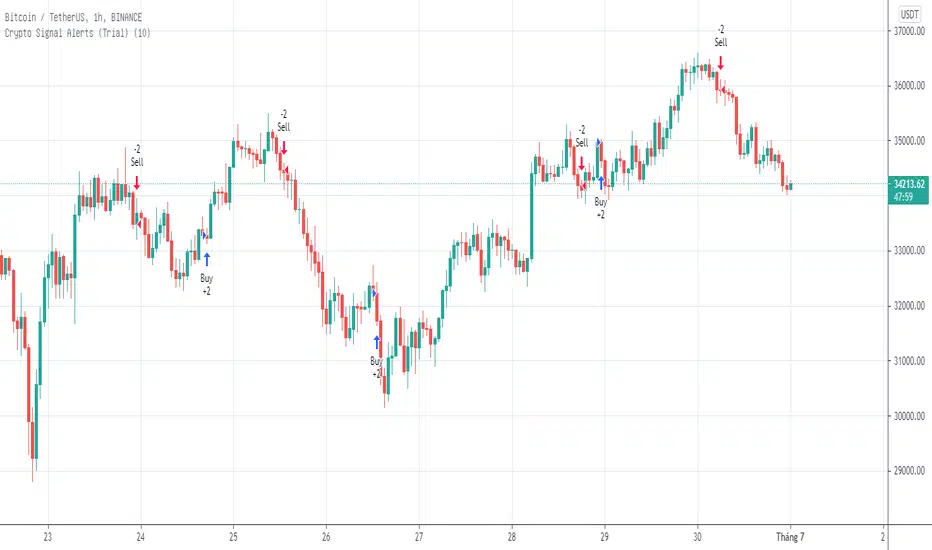
Crypto Signal Alerts ( Trial )- Features:
+ Optimized trading methods for multiple time frames 5M 15M 1H 4H (including Margin and Exchange Trading).
+ Build the rule of Stoploss / Takeprofit according to the risk management method according to the trader's strategy.
+ Real-time push alert system + Email + Popup on your desktop, laptop, tablet and smartphone => have time to enjoy trading live.
+ Our system runs 24/7.
*** Sign up for a 3-day trial here : goo.gl
Crypto Signal Warnings ( Margin/Exchange )Crypto Signal Alert is an intuitive and easy-to-use graphing buying tool that helps traders save time and maximize profits ^$$$^
- Features:
+ Optimized trading methods for multiple time frames 5M 15M 1H 4H (including Margin and Exchange Trading).
+ Build the rule of Stoploss / Takeprofit according to the risk management method according to the trader's strategy.
+ Real-time push alert system + Email + Popup on your desktop, laptop, tablet and smartphone => have time to enjoy trading live.
+ Our system runs 24/7.
*** Sign up for a 3-day trial here : goo.gl
