Rastreador de tendência - Trend TrackerRastreador de tendência que mede sua força em função da inclinação do movimento direcional.
This trend tracker measures trend strength according to directional movement inclination.
Поиск скриптов по запросу "track"

Ehlers Optimal Tracking FilterThe original script was posted on ProRealCode by user Nicolas.
Dr. R.E. Kalman introduced his concept of optimum estimation in 1960. Since that time, his technique has proven to be a powerful and practical tool. The approach is particularly well suited for optimizing the performance of modern terrestrial and space navigation systems. Many traders not directly involved in system analysis have heard about Kalman filtering and have expressed an interest in learning more about it for market applications. Although attempts have been made to provide simple, intuitive explanations, none has been completely successful. Almost without exception, descriptions have become mired in the jargon and state-space notation of the “cult”.
Surprisingly, in spite of the obscure-looking mathematics (the most impenetrable of which can be found in Dr. Kalman’s original paper), Kalman filtering is a fairly direct and simple concept. In the spirit of being pragmatic, we will not deal with the full-blown matrix equations in this description and we will be less than rigorous in the application to trading. Rigorous application requires knowledge of the probability distributions of the statistics. Nonetheless we end with practically useful results. We will depart from the classical approach by working backwards from Exponential Moving Averages. In this process, we introduce a way to create a nearly zero lag moving average. From there, we will use the concept of a Tracking Index that optimizes the filter tracking for the given uncertainty in price movement and the uncertainty in our ability to measure it.
Credits to: www.prorealcode.com

Average Cost (Costo Promedio)ENGLISH
This 'Average Cost' script allows the user to input and visualize profit or loss for different stocks (up to 50) with average cost and quantity data on a single chart. This is useful for tracking the profit or loss of each stock in real-time.
To use this script, the user should follow these steps:
1. Add the 'Average Cost' script to your TradingView chart.
2. In the script's configuration window, input the tickers, average costs, and quantity of shares for each ticker you want to monitor.
3. Click 'Accept' to apply the changes.
This script is primarily designed for stock markets, but can also be useful in other financial markets where the user is interested in tracking the performance of multiple assets.
ESPAÑOL
Este script de "Costo Promedio" permite al usuario ingresar y visualizar si hay ganancia o perdida para diferentes acciones (hasta 50) con los datos de costos promedio y cantidad de acciones en un solo gráfico. Esto es útil para realizar un seguimiento de la ganancia o pérdida de cada acción en tiempo real.
Para utilizar este script, el usuario debe seguir estos pasos:
1. Agregue el script "Costo Promedio" a su gráfico en TradingView.
2. En la ventana de configuración del script, ingrese los tickers, costos promedio y cantidad de acciones para cada ticker que desee monitorear.
3. Haga clic en "Aceptar" para aplicar los cambios.
Este script está diseñado principalmente para los mercados de acciones, pero también puede ser útil en otros mercados financieros donde el usuario esté interesado en rastrear el rendimiento de múltiples activos.

Wyckoff Trend Tracking Market HarvesterWyckoff Trend Tracking Market Harvester该工具旨在服务对市场趋势分析要求精益求精的用户。Wyckoff Trend Tracking团队融合多位国内外顶尖趋势分析专家,致力于趋势分析数十年,将最好的作品呈现给尊贵的您。
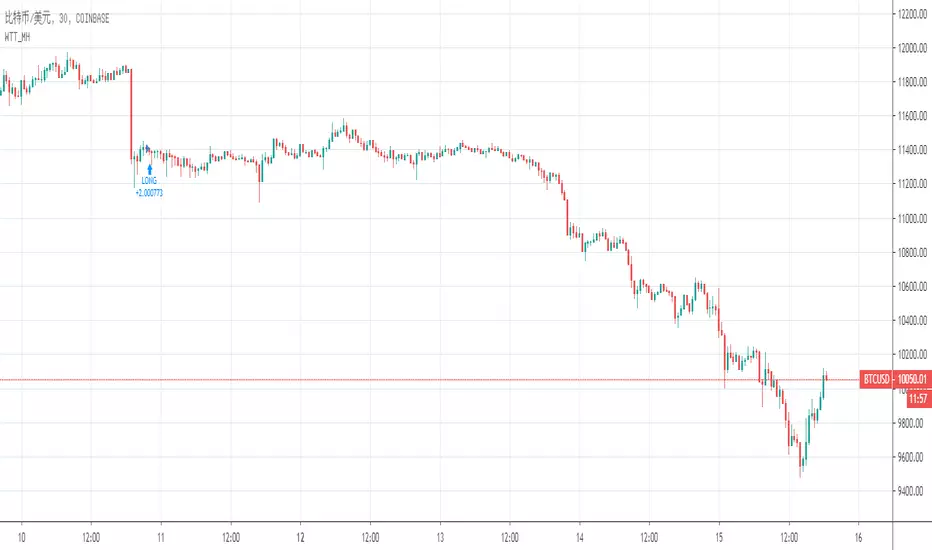
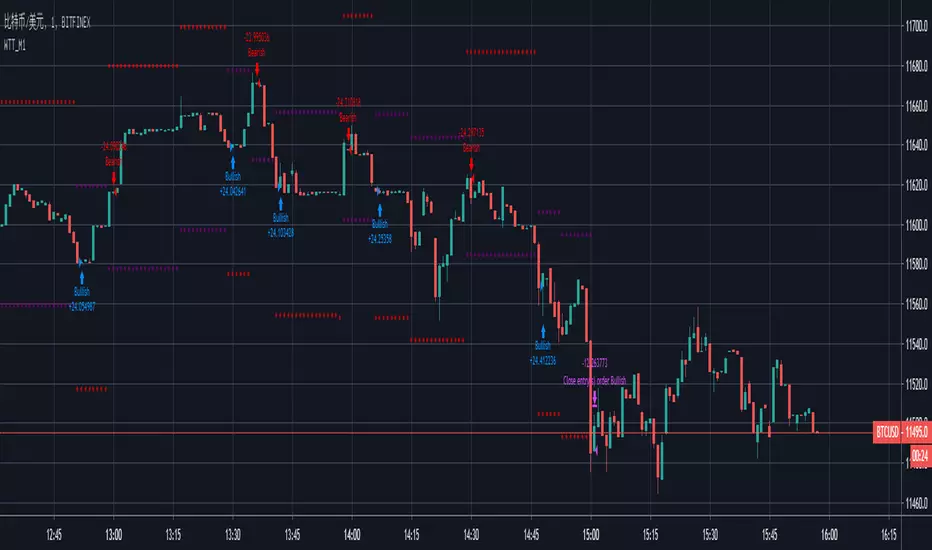
Trend Profit Tracking——JackFinanceTrend Profit Tracking Indicator Usage Guide1. Chart Interpretation and UsageSignals: Green "Buy" (below bar) for long entry; red "Sell" (above bar) for short entry or close long. Based on ATR stop reversal.
Trend Line: Green = bullish (support); red = bearish (resistance); gray = neutral.
Background: Light green/red = trend environment.
Filter Band: Green fill confirms bullish; red confirms bearish. Signals more accurate when price is inside the band.
Volume: Yellow bars = unusual volume spike; combine with signals for reversal hints.
Table (top-right): Bullish; Bearish; Neutral.
2. Trading ApplicationEntry: Signal + matching filter band color (green for long, red for short).
Exit: Reverse signal or price hits trend line/band edge.
Stop-Loss: Use built-in trailing stop; ATR multiplier for position sizing.
Best For: Daily/4H trend charts; avoid choppy markets.
Backtest: Verify in strategy tester (~55-65% win rate with defaults).
3. TipsCombine with RSI for filters.
Trading involves risk; decide at your own discretion.

OS HiLo TrackingIndicator plots a dynamic horizontal line for tracking the highest high and/or lowest low in your desired time-period.
You can select both the period, and whether an alert is produced when the price crosses the last highest high or lowest low.
When used when other Williams indicators, this can help you set your trailing stop for profit-taking.


Wyckoff Trend Tracking Dragon EyeWyckoff Trend Tracking Dragon Eye 该指标融合多种算法于一体,结合该指标,趋势结构尽收眼底,展现给您丰富而强大的体验。

Wyckoff Trend Tracking Crazy RocketWyckoff Trend Tracking Crazy Rocket 该策略可以保持良好的盈利能力,且不重绘。带您驰骋各种市场。

Wyckoff Trend Tracking Treasure Box X2Wyckoff Trend Tracking Treasure Box X2 这绝对是一款值得您拥有的指标,在茫茫的金融市场中,她为您点亮了一盏明灯。

Wyckoff Trend Tracking Super LayerWyckoff Trend Tracking Super Layer 该指标为您揭示了日、周、月、年的支撑和阻力的可能位置,帮助您更好地持赢止损。

Wyckoff Trend Tracking Accumulated VolumeWyckoff Trend Tracking Accumulated Volume 该指标集合了量价的密秘,帮助您识别市场中累积的量价趋势。

Wyckoff Trend Tracking Devergency OscillatorWyckoff Trend Tracking Devergency Oscillator 该指标是一款研究震荡行情的有力工具,她可以帮您如鱼得水地在震荡行情中找到趋势。

Wyckoff Trend Tracking Treasure Box X1Wyckoff Trend Tracking Treasure Box X1 这不是一个指标,这是一套系统。她汇聚了华尔街上百年的智慧,相信您与她相伴越久越会爱上她的。

Wyckoff Trend Tracking Trend ExtrapolaterWyckoff Trend Tracking Trend Extrapolater 该指标是利用趋势外推帮助我们进一步确认趋势。特别注意指标线与0.8/0.2水平线的交叉点。


Wyckoff Trend Tracking Renko with TimeWyckoff Trend Tracking Renko with Time 该指标用于计算砖形图每个砖块的时间。必须与砖形图配合使用效果才会体现。

Wyckoff Trend Tracking Renko VolumeWyckoff Trend Tracking Renko Volume 该指标用于计算砖形图每个砖块的交易量。必须与砖形图配合使用效果才会体现。

Wyckoff Trend Tracking R/S ZonesWyckoff Trend Tracking R/S Zones 该指标集合了N个高级算法,寻找盘面中潜在的支撑和阻力区。它是您必备的获利利器,它非常的与众不同,它有七个关于支撑和阻力的解决方案。


