Extreme Trend Reversal Points [HeWhoMustNotBeNamed]Using moving average crossover for identifying the change in trend is very common. However, this method can give lots of false signals during the ranging markets. In this algorithm, we try to find the extreme trend by looking at fully aligned multi-level moving averages and only look at moving average crossover when market is in the extreme trend - either bullish or bearish. These points can mean long term downtrend or can also cause a small pullback before trend continuation. In this discussion, we will also check how to handle different scenarios.
🎲 Components
🎯 Recursive Multi Level Moving Averages
Multi level moving average here refers to applying moving average on top of base moving average on multiple levels. For example,
Level 1 SMA = SMA(source, length)
Level 2 SMA = SMA(Level 1 SMA, length)
Level 3 SMA = SMA(Level 2 SMA, length)
..
..
..
Level n SMA = SMA(Level (n-1) SMA, length)
In this script, user can select how many levels of moving averages need to be calculated. This is achieved through " recursive moving average " algorithm. Requirement for building such algorithm was initially raised by @loxx
While I was able to develop them in minimal code with the help of some of the existing libraries built on arrays and matrix , I also thought why not extend this to find something interesting.
Note that since we are using variable levels - we will not be able to plot all the levels of moving average. (This is because plotting cannot be done in the loop). Hence, we are using lines to display the latest moving average levels in front of the last candle. Lines are color coded in such a way that least numbered levels are greener and higher levels are redder.
🎯 Finding the trend and range
Strength of fully aligned moving average is calculated based on position of each level with respect to other levels.
For example, in a complete uptrend, we can find
source > L(1)MA > L(2)MA > L(3)MA ...... > L(n-1)MA > L(n)MA
Similarly in a complete downtrend, we can find
source < L(1)MA < L(2)MA < L(3)MA ...... < L(n-1)MA < L(n)MA
Hence, the strength of trend here is calculated based on relative positions of each levels. Due to this, value of strength can range from 0 to Level*(Level-1)/2
0 represents the complete downtrend
Level*(Level-1)/2 represents the complete uptrend.
Range and Extreme Range are calculated based on the percentile from median. The brackets are defined as per input parameters - Range Percentile and Extreme Range Percentile by using Percentile History as reference length.
Moving average plot is color coded to display the trend strength.
Green - Extreme Bullish
Lime - Bullish
Silver - range
Orange - Bearish
Red - Extreme Bearish
🎯 Finding the trend reversal
Possible trend reversals are when price crosses the moving average while in complete trend with all the moving averages fully aligned. Triangle marks are placed in such locations which can help observe the probable trend reversal points. But, there are possibilities of trend overriding these levels. An example of such thing, we can see here:
In order to overcome this problem, we can employ few techniques.
1. After the signal, wait for trend reversal (moving average plot color to turn silver) before placing your order.
2. Place stop orders on immediate pivot levels or support resistance points instead of opening market order. This way, we can also place an order in the direction of trend. Whichever side the price breaks out, will be the direction to trade.
3. Look for other confirmations such as extremely bullish and bearish candles before placing the orders.
🎯 An example of using stop orders
Let us take this scenario where there is a signal on possible reversal from complete uptrend.
Create a box joining high and low pivots at reasonable distance. You can also chose to add 1 ATR additional distance from pivots.
Use the top of the box as stop-entry for long and bottom as stop-entry for short. The other ends of the box can become stop-losses for each side.
After few bars, we can see that few more signals are plotted but, the price is still within the box. There are some candles which touched the top of the box. But, the candlestick patterns did not represent bullishness on those instances. If you have placed stop orders, these orders would have already filled in. In that case, just wait for position to hit either stop or target.
For bullish side, targets can be placed at certain risk reward levels. In this case, we just use 1:1 for bullish (trend side) and 1:1.5 for bearish side (reversal side)
In this case, price hit the target without any issue:
Wait for next reversal signal to appear before placing another order :)
Поиск скриптов по запросу "trend"

Multi-ZigZag Multi-Oscillator Trend DetectorThis table is intended to give you snapshot of how price and oscillators are moving along with zigzag pivots.
This is done in the same lines of Zigzag-Trend-Divergence-Detector
But, here are the differences
Table shows multiple oscillator movements at a same time instead of one selected oscillator
Divergence is not calculated and also supertrend based trend. Trend can be calculated based on zigzag movements. However, lets keep this for future enhancements.
This system also uses multiple zigzags instead of just one.
⬜ Process
▶ Derive multiple zigzags - Code is taken from Multi-ZigZag
▶ Along with zigzags - also calculate different oscillators and attach it to zigzag pivot.
▶ Calculate directions of zigzag pivots and corresponding oscillators.
▶ Plot everything in the table on last bar.
⬜ Table components
Table contains following data:
Directional legends are:
⇈ - Higher High (Green)
⇊ - Lower Low (Red)
⭡- Lower High (Orange)
⭣ - Higher Low (Lime)
⬜ Input Parameters
▶ Source : Default is close. If Unchecked - uses high/low data for calculating pivots. Can also use external input such as OBV
▶ Stats : Gives option to select the depth of output (History) and also lets you chose text size and table position.
▶ Oscillators : Oscillator length is derived by multiplying multiplier to zigzag length. For example, for zigzag 5, with 4 as multiplier, all oscillators are calculated with length 20. But, same for zigzag 8 will be 32 and so on.
▶ Available oscillators :
CCI - Commodity Channel Index
CMO - Chande Momentum Oscillator
COG - Center Of Gravity
MFI - Money Flow Index (Shows only if volume is present)
MOM - Momentum oscillator
ROC - Rate Of Change
RSI - Relative Strength Index
TSI - Total Strength Index
WPR - William Percent R
BB - Bollinger Percent B
KC - Keltner Channel Percent K
DC - Donchian Channel Percent D
ADC - Adoptive Donchian Channel Percent D ( Adoptive-Donchian-Channel )
⬜ Challenges
There are 12 oscillators and each zigzag has different length. Which means, there are 48 combinations of the ocillators.
First challenge was generating these values without creating lots of static initialization. Also, note, if the functions are not called on each bar, then they will not yield correct result. This is achieved through initializer function which runs on every bar and stores the oscillator values in an array which emulates multi dimensional array oscillator X zigzag length.
Next challenge was getting these values within function when we need it. While doing so I realized that values stored in array also have historical series and calling array.get will actully get you the entire series and not just the value. This is an important takeaway for me and this can be used for further complex implementations.
Thanks to @LonesomeTheBlue and @LucF for some timely suggestions and interesting technical discussions :)

Zigzag Trend/Divergence DetectorPullbacks are always hardest part of the trade and when it happen, we struggle to make decision on whether to continue the trade and wait for recovery or cut losses. Similarly, when an instrument is trending well, it is often difficult decision to make if we want to take some profit off the table. This indicator is aimed to make these decisions easier by providing a combined opinion of sentiment based on trend and possible divergence.
⬜ Process
▶ Use any indicator to find trend bias. Here we are using simple supertrend
▶ Use any oscillator. I have added few inbuilt oscillators as option. Default used is RSI.
▶ Find divergence by using zigzag to detect pivot high/low of price and observing indicator movement difference between subsequent pivots in the same direction.
▶ Combine divregence type, divergence bias and trend bias to derive overall sentiment.
Complete details of all the possible combinations are present here along with table legend
⬜Chart Legend
C - Continuation
D - Divergence
H - Hidden Divergence
I - Indeterminate
⬜ Settings
▶ Zigzag parameters : These let you chose zigzag properties. If you check "Use confirmed pivots", then unconfirmed pivot will be ignored in the table and in the chart
▶ Oscillator parameters : Lets you select different oscillators and settings. Available oscillators involve
CCI - Commodity Channel Index
CMO - Chande Momentum Oscillator
COG - Center Of Gravity
DMI - Directional Movement Index (Only ADX is used here)
MACD - Moving average convergence divergence (Can chose either histogram or MACD line)
MFI - Money Flow Index
MOM - Momentum oscillator
ROC - Rate Of Change
RSI - Relative Strength Index
TSI - Total Strength Index
WPR - William Percent R
BB - Bollinger Percent B
KC - Keltner Channel Percent K
DC - Donchian Channel Percent D
ADC - Adoptive Donchian Channel Percent D ( Adoptive-Donchian-Channel )
▶ Trend bias : Supertrend is used for trend bias. Coloring option color candles in the direction of supertrend. More option for trend bias can be added in future.
▶ Stats : Enables you to display history in tabular format.
Overview of settings present here:
⬜ Notes
Trend detection is done only with respect to previous pivot in the same direction. Hence, if chart has too many zigzags in short period, try increasing the zigzag length or chart timeframe. Similarly, if there is a steep trend, use lower timeframe charts to dig further.
Oscillators does not always make pivots at same bar as price. Due to this some the divergence calculation may not be correct. Hence visual inspection is always recommended.
⬜ Possible future enhancements
More options for trend bias
Enhance divergence calculation. Possible options include using oscillator based zigzag as primary or using close prices based zigzag instead of high/low.
Multi level zigzag option - Can be messy to include more than one zigzag. Option can be added to chose either Level1 or Level2 zigzags.
Alerts - Alerts can only be added for confirmed pivots - otherwise it will generate too many unwanted alerts. Will think about it :)
If I get time, I will try to make a video.

Trend Confirmation Dow TheoryTrend Confirmation as per Dow Theory
Summary of Logic:
✅ Bullish Trend:
Setup Bar: High > Previous High AND Low ≥ Previous Low
Confirmation Bar: High > Highest High of last 3 candles, Low ≥ Setup Bar Low
Trend Continues Until: Latest candle breaks 2nd last candle’s low → then trend becomes Bearish
🔻 Bearish Trend:
Setup Bar: Low < Previous Low AND High ≤ Previous High
Confirmation Bar: Low < Lowest Low of last 3 candles, High ≤ Setup Bar High
Trend Continues Until: Latest candle breaks 2nd last candle’s high → then trend becomes Bullish
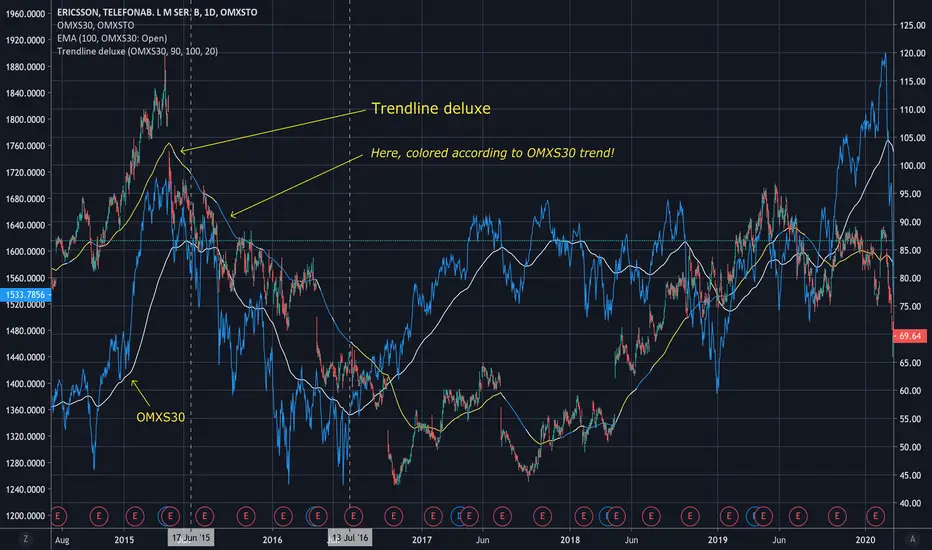
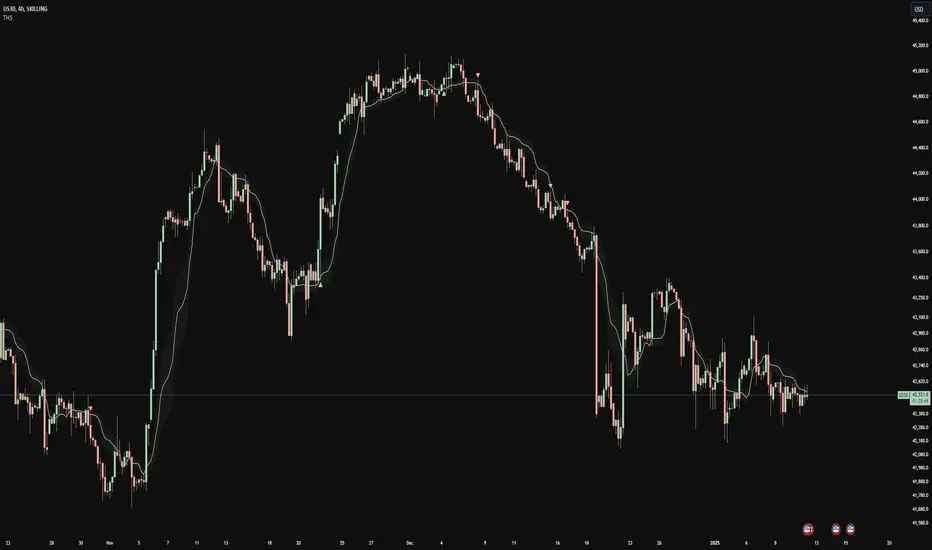
Trendline deluxeTrendline deluxe
As someone said:
"The best trend indicator is when you print the chart, put it on the wall
and take a few steps back. If you now can identify the trend you're done!"
This is an attempt of doing the same thing...
I find it handy to switch the color of the trendline depending on the where
the Trend is going. Especially when zooming in on the chart, the color tells
you what the overall Trend is.
Trendline deluxe comes with an extra twist in that it can be colored according
to your Stock index of choice, but still be plotted according to the Stock at hand.
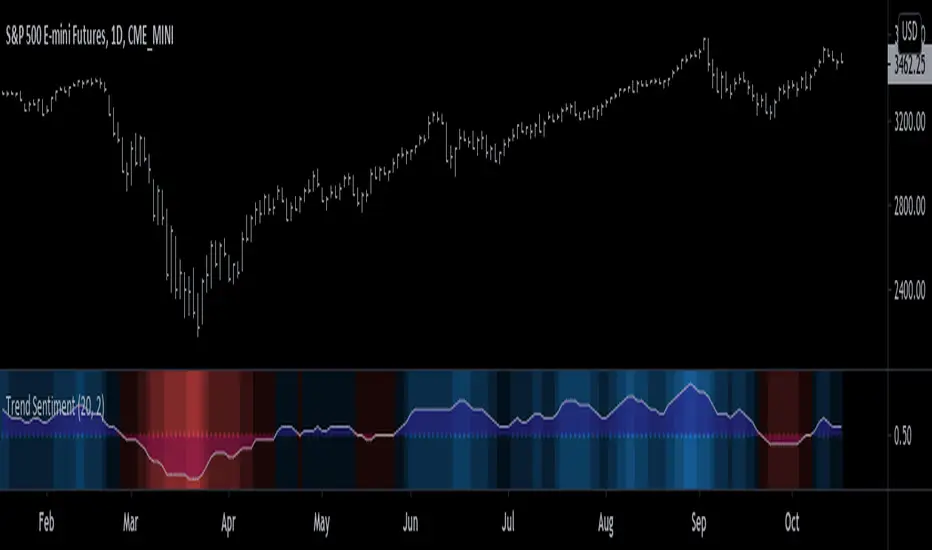
Trend Sentiment [racer8]Trend Sentiment is a trend indicator with enhanced graphics, that is, it has many different shades of blue and red.
The brighter the blue, the more bullish.
The brighter the red, the more bearish.
It is a simple indicator with a basic formula:
a = close > prev.close? ---> If yes, a = 1, otherwise a = 0.
b = sma of a over n periods -----1st parameter, n...."Length"
c = sma of b over j periods ----- 2nd parmeter, j..."Smoothing"
plot (c)
Is c > 0.5? ---> If yes, background color = blue, otherwise red.
plot background color.
plot 0.5 as dotted midline.
The Trend Sentiment value represents the percentage of bullish force in the market.
Signals are generated when it crosses the 50% mark.
Values above 0.50 are bullish and values below 0.50 are bearish.
Enjoy and hit the like button :)
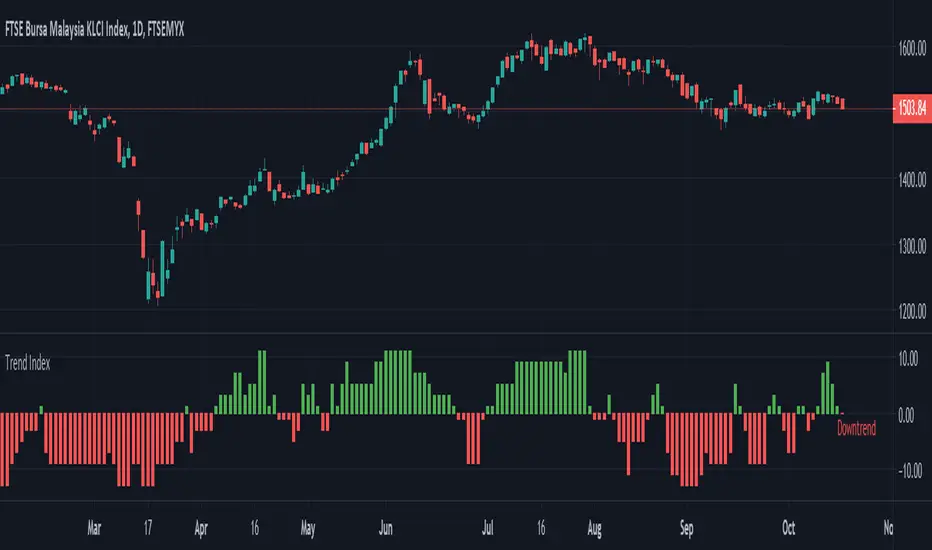
Trend Index Trend Index show trend of the instrument based on multiple indicators
- Green --> Uptrend
- Red --> Downtrend
- Gray --> No trend
Indicators used:-
Relative Strength Index (RSI)
Commodity Channel Index (CCI)
William Percent Range (WPR)
Directional Movement Index (DMI)
Elder Force Index (EFI)
Momentum
Demarker
Parabolic SAR
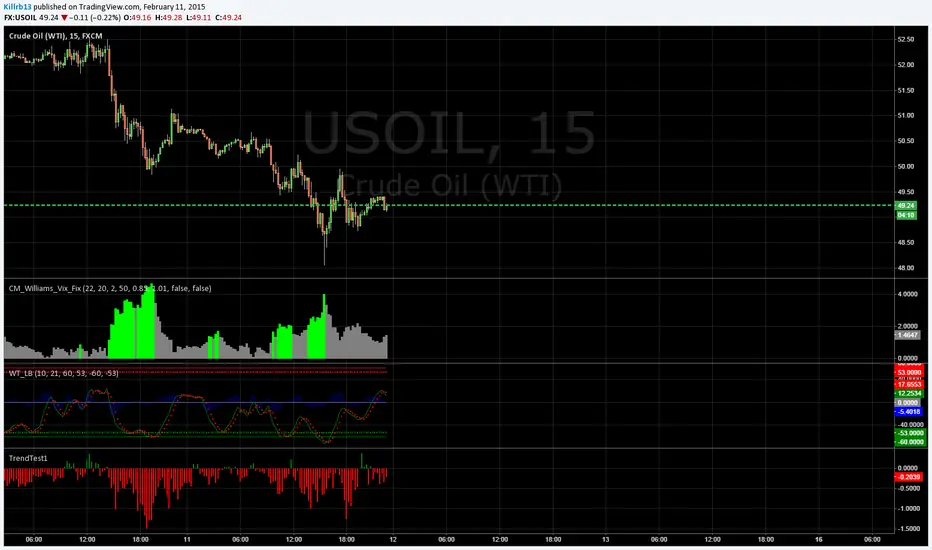
Trend Flow Oscillator (CMF + MFI) + ADX## Trend Flow Oscillator (TFO + ADX) Indicator Description
The Trend Flow Oscillator (TFO+ADX) combines two volume-based indicators, Money Flow Index (MFI) and Chaikin Money Flow (CMF), along with the Average Directional Index (ADX) into one comprehensive oscillator. This indicator provides traders with insights into momentum, volume flow, and trend strength, clearly indicating bullish or bearish market conditions.
### How the Indicator Works:
1. **Money Flow Index (MFI)**:
* Measures buying and selling pressure based on price and volume.
* Scaled from -1 to +1 (where positive values indicate buying pressure, negative values indicate selling pressure).
2. **Chaikin Money Flow (CMF)**:
* Evaluates money flow volume over a set period, reflecting institutional buying or selling.
* Also scaled from -1 to +1 (positive values suggest bullish accumulation, negative values bearish distribution).
3. **Average Directional Index (ADX)**:
* Measures trend strength, indicating whether a market is trending or ranging.
* Scaled from -1 to +1, with values above 0 suggesting strong trends, and values near or below 0 indicating weak trends or sideways markets.
* Specifically, an ADX value of 0 means neutral trend strength; positive values indicate a strong trend.
### Indicator Levels and Interpretation:
* **Zero Line (0)**: Indicates neutral conditions. When the oscillator crosses above zero, it signals increasing bullish momentum; crossing below zero indicates bearish momentum.
* **Extreme Zones (+/- 0.75)**:
* Oscillator values above +0.75 are considered overbought or highly bullish.
* Oscillator values below -0.75 are considered oversold or highly bearish.
* The indicator features subtle background shading to visually highlight these extreme momentum areas for quick identification.
* Shading when values above or below the +/-1.0 level.
* **Color Coding**:
* Bright blue indicates strengthening bullish momentum.
* Dark blue signals weakening bullish momentum.
* Bright red indicates strengthening bearish momentum.
* Dark maroon signals weakening bearish momentum.
Trendy Bar Trend ColorTrendy Bar Trend Color
Inspired by trend candlestick charts on other trading platforms. Changes bar colors to stay in trend much like Heikin Ashi candles without the ATR price distortion. This is done by comparing the HL2 and/or Open-Close values of current candlestick to the prior candlestick.

Trend Volatility Index (TVI)Trend Volatility Index (TVI)
A robust nonparametric oscillator for structural trend volatility detection
⸻
What is this?
TVI is a volatility oscillator designed to measure the strength and emergence of price trends using nonparametric statistics.
It calculates a U-statistic based on the Gini mean difference across multiple simple moving averages.
This allows for objective, robust, and unbiased quantification of trend volatility in tick-scale values.
⸻
What can it do?
• Quantify trend strength as a continuous value aligned with tick price scale
• Detect trend breakouts and volatility expansions
• Identify range-bound market states
• Detect early signs of new trends with minimal lag
⸻
What can’t it do?
• Predict future price levels
• Predict trend direction before confirmation
⸻
How it works
TVI computes a nonparametric dispersion metric (Gini mean difference) from multiple SMAs of different lengths.
As this metric shares the same dimension as price ticks, it can be directly interpreted on the chart as a volatility gauge.
The output is plotted using candlestick-style charts to enhance visibility of change rate and trend behavior.
⸻
Disclaimer
TVI does not predict price. It is a structural indicator designed to support discretionary judgment.
Trading carries inherent risk, and this tool does not guarantee profitability. Use at your own discretion.
⸻
Innovation
This indicator introduces a novel approach to trend volatility by applying U-statistics over time series
to produce a nonparametric, unbiased, and robust estimate of structural volatility.
日本語要約
Trend Volatility Index (TVI) は、ノンパラメトリックなU統計量(Gini平均差)を使ってトレンドの強度を客観的に測定することを目的に開発されたボラティリティ・オシレーターです。
ティック単位で連続的に変化し、トレンドのブレイク・レンジ・初動の予兆を定量的に検出します。
未来の価格や方向は予測せず、現在の構造的ばらつきだけをロバストに評価します。

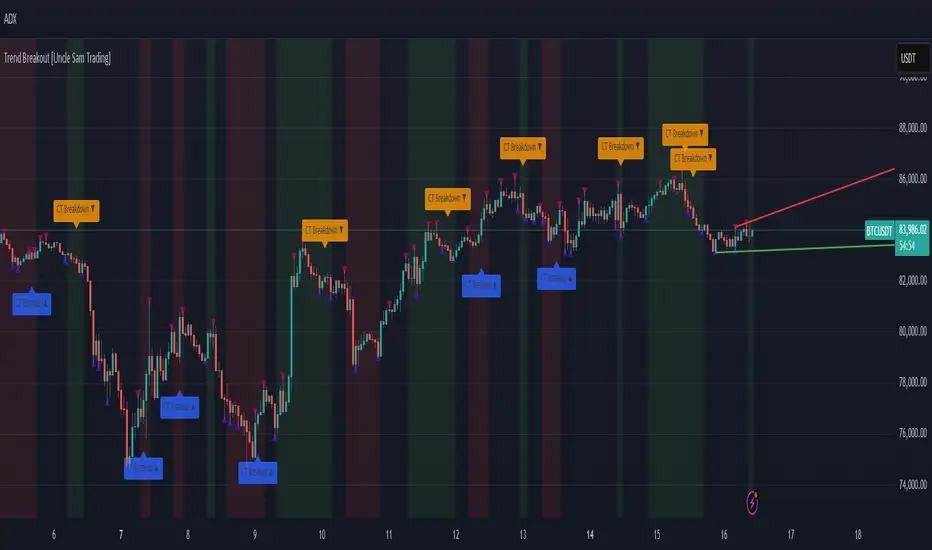
Trend Breakout [Uncle Sam Trading]Trend Breakout Indicator
Overview
The Trend Breakout Indicator is a powerful, non-repainting tool designed to help traders identify high-probability breakout and trend reversal setups on any market and timeframe. By leveraging pivot points, this indicator draws dynamic support and resistance channels, highlights counter-trend breakouts, and provides visual cues for market direction. It’s ideal for traders looking to simplify their analysis while targeting key price levels for entries and exits.
Key Features
Pivot-Based Channels: Draws a red upper channel (resistance) and a green lower channel (support) by connecting recent pivot highs and lows.
Counter-Trend Breakout Signals:
Blue “CT Breakup” signal (▲) when the price breaks above the upper channel during a downtrend, indicating a potential reversal or pullback.
Orange “CT Breakdown” signal (▼) when the price breaks below the lower channel during an uptrend, signaling a potential downmove.
Trend Visualization: Background color shifts to green for uptrends and red for downtrends, making it easy to gauge market direction.
Customizable Settings: Adjust pivot detection sensitivity with “Pivot Left Bars” (default: 5) and “Pivot Right Bars” (default: 1), and control channel extension with “Channel Extension Bars” (default: 50).
Optional Trend Signals: Enable “Show Trend Change Signals” to display trend shifts with green (uptrend) or red (downtrend) arrows.
Alert Conditions: Set alerts for counter-trend breakouts and trend changes directly on TradingView.
Example Performance (BTCUSDT, 1-Hour Chart)
On the BTCUSDT 1-hour chart:
A “CT Breakdown” signal appeared on April 6 at 8:00 AM at $82,700, followed by a drop to $74,400 within hours—a 10% move.
A “CT Breakup” signal occurred on April 9 at 1:00 AM at $76,600, leading to a rally to $86,600 in a few hours—a 9% gain.
These examples highlight the indicator’s ability to spot significant price movements, though results depend on market conditions, your trading style, and risk management.
Settings
Pivot Left Bars (default: 5): Number of bars to the left for pivot detection.
Pivot Right Bars (default: 1): Number of bars to the right for pivot confirmation (ensures non-repainting signals).
Channel Extension Bars (default: 50): How far the channels extend to the right.
Show Pivot Points (default: true): Displays small triangles at pivot highs (maroon) and lows (navy).
Show Counter-Trend Breakout Signals (default: true): Shows CT Breakup and CT Breakdown signals.
Show Trend Change Signals (default: false): Displays trend shift arrows when enabled.
How to Use
Add the indicator to your chart via TradingView’s indicator library.
Adjust the settings to match your trading style and timeframe.
Watch for “CT Breakup” and “CT Breakdown” signals to identify potential trade setups.
Use the background color (green/red) to confirm the current trend.
Set alerts for breakouts or trend changes to stay updated on key signals.
Always combine with proper risk management and your own analysis—past performance is not a guarantee of future results.
Notes
The indicator is non-repainting, meaning signals are confirmed and won’t disappear after they form.
Works on any market (crypto, forex, stocks) and timeframe, such as the BTCUSDT 1-hour chart shown.
Performance varies based on market volatility and your trading strategy.
This is a free tool created to support the TradingView community—feedback is welcome in the comments!
Disclaimer
Trading involves risk, and this indicator is not a guaranteed predictor of future price movements. Always conduct your own analysis and manage risk appropriately. The examples provided (e.g., BTCUSDT signals) are for educational purposes only and reflect past performance, which may not repeat.
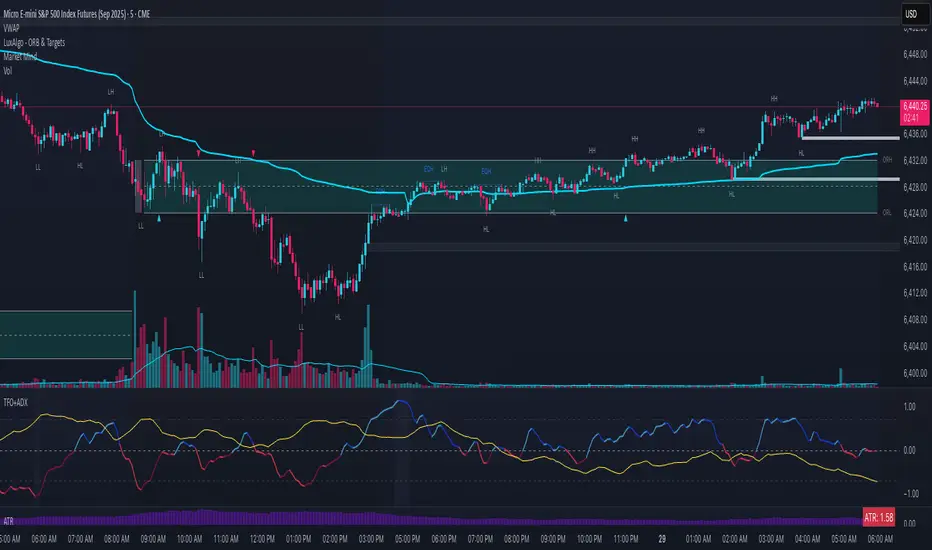
Trend Heuristics (+Signals)Trend Heuristics - Enhanced Rolling VWAP with Smart Signals
This indicator is an enhanced version of the Rolling VWAP (RVWAP) concept, originally based on PineCoders' ConditionalAverages library. It combines volume-weighted average price analysis with advanced signal detection for both sweeps and breakouts.
Core Features
1. Rolling VWAP System
- Implements a dynamic rolling VWAP that adapts to different timeframes
- Includes standard deviation bands for volatility measurement
- Offers flexible time period settings (fixed or auto-adjusting)
- Provides customizable visual elements including bands and fills
2. Dual Signal System
Sweep Signals
Detects high-probability reversal points with these conditions:
- Bullish Sweep:
- Opens above upper band
- Tests below upper band (low)
- Closes above upper band
- Shows stronger lower wick
- Closes above previous high
- Has favorable close position (upper 50% of candle)
- Bearish Sweep:
- Opens below lower band
- Tests above lower band (high)
- Closes below lower band
- Shows stronger upper wick
- Closes below previous low
- Has favorable close position (lower 50% of candle)
Breakout Signals
Identifies potential trend changes with these conditions:
- Bullish Breakout:
- Opens below VWAP
- Closes above upper band
- Indicates strong momentum shift upward
- Bearish Breakout:
- Opens above VWAP
- Closes below lower band
- Indicates strong momentum shift downward
Technical Details
Base Components
- Built upon PineCoders' ConditionalAverages library
- Incorporates custom alert system via CustomAlertLib
- Uses standard deviation for band calculations
Customization Options
- Adjustable standard deviation multiplier
- Flexible time period settings
- Independent controls for sweep and breakout signals
- Customizable visual elements (colors, sizes, positions)
- Custom alert message formatting
Use Cases
1. Trend Following:
- Use VWAP as dynamic support/resistance
- Monitor breakout signals for trend changes
2. Mean Reversion:
- Use sweep signals for counter-trend opportunities
- Standard deviation bands for range identification
3. Volume Analysis:
- VWAP provides volume-weighted price levels
- Helps identify significant price levels
Notes
- Best performed on liquid instruments with consistent volume
- Most effective on timeframes from 1hours to 4 hours and 1D, anything greater isn't very good
- Recommended to use in conjunction with other technical analysis tools
- Signals can be filtered based on higher timeframe trends
Credits
- Original Rolling VWAP concept by PineCoders
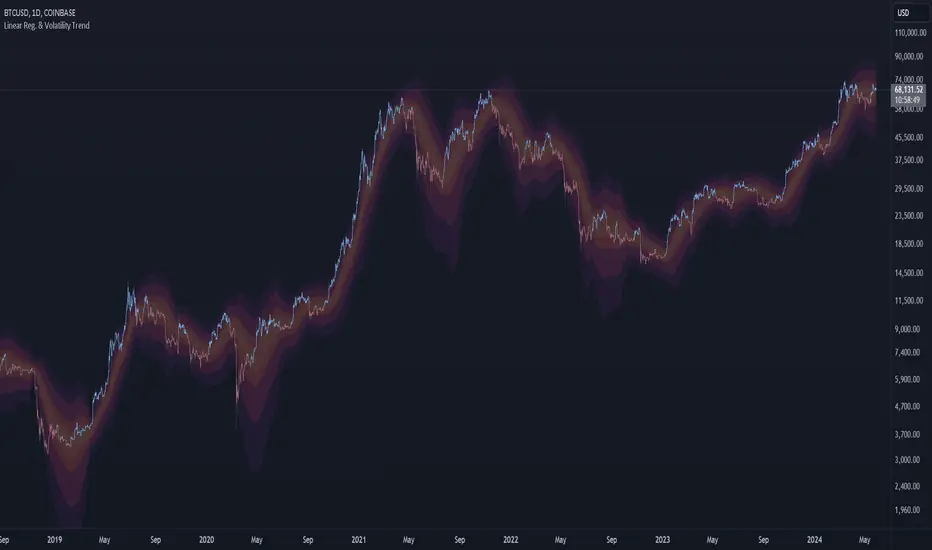
Trend Maestro - Linear Regression & Volatility BandsTrend Maestro - Linear Regression & Volatility Bands
Description:
The "Trend Maestro - Linear Regression & Volatility Bands" indicator is meticulously designed to provide traders with a clear understanding of market trends through the application of linear regression techniques and enhanced market data visualization. This tool is essential for traders looking to interpret long-term trends and market stability. Here's how the indicator functions and what makes it a unique addition to your trading toolkit:
1. Linear Regression Calculation:
At the heart of this indicator lies the linear regression calculation, which identifies the primary trend direction over a specified period. It does this by computing a line of best fit through the closing prices, helping to smooth out price fluctuations and highlight the prevailing trend direction. Users have the flexibility to adjust both the length of the regression and the offset period, enabling them to tailor the indicator's responsiveness to different market conditions.
2. Visualization Through Volatility Bands:
The volatility bands, plotted at half, one, two, and three standard deviations around the linear regression line, serve primarily as a visualization tool rather than a basis for investment decisions.
These bands:
Measure the dispersion of price from the trend line, providing a graphical representation of volatility.
Help traders visually assess the market's stability and the reliability of the current trend, with broader bands indicating higher volatility and narrower bands suggesting more stability.
3. Customization Features:
The indicator offers customization options including toggle switches for bar color and the display of SD bands, enhancing visual clarity. These settings allow traders to personalize the display according to their visual preferences and analysis requirements.
By incorporating these elements, the "Trend Maestro - Linear Regression & Volatility Bands" indicator offers a framework for understanding market trends through both quantitative calculations and qualitative visual aids. This makes it a valuable tool for those looking to make informed decisions based on longer-term market observations.
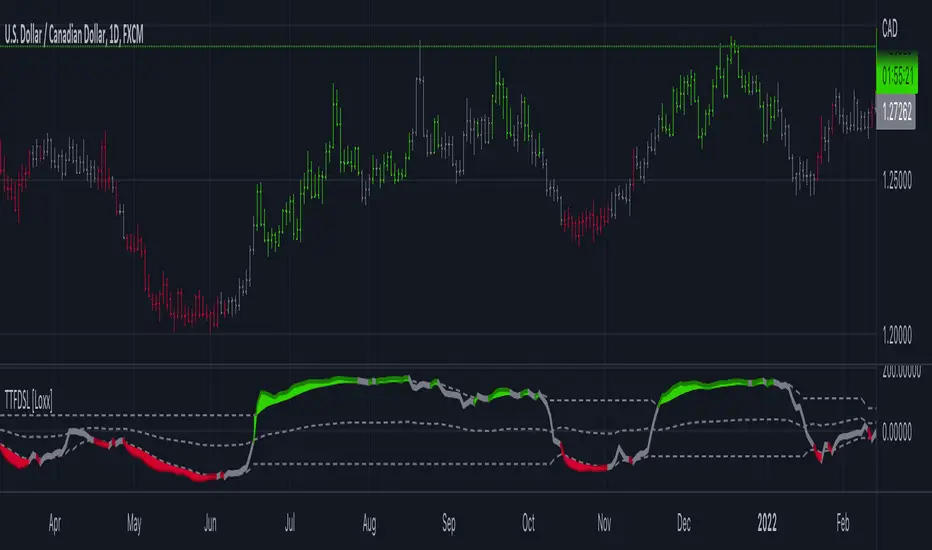
Trend Trigger Factor w/ Discontinued Signal Lines [Loxx]Trend Trigger Factor w/ Discontinued Signal Lines is a Trend Trigger Factor indicator with floating boundary lines to identify trends earlier
What is the Trend Trigger Factor?
Designed by M.H. Pee, the Trend Trigger Factors role is to help traders detect uptrends and downtrends and thus allow them to better position themselves in a with-trend manner. Its creator argues that the markets are mostly random but have a small trend component, which is the most crucial part of trading success. Being able to determine whether the market is in a bull or bear trend and how strong that trend is will allow you to be on the right side of the market for longer, capitalizing as much as possible on its trending behavior.
In his article, M.H. Pee used a 15-period trackback span to explain the calculations. The TTF formula is based on the so-called Buy Power and Sell Power. In his example, Pee labeled today as day 1, yesterday as day 2, the preceding day as day 3 and so on
What's new in this indicator?
Averages filter out prices prior to being used in calculation. That way the lag added is smaller than when the smoothing is used on the calculated result.
Unlike the original which uses levels +100 and -100 as significant levels for signal triggering, this version is using discontinued signal lines for trend filtering. That way it makes it a bit more responsive to market conditions
How do I use this?
The Trend Trigger Factor is similar in interpretation to the Relative Strength Index. It is plotted on a scale with most prominent levels at +100 and -100, crosses of which logically signal possible trade entries. The difference here, however, is that the upper and lower boundary flex with price movements so the upper and lower boundary shift dynamically. Crosses above the top line signify bullish sentiment, crossed below the the bottom line signify bearish sentiment.
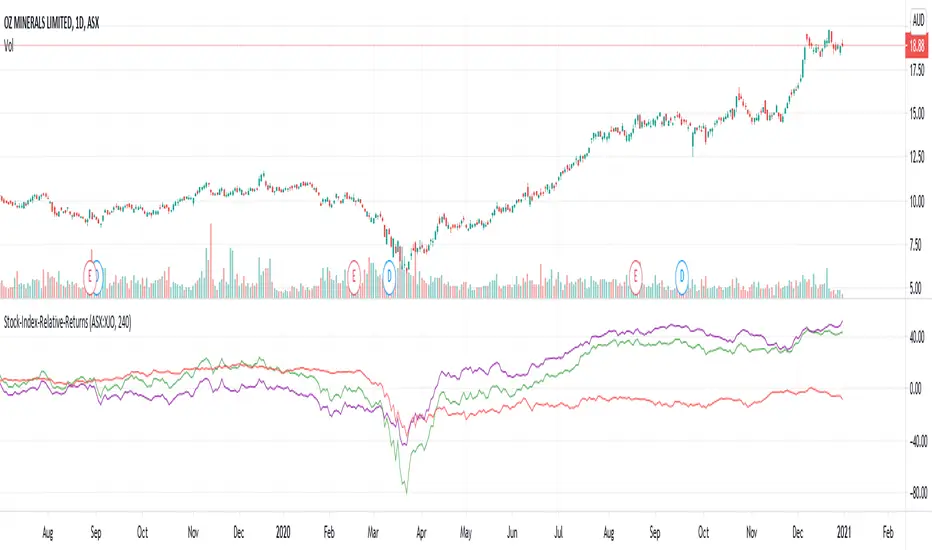
Stock-Index-Relative-ReturnsThis is one of the entry conditions of Mark Minervini's trend template for entry conditions.
This indicator plots returns in comparison with index. (Change the index ticker in the input as per the stock in use)
Loopback period is the distance from which we are calculating returns.
Green line indicates returns of the stock
Red line indicates returns of the index
Purple line is the difference between both.
Mark Minervini's trend template expects stock_returns/index_returns to be at least 7 - which means at least 70% higher than index returns.

Trend-Fib-Pivot Sweep [JopAlgo]Trend-Fib-Pivot Sweep — trend rails + Fib touch rules + sweep logic
Core idea
This tool blends two trend MAs, a rolling Fibonacci grid, and pivot sweep tags so you can do three things quickly:
Trend → MA1 vs MA2 stack and slope
Location → Fib touch/bounce/reject rules
Triggers → sweep → reclaim or trend pullback → continuation
Use the MAs for bias, the Fib levels for where price should react, and the sweeps to spot traps and entries after liquidity grabs.
What you’ll see
MA 1 (default 21, purple) and MA 2 (default 50, gray)
Fib lines from the highest/lowest of your lookback: 0.236 (light blue), 0.382 (green), 0.5 (white), 0.618 (orange), 0.786 (red)
Sweep markers: triangle above = high sweep; triangle below = low sweep
Background: soft green when MA1 > MA2, soft red when MA1 < MA2
Read it fast → Trend (background + MA stack)? Which Fib are we near? Any sweep and reclaim?
How the Fib levels work (and what to do at each)
0.236 → shallow pullback in a strong trend
→ Expect quick bounce continuation.
→ If price closes through 0.236 and stalls, momentum may be cooling; look to 0.382.
0.382 → standard trend pullback
→ In a bullish trend, tests here often bounce and continue.
→ Entry idea: touch/bounce at 0.382 with MA1 above MA2 and rising, then a higher-low and push back above 0.382 → enter.
0.5 → midline / fair value
→ Often the “decision” level.
→ Clean continuation if 0.5 holds; deeper rotation if we accept below (for longs).
0.618 (“golden”) → deep pullback / last line for trend
→ Best risk-defined continuation entries come from rejects/reclaims here.
→ For longs: wick below 0.618, then reclaim 0.618 → long with stop under the sweep low.
0.786 → exhaustive pullback / trap zone
→ If trend is truly alive, 0.786 rejects and snaps back.
→ If we accept beyond 0.786 (closes), expect a full range rotation or trend change.
Touch/bounce rule of thumb
You want to see price interact: touch → reject (wick) → reclaim the level.
A close back above the Fib after a downside probe (or below after an upside probe) is a stronger confirmation than intrabar wicks.
What the MAs do (and how to use them)
MA1 (fast) vs MA2 (slow) define bias and momentum.
MA1 above MA2 and both rising (↗) → bullish regime.
MA1 below MA2 and both falling (↘) → bearish regime.
Flat / crossing often → balance; lean on sweeps and the deeper Fibs (0.5/0.618/0.786).
Interaction with Fibs
Highest quality: Fib level + MA confluence (e.g., 0.382 near MA1).
When MA1 = dynamic trigger: reclaim MA1 at a Fib → continuation signal.
When MA2 = last defense: lose MA2 at 0.5/0.618 → expect deeper rotation.
Sweep logic (why it matters and how to execute)
High sweep = current bar’s high takes out the recent high then fails → liquidity grab above.
Low sweep = current bar’s low takes the recent low then fails → liquidity grab below.
Execution idea
Longs: low sweep into 0.5/0.618/0.786, then reclaim the Fib and, ideally, MA1 → enter; stop under sweep low.
Shorts: high sweep into 0.5/0.382/0.236, then reclaim below the Fib and MA1 → enter; stop above sweep high.
Repaint note
If you enable Lag-Confirmed Pivot Mode, sweep labels are stricter and may “finalize” later (can appear as repaint).
For signals/alerts, prefer non-repaint mode; for review/training, lag-confirmed is fine.
How to trade it (simple playbook)
Direction filter (use MAs first)
Bullish bias → MA1 > MA2 and not flat → look for longs at 0.236/0.382/0.5.
Bearish bias → MA1 < MA2 → look for shorts at 0.236/0.382/0.5 from above.
Entries (two clean templates)
Trend pullback → continuation
→ In bull regime: price pulls to 0.382 or 0.5, shows rejection wick, then reclaims level and MA1 → enter long.
→ In bear regime: mirror with short from above.
Sweep → reclaim
→ Downside sweep through 0.618/0.786, then close back above the Fib and through MA1 → enter long.
→ Upside sweep through 0.382/0.236, then close back below and under MA1 → enter short.
Risk & targets
Stops → beyond the sweep extreme or below/above the reclaimed Fib (structure-based).
Targets → next Fib ladder (e.g., long from 0.5 → target 0.382 → 0.236), or obvious POC/HVNs if you use Volume Profile.
Settings that matter (and how to tune)
MA Types/Lengths
EMA (default fast) = responsive trend read.
SMA/HMA = smoother backbone.
21/50 is a solid default; swing traders can run 34/89.
Fib Lookback
Shorter lookback = tighter range, more sensitive levels;
Longer = broader swing map, fewer interactions but stronger signals.
Sweeps
Sweep Detection Range controls how “recent” the pivot must be (default 10).
Lag-Confirmed mode reduces false sweeps but can finalize later.
Starter presets
Intraday (15m–1H) → MA1 21 EMA, MA2 50 SMA, Fib lookback 100–150, Sweeps 10
Swing (4H) → MA1 34 EMA, MA2 89 SMA, Fib lookback 150–250, Sweeps 10–14
Pattern cheat sheet
0.382 kiss & go (trend day) → quick tag and bounce in bull regime → continuation.
0.5 decision → hold = trend resumes; failure = rotate to 0.618.
0.618 sweep + reclaim → high-quality continuation with tight risk.
0.786 trap → deep flush then snapback; if acceptance persists, expect full rotation.
MA pinch → break → MA1 and MA2 compress, then price breaks and holds a Fib → expansion leg.
Best combos (kept simple)
Volume Profile v3.2 → use VAH/VAL/POC/LVNs as concrete targets; look for Fib + VP confluence.
Anchored VWAP → reclaims/rejections at anchored lines with Fib reaction and MA agreement improve timing.
Common mistakes this helps you avoid
Buying into 0.618/0.786 without a reclaim (catching falling knives).
Fading a 0.236 pullback when MAs are strongly ↗ (fighting trend).
Taking sweeps without a reclaim/confirmation.
Ignoring the MA stack when choosing direction.
Disclaimer
This indicator and write-up are for education only, not financial advice. Trading involves risk; results vary by market, venue, and settings. Test first, act at defined levels, and manage risk. No guarantees or warranties are provided.

Trend Compass (Manual)## Trend Compass (Manual) - A Discretionary Trader's Dashboard
### Summary
Trend Compass is a simple yet powerful dashboard designed for discretionary traders who want a constant, visual reminder of their market analysis directly on their chart. Instead of relying on automated indicators, this tool gives you **full manual control** to define the market state across different timeframes or conditions.
It helps you stay aligned with your higher-level analysis (e.g., HTF bias, current market structure) and avoid making impulsive decisions that go against your plan.
### Key Features
- **Fully Manual Control:** You decide the trend. No lagging indicators, no confusing signals. Just your own analysis, displayed clearly.
- **Multiple Market States:** Define each row as an `Uptrend`, `Downtrend`, `Pullback`, or `Neutral` market.
- **Customizable Rows:** Display up to 8 rows. You can label each one however you like (e.g., "D1", "H4", "Market Structure", "Liquidity Bias").
- **Flexible Panel:** Change all colors, text sizes, and place the panel in any of the 9 positions on your chart.
- **Clean & Minimalist:** Designed to provide essential information at a glance without cluttering your chart.
### How to Use
1. **Add to Chart:** Add the indicator to your chart.
2. **Open Settings:** Go into the indicator settings.
3. **Configure Rows:**
- In the "Rows (Manual Control)" section, set the "Number of rows" you want to display.
- For each row, give it a custom **Label** (e.g., "m15").
- Select its current state from the dropdown menu (`Uptrend`, `Downtrend`, etc.).
- To remove a row, simply set its state to `Hidden`.
4. **Customize Style:**
- In the "Panel & Visual Style" section, adjust colors, text sizes, and the panel's position to match your chart's theme.
This tool is perfect for price action traders, ICT/SMC traders, or anyone who values a clean chart and a disciplined approach to their analysis.

Trend Following S/R Fibonacci StrategyTrend Following S/R Fibonacci Strategy
Trend Following S/R Fibonacci Strategy

Trend MVery simple script where all you need is to put the time frame you are, just put min number
for example 5 min = 5 at Min
1 hour =60
4 hour =240 etc
green are bullish trend
red is bearish
the trend is based on weekly combination of High and Low with no security MTF ,at this way I attempt to put the possible weekly support and resistance to a much lower TF
so it just idea . let me know what you think:)

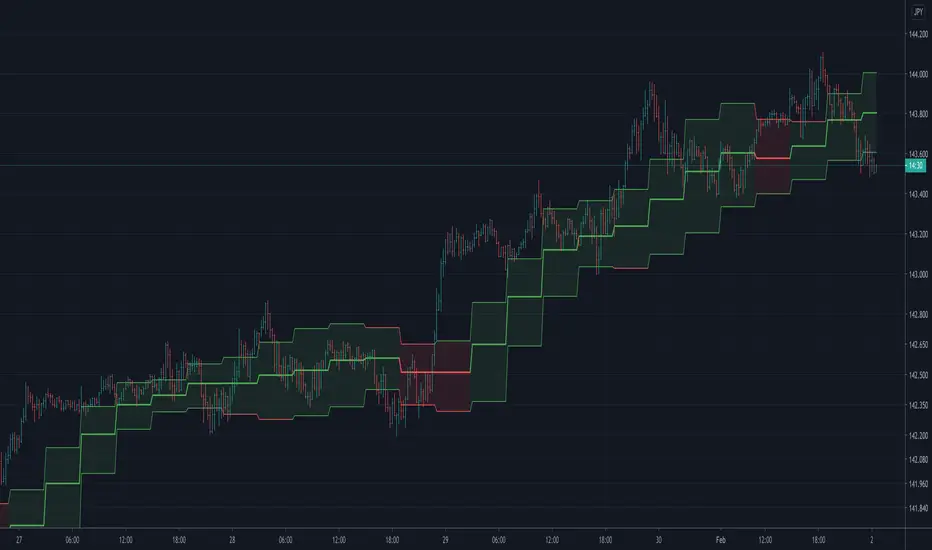
Trend StepTrend Follow Indicator
HTF "Auto" setting is:
< 4Hour : "240"
>= 4Hour and Intraday : "D"
D: Weekly
W: Monthly
M: Yearly
Trend Score by KIVANÇ fr3762Trend Score compares close prices between last close with previous closes by a certain period of time.
It's like momentum but gives a score +1 when close price is equal to or above (defaultly) 10 bars ago and gives a score of -1 when below.
calculation continues from default length to the 2 times of length.
Defaultly (for 10 bars length)
If Trend Score converges to 10; that means there's a strong uptrend
conversely if Trend Score converges to -10; that means a strong downtrend market is on.
