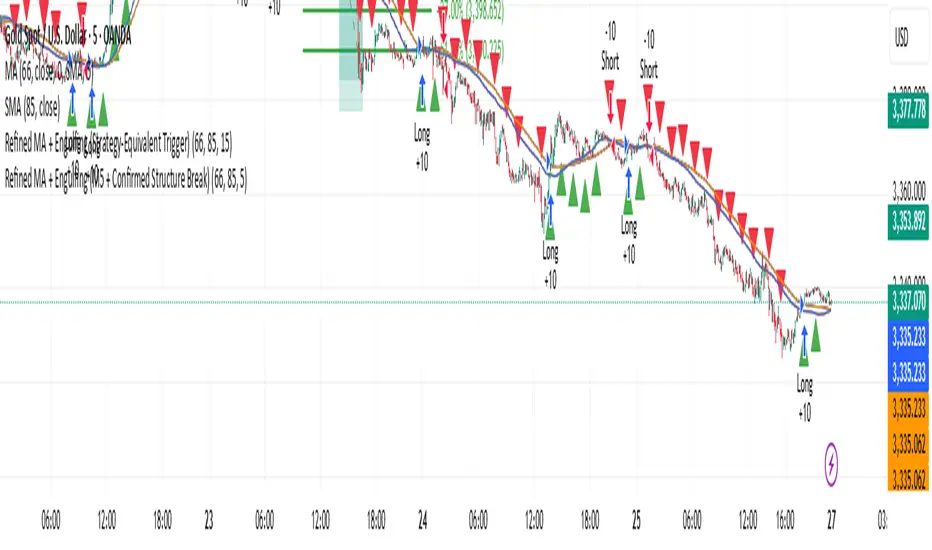
Refined MA + Engulfing (Strategy-Equivalent Trigger)I would like to start by saying that this indicator was put together using ChatGPT, some past trades from myself and some backtested trades, and from my time as a student in Wallstreet Academy under Cue Banks.
I am not profitable yet. I am too jumpy and blow accounts. I'm hoping this indicator (and it's strategy twin), with the help of some alerts, can help me spend less time on the charts, so that I'm not tempted to press buttons as much.
It does fire quite a bit. It can be adjusted, I believe, to trigger more or less (open the script, cooldown bars(x) <== change the X to whatever. 5 minute intervals so 1 is 5.
With that being said, there are times that this indicator has shown to trigger and I ask, "Why?".
I just want to help myself and others, and maybe make some decent\cool stuff along the way. Enjoy
KR
Поиск скриптов по запросу "trigger"
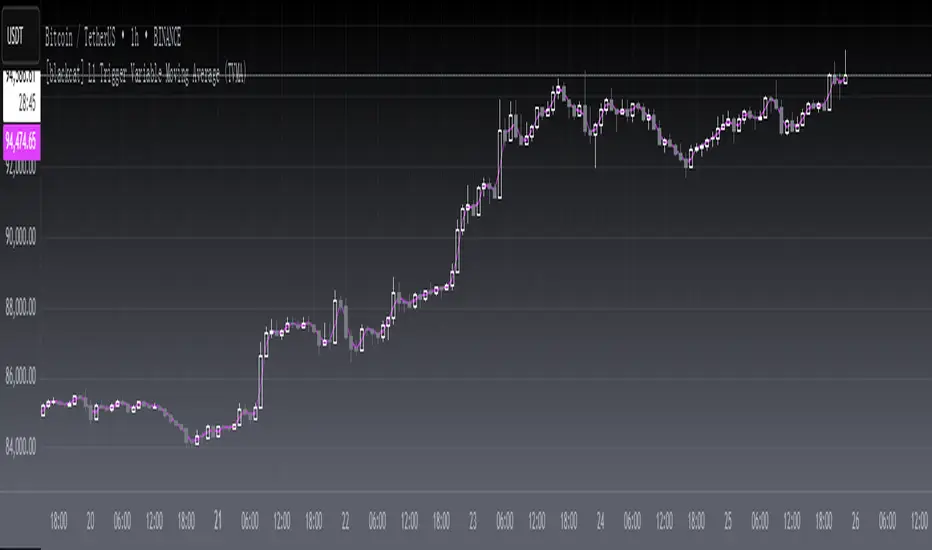
[blackcat] L1 Trigger Variable Moving Average (TVMA)TVMA is a special type of moving average that differs from the traditional usage of moving averages. TVMA is a lagging moving average, and the degree of lag is determined by the parameter "tvmaLength". When "tvmaLength" = 1, the TVMA line coincides completely with the data source curve without any lag. As the value of "tvmaLength" increases, the lagging effect of the moving average becomes more pronounced. Therefore, TVMA is a very unique type of moving average that aims to obtain lagging signals rather than leading signals.
The purpose of TVMA as a moving average is to provide crossover signals (golden cross and death cross) as reference signals for buying and selling decisions. This indicator is usually used in conjunction with other technical indicators to enhance the accuracy of trading signals. The lagging characteristic of TVMA allows it to generate better trading signals during major trend developments and helps traders avoid being influenced by short-term fluctuations. However, during periods of intense market volatility, this lagging feature may cause delayed signals and result in missed opportunities for good buy or sell points.
Therefore, when using TVMA for trading purposes, it's important to adjust parameters in order to obtain better lagging moving average signals. Additionally, combining other technical indicators and analyzing market trends can also improve the accuracy of trading signals generated by TVMA.
The script defines an indicator called " L1 Trigger Variable Moving Average (TVMA)" using the indicator() function. It also defines a function called tvma() that calculates the TVMA (Trigger Variable Moving Average) based on a given source, length, and alpha value.
The main logic of the script involves calculating the TVMA value using the tvma() function with user-defined inputs. The source data for calculation is taken from the closing price (close). The length of TVMA and its alpha value are also defined by user inputs.
Finally, the calculated TVMA values are plotted on the chart using the plot() function with specified color and title.
Hopper Trigger - Free Cryptohopper WidgetWelcome to our Tradingview cryptohopper trigger widget.
We designed this script to give Cryptohopper users the possibility to set up an alarm when btc is trending down. Cause of the BTCs behavior as the supertrend coin for the market it is better to turn your hopper off or be extremly careful when BTC is trending down. We implemented to types of alarms, because atm its not possible to automate using them to deactivate your hopper. On Alarm setup could be used to send signals every minute to trigger a push notification on your App or to trigger your Alexa. The other type of alarm only sends one single signal for normal purposes.
We recommend using this indicator in the 30 minute or 1 hour timeframe and to deactivate your hopper and deleting all positions when a alarm is signaling. The risk of a larger drop is very high in this marketphase. Never take an drop again using this approach. Little drawdown in bearish or ranging times but high reward in bullish times.
Smartgrow-Trading is a community project with the aim of developing the best and most successful trading strategies and sharing them with the community.
The basic idea of this script is to calculate how far an coin is away from its ATH , to gave warning signals for deactivating coins after they reached there ATH . So it could also be used for other coins and pairs.
If there are questions, write them into the comments or contact us directly over the direct message or social media. Happy Trading!

Simple Study for Sean (threshold-triggered alert)This script illustrates how to create simple alerts, triggered by a share price moving above (or below) an arbitrary threshold.

Trend Trigger Factor T3Trend Trigger Factor was described by M.H. Pee in the Technical Analysis of Stocks and Commodities magazine in December, 2004.
From the author:
The TTF (Trend Trigger Factor) will help you long in an uptrend and short in an downtrend. This indicator allows you to follow the trend and capitalize on that rare nonrandom trend component of the markets.
Basically it calculates range from highest high and lowest low on 2 different time periods: a recent one and an older one, called buypower and sellpower and then apply the formula:
100*(BuyPower-SellPower)/(0.5*(BuyPower+SellPower))
to calculate the TTF.
The trend trigger is made with a fixed levels (that you can change in the setting), when the TTF is over the upper level, the trend is up and when it’s below the lower level, the trend is down.
In this version the TTF value is smoothed with a Wilson’s T3 average.
Thanks for the work of Nicolas @ www.prorealcode.com

Build A Bot Hull TriggerThis is the automated trading system we built during the 60-Minute Build-A-Bot webinar on September 12, 2018. We had a lot of fun, and implemented a TON of indicators LIVE during this webinar! And the best part is that as a group we researched, designed, and built a profitable robot in exactly 60 minutes!
We started by voting on the type of trading system, and this is a trend following system because it got the most votes. Then, the attendees in the webinar sent in their suggestions for indicators and settings during the live webinar (still counting toward the 60 minutes). Once we had the indicators on the chart, and we discussed various settings we could use, we got to work building the robot, and ran the first strategy test...and it was profitable!
This version uses the Hull Moving Average as a trigger for initiating the trade, and everything else is the same for the filters. The other version uses the CCI as a trigger for the trade, and many other indicators as filters.

Trend Trigger FactorTrend Trigger Factor indicator script. This indicator was originally developed by M. H. Pee (Stocks & Commodities V.22:12 (28-36): Trend Trigger Factor).

Adaptive Trend Trigger // VX-ATTAdaptive Trend Trigger // VX-ATT is a trend-following bias indicator that combines a baseline EMA with adaptive ATR bands and a momentum override layer.
Core idea:
The EMA defines the baseline trend.
ATR bands above/below the EMA mark zones where volatility is high enough to justify a directional push.
A break above the upper band switches the bias to Long.
A break below the lower band switches the bias to Short.
Strong candle bodies (measured vs. an average body size) can temporarily override the current bias when they close far above/below the EMA (momentum override).
What the indicator does:
Colors the background based on the active bias (Long/Short).
Plots EMA + ATR bands.
Marks strong momentum candles with arrows.
Provides alerts when the bias flips from Long → Short or Short → Long.
Typical use cases:
Trend filter for discretionary entries
Bias layer for strategies or additional indicators
Only trade in the direction of the active bias (e.g., favor Long setups in Long bias, avoid counter-trend scalps)
This is a simplified, free component extracted from my VX toolset (VX-ATT), designed as a clean, plug-and-play trend/bias layer you can combine with your own setups.

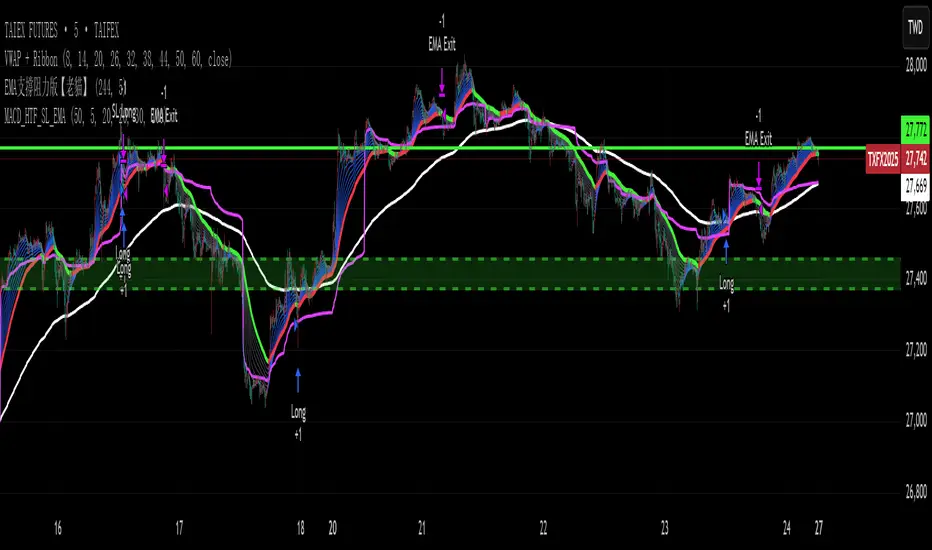
EVWMA VWAP MACD Strategy - HTF Trigger with SL & EMA ExitEVWMA VWAP MACD Strategy - HTF Trigger with SL & EMA Exit

EVWMA VWAP MACD Strategy - HTF Trigger with SL & EMA ExitRENEW TRY IT EVWMA VWAP MACD Strategy - HTF Trigger with SL & EMA Exit
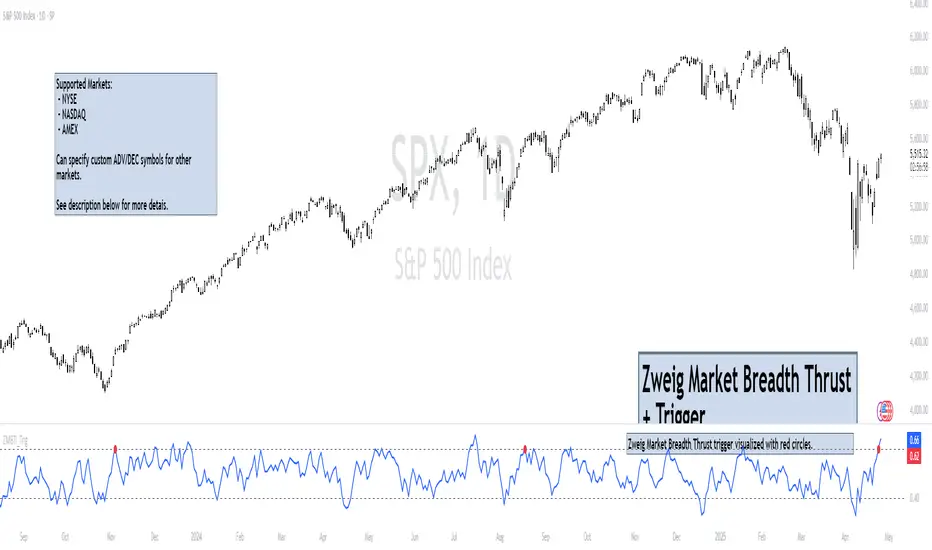
Zweig Market Breadth Thrust Indicator+Trigger [LazyBear x rwak]The Breadth Thrust (BT) indicator is a market momentum indicator developed by Dr. Martin Zweig. According to Dr. Zweig, a Breadth Thrust occurs when, during a 10-day period, the Breadth Thrust indicator rises from below 40 percent to above 61.5 percent.
A "Thrust" indicates that the stock market has rapidly changed from an oversold condition to one of strength, but has not yet become overbought. This is very rare and has happened only a few times. Dr. Zweig also points out that most bull markets begin with a Breadth Thrust.
This version of the Breadth Thrust indicator includes a trigger visualized with red circles, making it easier to spot when the indicator crosses the critical 61.5% level, signaling potential bullish momentum.
All parameters are configurable. You can draw BT for NYSE, NASDAQ, AMEX, or based on combined data (i.e., AMEX+NYSE+NASD). There is also a "CUSTOM" mode supported, so you can enter your own ADV/DEC symbols.
Credit: The original Breadth Thrust logic was created by LazyBear, whose public indicators can be found here , and app-store indicators here .
More info:
Definition of Breadth Thrust
A Breadth Thrust Signal
A Rare "Zweig" Buy Signal
Zweig Breadth Thrust: Redux
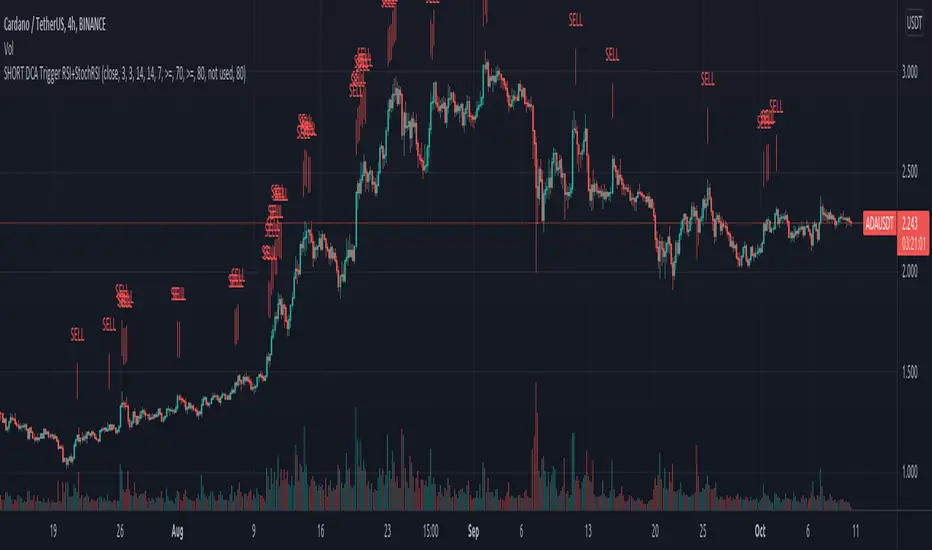
Zendog SHORT DCA Trigger RSI+StochRSIThis is a script that generates a SELL signal by combining RSI and Stochastic RSI into the same script and that can easily be integrated into an external Backtester like the one I published.
The script uses default values for RSI and Stochastic RSI overbought conditions.
They should be adjusted for specific assets and timeframes so they better match the current trend. Please beware you might overfit settings to match a short timeframe trend (like a few days or hours). If this is the case once the trend changes the signals will not be accurate.
The purpose of this script is to provide some pine code that can be used to further combine multiple indicators into a SHORT Deal Start signal.
Integration with the Zendog Backtster:
- add the backtester on the chart
- add this script on the chart
- in the Zendog backtester Deal start type select "External indicator"
- in the Zendog backtester Indicator source and value select "Zendog SHORT DCA Trigger RSI+StochRSI: SIGNAL"
Zendog LONG DCA Trigger RSI+StochRSIThis is a script that generates a BUY signal by combining RSI and Stochastic RSI into the same script and that can easily be integrated into an external Backtester like the one I published.
The script uses default values for RSI and Stochastic RSI oversold conditions.
They should be adjusted for specific assets and timeframes so they better match the current trend. Please beware you might overfit settings to match a short timeframe trend (like a few days or hours). If this is the case once the trend changes the signals will not be accurate.
The purpose of this script is to provide some pine code that can be used to further combine multiple indicators into a LONG Deal Start signal.
Integration with the Zendog Backtster:
- add the backtester on the chart
- add this script on the chart
- in the Zendog backtester Deal start type select "External indicator"
- in the Zendog backtester Indicator source and value select "Zendog LONG DCA Trigger RSI+StochRSI: SIGNAL"

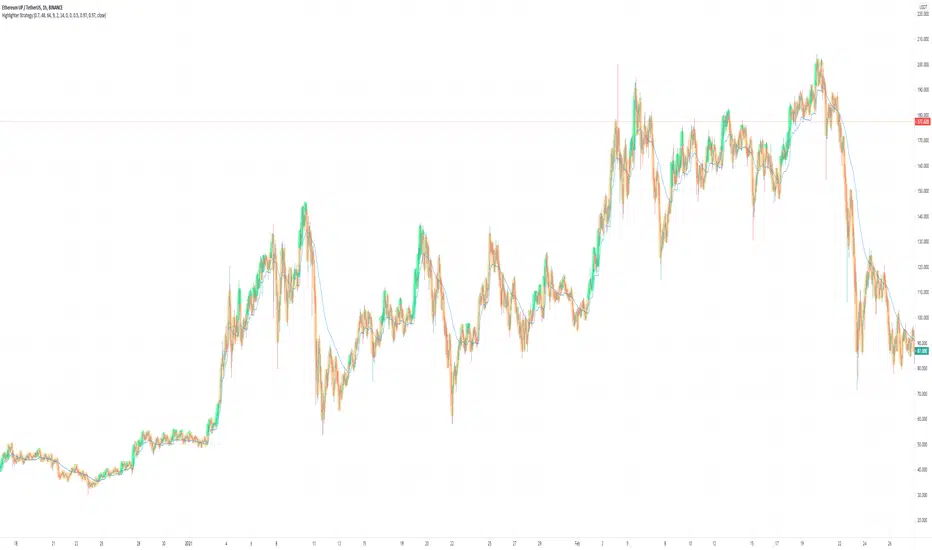
Highlighter Strategy V2// Based on Normalized Smoothed MACD by Dreadblitz
Old one was just an oscillator, I changed a few things
1) It now paints the line green/orange
2) The trigger (green/red) is now based on a signal
3) The signal is basically isUp, but with some additional controls, e.g.
4) (new) There is an embedded stoploss. This is a growth/decay function that decays slower than it grows.
5) Signal is filtered additionally by the stoploss (no green under the decaying line)
The 6 Line Death PunchIf you are looking to discover what trend you are in, you need to first what direction the price is going in...
I've been using and testing a mixture of EMA's and SMA's for a long time and I've found that these ones are by far the best.
EMA 3
EMA 8
MA 20
EMA 55
MA 100
MA 200
EMA 3 & 8 Crossover is a good method for confirming a coin going to the upside or to the downside.
EMA 8 is known as the Trigger Line (trademarked brand) as one of the fib numbers it shows good support or resistance of a trend.
MA 20 universal way of seeing trend direction in the stock market, works well with crypto too.
EMA 55, another trusty fib number. Works very well and could trade off that alone as support and resistance.
MA 100 and MA 200. Long ranged moving averages which govern the overall longer-term trend.
LONG ENTRY
Option 1 - 3/8 crossover
Option 2 - Candles above EMA 8
Option 3 - Candles above MA 20
Option 4 - Candles Above EMA 55.
SHORT ENTRY
Option 1 - 3/8 crossover
Option 2 - Candles below EMA 8
Option 3 - Candles below MA 20
Option 4 - Candles below EMA 55.

Chaikin Volatility Strategy With Negative Trigger AllowedSame like Chaikin Volatility Strategy, but allows negative value of Trigger

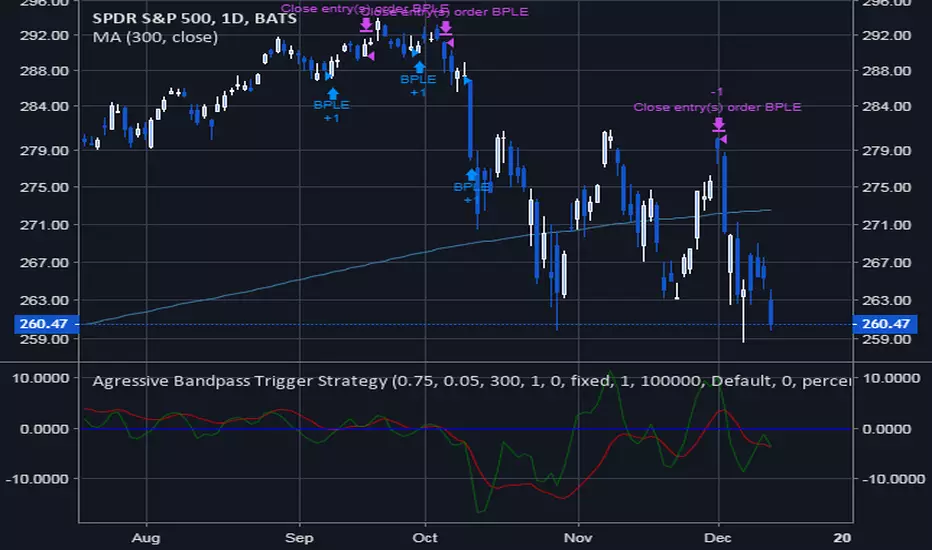
Aggressive Bandpass Trigger StrategyThis uses the Aggressive Bandpass Trigger Ver 3 to place a trade on an overbought/oversold inflection point of the Lead line and the Phase line above/below the midline

Aggressive Bandpass Trigger Strategy [jwammo12]This strategy enters a trade on an inflection point of the lead line of the adaptive bandpass trigger oscillator, so it is an aggressive entry. It closes the trade on the reverse signal and only trades long and when price is over a long term moving average.
Indicator: Trend Trigger FactorIntroduced by M.H.Pee, Trend Trigger Factor is designed to keep the trader trading with the trend.
System rules according to the developer:
* If the 15-day TTF is above 100 (indicating an uptrend), you will want to be in long positions.
* If the 15-day TTF is below -100, you will want to be short.
* If it is between -100 and 100, you should remain with the current position.
More info:
Original Article by Mr.Pee: drive.google.com

VOLLY PRICE CONVERGETriggers:
Long = Price and Volume ma's move up
Close trade = crosses ma, volume and price move in different directions

Heikin Ashi OscillatorTrigger (Current Period): Heikin Ashi candle heights are plotted to form and oscillator.
Trend (1W): A slower period is also plotted.
When Trend is rising, dips in the Trigger are buying opportunities
When Trend is descending, peaks in the Trigger are selling opportunities


Intraday Market Context (Trend & Risk)📌 Intraday Market Context (Trend & Risk)
Overview
Intraday Market Context (Trend & Risk) is a non-signal, informational indicator designed to provide a high-level view of current market conditions. Instead of generating buy or sell signals, this tool helps traders understand what kind of market they are operating in and how cautious or aggressive they should be.The output is shown as a clean, fixed on-chart box with plain-language guidance.
What This Indicator Shows
The indicator displays three simple elements:
1️⃣ Market Type
Identifies the current market environment:
Trending Market
Sideways Market
Expanding / Breakout Market
Unclear Market
2️⃣ Risk Mode
Provides a relative assessment of market risk:
Normal Risk
Medium Risk
High Risk
This is contextual information only and does not imply trade direction.
3️⃣ What to Do
Plain-language behavioral guidance, not trade instructions:
Trend is Friend
Range is Friend
Wait for Pullback
Stay Out
These phrases are meant to guide trader behavior, not trigger trades.
How to Use
Use this indicator as a market context filter, not as a trading signal
Decide when to trade, trade cautiously, or stay out
Use your own execution tools (price action, EMAs, VWAP, structure, etc.) for entries and exits
Respect “Stay Out” conditions to avoid over-trading in unfavorable environments
This indicator works best as a decision-support overlay, especially for intraday traders.
What This Indicator Is NOT
❌ Not a buy/sell signal
❌ Not a trading strategy
❌ Not predictive
❌ Not a replacement for risk management
Important Disclaimer
This indicator is provided for educational and informational purposes only.It does not constitute financial advice, investment advice, or a recommendation to trade any instrument.Trading involves risk, and losses can exceed expectations. Always use proper risk management and make your own trading decisions.
