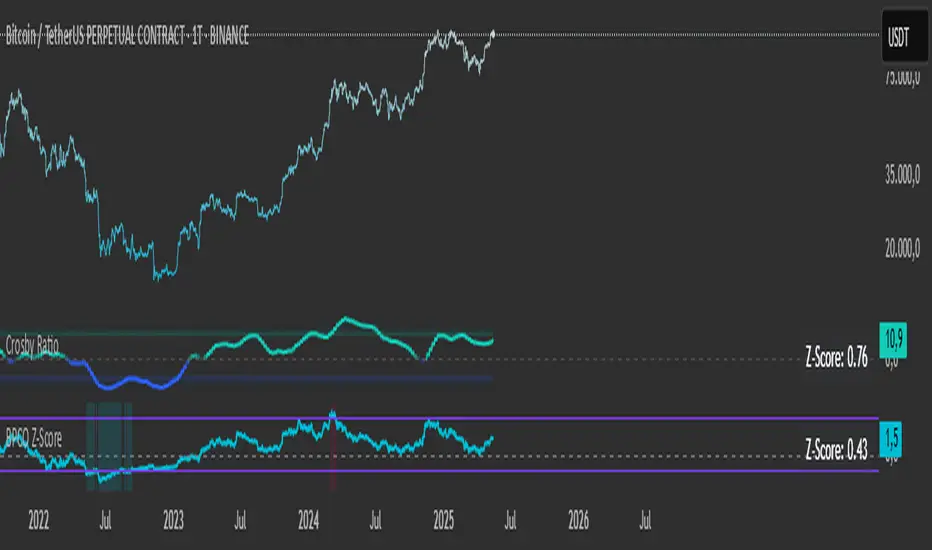
BPCO Z-ScoreBPCO Z-Score with Scaled Z-Value and Table
Description:
This custom indicator calculates the Z-Score of a specified financial instrument (using the closing price as a placeholder for the BPCO value), scales the Z-Score between -2 and +2 based on user-defined thresholds, and displays it in a table for easy reference.
The indicator uses a simple moving average (SMA) and standard deviation to calculate the original Z-Score, and then scales the Z-Score within a specified range (from -2 to +2) based on the upper and lower thresholds set by the user.
Additionally, the scaled Z-Score is displayed in a separate table on the right side of the chart, providing a clear, numerical value for users to track and interpret.
Key Features:
BPCO Z-Score: Calculates the Z-Score using a simple moving average and standard deviation over a user-defined window (default: 365 days). This provides a measure of how far the current price is from its historical average in terms of standard deviations.
Scaled Z-Score: The original Z-Score is then scaled between -2 and +2, based on the user-specified upper and lower thresholds. The thresholds default to 3.5 (upper) and -1.5 (lower), and can be adjusted as needed.
Threshold Bands: Horizontal lines are plotted on the chart to represent the upper and lower thresholds. These help visualize when the Z-Score crosses critical levels, indicating potential market overbought or oversold conditions.
Dynamic Table Display: The scaled Z-Score is shown in a dynamic table at the top-right of the chart, providing a convenient reference for traders. The table updates automatically as the Z-Score fluctuates.
How to Use:
Adjust Time Window: The "Z-Score Period (Days)" input allows you to adjust the time period used for calculating the moving average and standard deviation. By default, this is set to 365 days (1 year), but you can adjust this depending on your analysis needs.
Set Upper and Lower Thresholds: Use the "BPCO Upper Threshold" and "BPCO Lower Threshold" inputs to define the bands for your Z-Score. The default values are 3.5 for the upper band and -1.5 for the lower band, but you can adjust them based on your strategy.
Interpret the Z-Score: The Z-Score provides a standardized measure of how far the current price (or BPCO value) is from its historical mean, relative to the volatility. A value above the upper threshold (e.g., 3.5) may indicate overbought conditions, while a value below the lower threshold (e.g., -1.5) may indicate oversold conditions.
Use the Scaled Z-Score: The scaled Z-Score is calculated based on the original Z-Score, but it is constrained to a range between -2 and +2. When the BPCO value hits the upper threshold (3.5), the scaled Z-Score will be +2, and when it hits the lower threshold (-1.5), the scaled Z-Score will be -2. This gives you a clear, easy-to-read value to interpret the market's condition.
Data Sources:
BPCO Data: In this indicator, the BPCO value is represented by the closing price of the asset. The calculation of the Z-Score and scaled Z-Score is based on this price data, but you can modify it to incorporate other data streams as needed (e.g., specific economic indicators or custom metrics).
Indicator Calculation: The Z-Score is calculated using the following formulas:
Mean (SMA): A simple moving average of the BPCO (close price) over the selected period (365 days by default).
Standard Deviation (Std): The standard deviation of the BPCO (close price) over the same period.
Z-Score: (Current BPCO - Mean) / Standard Deviation
Scaled Z-Score: The Z-Score is normalized to fall within a specified range (from -2 to +2), based on the upper and lower threshold inputs.
Important Notes:
Customization: The indicator allows users to adjust the period (window) for calculating the Z-Score, as well as the upper and lower thresholds to suit different timeframes and trading strategies.
Visual Aids: Horizontal lines are drawn to represent the upper and lower threshold levels, making it easy to visualize when the Z-Score crosses critical levels.
Limitations: This indicator relies on historical price data (or BPCO) and assumes that the standard deviation and mean are representative of future price behavior. It does not account for potential market shifts or extreme events that may fall outside historical norms.
Sentiment
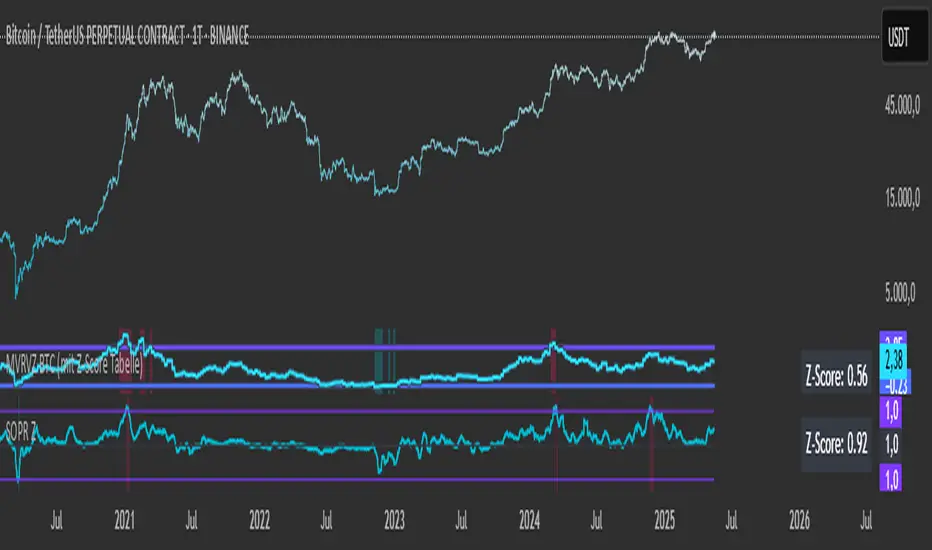
SOPR with Z-Score Table📊 Glassnode SOPR with Dynamic Z-Score Table
ℹ️ Powered by Glassnode On-Chain Metrics
📈 Description:
This indicator visualizes the Spent Output Profit Ratio (SOPR) for major cryptocurrencies — Bitcoin, Ethereum, and Litecoin — along with a dynamically normalized Z-Score. SOPR is a key on-chain metric that reflects whether coins moved on-chain are being sold at a profit or a loss.
🔍 SOPR is calculated using Glassnode’s entity-adjusted SOPR feed, and a custom SMA is applied to smooth the signal. The normalized Z-Score helps identify market sentiment extremes by scaling SOPR relative to its historical context.
📊 Features:
Selectable cryptocurrency: Bitcoin, Ethereum, or Litecoin
SOPR smoothed by user-defined SMA (default: 10 periods)
Upper & lower bounds (±4%) for SOPR, shown as red/green lines
Background highlighting when SOPR moves outside normal range
Normalized Z-Score scaled between –2 and +2
Live Z-Score display in a compact top-right table
🧮 Calculations:
SOPR data is sourced daily from Glassnode:
Bitcoin: XTVCBTC_SOPR
Ethereum: XTVCETH_SOPR
Litecoin: XTVCLTC_SOPR
Z-Score is calculated as:
SMA of SOPR over zscore_length periods
Standard deviation of SOPR
Z-Score = (SOPR – mean) / standard deviation
Z-Score is clamped between –2 and +2 for visual consistency
🎯 Interpretation:
SOPR > 1 implies coins are sold in profit
SOPR < 1 suggests coins are sold at a loss
When SOPR is significantly above or below its recent range (e.g., +4% or –4%), it may signal overheating or capitulation
The Z-Score contextualizes how extreme the current SOPR is relative to history
📌 Notes:
Best viewed on daily charts
Works across selected assets (BTC, ETH, LTC)
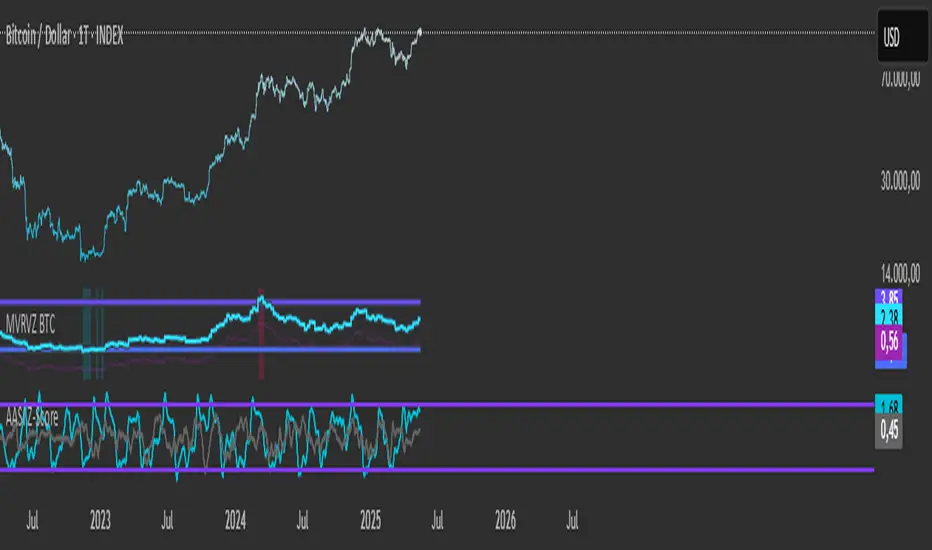
Active Addresses Z-ScoreActive Addresses Z-Score Indicator
The Active Addresses Z-Score Indicator is a fundamental analysis tool designed to evaluate the relationship between Bitcoin network activity and its price movements over a specified period. This indicator aims to provide insights into whether the market is showing signs of increasing or decreasing interest in Bitcoin, based on its network usage and activity.
How to Read the Indicator
Orange Line (Price Z-Score):
This line represents the Z-Score of the price change over a defined period (e.g., 28 days). The Z-Score normalizes the price change by comparing it to the historical mean and standard deviation, essentially measuring how far the current price change is from the average.
A positive Z-Score indicates that the price change is above the historical average (a bullish signal), while a negative Z-Score means the price change is below the historical average (a bearish signal).
Gray Line (Active Addresses Z-Score):
This line represents the Z-Score of the change in active addresses over the same period. The Z-Score here normalizes the change in the number of active Bitcoin addresses by comparing it to historical data.
A positive Z-Score suggests that the number of active addresses is increasing more than usual, which can be a sign of increased market activity and potential interest in Bitcoin.
A negative Z-Score suggests that active addresses are decreasing more than usual, which may indicate reduced interest or usage of Bitcoin.
Upper and Lower Threshold Lines:
The upper and lower threshold lines (set by the user) act as Z-Score boundaries. If either the price Z-Score or the active address Z-Score exceeds the upper threshold, it can signal an overbought or overactive condition. Similarly, if the Z-Score falls below the lower threshold, it could indicate an oversold or underactive condition.
These thresholds are customizable by the user, allowing for flexible interpretation based on market conditions.
Indicator Calculation
Price Change Calculation:
The percentage change in the Bitcoin price over a specified lookback period (e.g., 28 days) is calculated as:
Price Change
=
Close
−
Close
Close
Price Change=
Close
Close−Close
This shows the relative price movement during the specified period.
Active Address Change Calculation:
Similarly, the percentage change in active addresses is calculated as:
Active Address Change
=
Active Addresses
−
Active Addresses
Active Addresses
Active Address Change=
Active Addresses
Active Addresses−Active Addresses
This shows the relative change in the number of active Bitcoin addresses over the same period.
Z-Score Calculation:
The Z-Score for both the price and active address changes is calculated as:
𝑍
=
X
−
𝜇
𝜎
Z=
σ
X−μ
Where:
X is the current change (price or active addresses),
μ (mu) is the mean (average) of the historical data over the lookback period,
σ (sigma) is the standard deviation of the historical data.
This Z-Score tells you how far the current value deviates from its historical average, normalized by the volatility (standard deviation).
Smoothing (Optional):
A simple moving average (SMA) is applied to smooth out the Z-Score values to reduce noise and provide a clearer trend.
What the Indicator Does
Signals of Bullish or Bearish Market Behavior:
The Z-Score of Price tells you how strong or weak the price movement is relative to its past performance.
The Z-Score of Active Addresses reveals whether more users are interacting with the Bitcoin network, which can be an indication of growing interest or market activity.
When both the price and active address Z-Scores are high, it may indicate a strong bull market, while low Z-Scores may point to a bear market or decreasing interest.
Overbought/Oversold Conditions:
The upper and lower threshold lines help you visualize when the Z-Scores for either price or active addresses have reached extreme values, signaling potential overbought or oversold conditions.
For example, if the Price Z-Score exceeds the upper threshold (e.g., +2), it might indicate that the price has risen too quickly, and a correction may be due. Conversely, if it falls below the lower threshold (e.g., -2), it may indicate a potential buying opportunity.
Important Note on Activity and Price Movements:
After Rapid Price Increases:
A sharp increase in Bitcoin’s price followed by a spike in active addresses can be interpreted as a bearish signal. High network activity after a rapid price surge might indicate that investors are taking profits or that speculative interest is peaking, potentially signaling an upcoming correction or reversal.
After Extreme Price Declines:
Conversely, high network activity after a significant price drop may indicate a bottoming signal. A surge in active addresses during a price decline could suggest increased buying interest and potential accumulation, signaling that the market may be finding support and a reversal may be imminent.
Customization and Flexibility
The lookback period (default: 28 days) can be adjusted to suit different trading strategies or time horizons.
The smoothing length (default: 7 periods) allows for smoothing the Z-Score, making it easier to detect longer-term trends and reduce noise.
The upper and lower threshold values are fully customizable to adjust the indicator’s sensitivity to market conditions.
Conclusion
The Active Addresses Z-Score Indicator combines network activity with price data to give you a deeper understanding of the Bitcoin market. By analyzing the relationship between price changes and active address changes, this indicator helps you assess whether the market is experiencing unusual activity or if Bitcoin is trending in an extreme overbought or oversold condition.
It is a powerful tool for fundamental analysis and can complement traditional technical indicators for a more comprehensive trading strategy.
TrueDelta Candles📖 Description:
TrueDelta Candles is a precision tool for traders who want deeper insight into market sentiment through real-time volume delta analysis. Rather than using traditional volume bars, this indicator colors each chart candle based on the net volume delta—the difference between buying and selling volume—fetched from a lower timeframe.
🚀 Key Features:
🎯 Real Candle Coloring: Colors actual price candles based on delta volume—green (buying pressure), red (selling pressure).
⏱️ Multi-Timeframe Volume Analysis: Automatically selects the appropriate lower timeframe for better delta approximation, or lets you set a custom one.
🔬 Order Flow Insight: Visualizes the tug-of-war between buyers and sellers within each candle.
⚡ Lightweight & Non-Intrusive: No clutter—just clean color overlays on your chart candles.
🔄 Live Updating: Responds instantly as new data arrives.
🧠 Ideal For:
Intraday and scalping strategies.
Momentum and breakout traders.
Order flow enthusiasts looking for a visual edge.
🛠️ How It Works:
Behind the scenes, the script uses ta.requestVolumeDelta() to retrieve granular buy/sell volume data from a lower timeframe. The net delta volume then determines whether the candle is colored green (positive delta) or red (negative delta). This makes it easy to spot when market pressure aligns or diverges from price action.
⚙️ Settings:
Use Custom Timeframe: Manually select the lower timeframe used for delta calculation (e.g., "1", "5").
Default Auto Mode: Automatically adapts to your current chart resolution for optimal data balance.
If you're serious about understanding the real dynamics behind every candle, TrueDelta Candles adds an essential layer of volume-based context that price alone can't offer.

Goldman Sachs Risk Appetite ProxyRisk appetite indicators serve as barometers of market psychology, measuring investors' collective willingness to engage in risk-taking behavior. According to Mosley & Singer (2008), "cross-asset risk sentiment indicators provide valuable leading signals for market direction by capturing the underlying psychological state of market participants before it fully manifests in price action."
The GSRAI methodology aligns with modern portfolio theory, which emphasizes the importance of cross-asset correlations during different market regimes. As noted by Ang & Bekaert (2002), "asset correlations tend to increase during market stress, exhibiting asymmetric patterns that can be captured through multi-asset sentiment indicators."
Implementation Methodology
Component Selection
Our implementation follows the core framework outlined by Goldman Sachs research, focusing on four key components:
Credit Spreads (High Yield Credit Spread)
As noted by Duca et al. (2016), "credit spreads provide a market-based assessment of default risk and function as an effective barometer of economic uncertainty." Higher spreads generally indicate deteriorating risk appetite.
Volatility Measures (VIX)
Baker & Wurgler (2006) established that "implied volatility serves as a direct measure of market fear and uncertainty." The VIX, often called the "fear gauge," maintains an inverse relationship with risk appetite.
Equity/Bond Performance Ratio (SPY/IEF)
According to Connolly et al. (2005), "the relative performance of stocks versus bonds offers significant insight into market participants' risk preferences and flight-to-safety behavior."
Commodity Ratio (Oil/Gold)
Baur & McDermott (2010) demonstrated that "gold often functions as a safe haven during market turbulence, while oil typically performs better during risk-on environments, making their ratio an effective risk sentiment indicator."
Standardization Process
Each component undergoes z-score normalization to enable cross-asset comparisons, following the statistical approach advocated by Burdekin & Siklos (2012). The z-score transformation standardizes each variable by subtracting its mean and dividing by its standard deviation: Z = (X - μ) / σ
This approach allows for meaningful aggregation of different market signals regardless of their native scales or volatility characteristics.
Signal Integration
The four standardized components are equally weighted and combined to form a composite score. This democratic weighting approach is supported by Rapach et al. (2010), who found that "simple averaging often outperforms more complex weighting schemes in financial applications due to estimation error in the optimization process."
The final index is scaled to a 0-100 range, with:
Values above 70 indicating "Risk-On" market conditions
Values below 30 indicating "Risk-Off" market conditions
Values between 30-70 representing neutral risk sentiment
Limitations and Differences from Original Implementation
Proprietary Components
The original Goldman Sachs indicator incorporates additional proprietary elements not publicly disclosed. As Goldman Sachs Global Investment Research (2019) notes, "our comprehensive risk appetite framework incorporates proprietary positioning data and internal liquidity metrics that enhance predictive capability."
Technical Limitations
Pine Script v6 imposes certain constraints that prevent full replication:
Structural Limitations: Functions like plot, hline, and bgcolor must be defined in the global scope rather than conditionally, requiring workarounds for dynamic visualization.
Statistical Processing: Advanced statistical methods used in the original model, such as Kalman filtering or regime-switching models described by Ang & Timmermann (2012), cannot be fully implemented within Pine Script's constraints.
Data Availability: As noted by Kilian & Park (2009), "the quality and frequency of market data significantly impacts the effectiveness of sentiment indicators." Our implementation relies on publicly available data sources that may differ from Goldman Sachs' institutional data feeds.
Empirical Performance
While a formal backtest comparison with the original GSRAI is beyond the scope of this implementation, research by Froot & Ramadorai (2005) suggests that "publicly accessible proxies of proprietary sentiment indicators can capture a significant portion of their predictive power, particularly during major market turning points."
References
Ang, A., & Bekaert, G. (2002). "International Asset Allocation with Regime Shifts." Review of Financial Studies, 15(4), 1137-1187.
Ang, A., & Timmermann, A. (2012). "Regime Changes and Financial Markets." Annual Review of Financial Economics, 4(1), 313-337.
Baker, M., & Wurgler, J. (2006). "Investor Sentiment and the Cross-Section of Stock Returns." Journal of Finance, 61(4), 1645-1680.
Baur, D. G., & McDermott, T. K. (2010). "Is Gold a Safe Haven? International Evidence." Journal of Banking & Finance, 34(8), 1886-1898.
Burdekin, R. C., & Siklos, P. L. (2012). "Enter the Dragon: Interactions between Chinese, US and Asia-Pacific Equity Markets, 1995-2010." Pacific-Basin Finance Journal, 20(3), 521-541.
Connolly, R., Stivers, C., & Sun, L. (2005). "Stock Market Uncertainty and the Stock-Bond Return Relation." Journal of Financial and Quantitative Analysis, 40(1), 161-194.
Duca, M. L., Nicoletti, G., & Martinez, A. V. (2016). "Global Corporate Bond Issuance: What Role for US Quantitative Easing?" Journal of International Money and Finance, 60, 114-150.
Froot, K. A., & Ramadorai, T. (2005). "Currency Returns, Intrinsic Value, and Institutional-Investor Flows." Journal of Finance, 60(3), 1535-1566.
Goldman Sachs Global Investment Research (2019). "Risk Appetite Framework: A Practitioner's Guide."
Kilian, L., & Park, C. (2009). "The Impact of Oil Price Shocks on the U.S. Stock Market." International Economic Review, 50(4), 1267-1287.
Mosley, L., & Singer, D. A. (2008). "Taking Stock Seriously: Equity Market Performance, Government Policy, and Financial Globalization." International Studies Quarterly, 52(2), 405-425.
Oppenheimer, P. (2007). "A Framework for Financial Market Risk Appetite." Goldman Sachs Global Economics Paper.
Rapach, D. E., Strauss, J. K., & Zhou, G. (2010). "Out-of-Sample Equity Premium Prediction: Combination Forecasts and Links to the Real Economy." Review of Financial Studies, 23(2), 821-862.

Market Structure- ZigZag, Break of Structure & Order BlocksDescription:
This script is an all-in-one market structure tool designed for traders who follow price action, Smart Money Concepts (SMC), or institutional order flow. It combines Order Block detection , Break of Structure (BOS) , Internal Structure Shifts (CHoCH) , and a ZigZag swing framework to provide a clear and actionable view of market behavior.
Key Features:
Order Blocks (OB) :
-Detects Bullish (Green) and Bearish (Red) order blocks upon valid market structure shifts.
-Optional deletion of mitigated (touched) blocks to keep charts clean.
-Customizable block duration, fill color, and border color.
Break of Structure (BOS) :
-Marks BOS with horizontal dotted lines when price breaks previous swing highs/lows.
-Confirms new trends and structural shifts.
Internal Structure Shifts (CHoCH-like) :
-Detects early internal changes in direction before BOS.
-User-selectable logic: based on candle Open or High/Low.
-Plotted as small black triangle markers.
ZigZag Swings :
-Connects confirmed internal shifts with black zigzag lines.
-Visually simplifies trend structure and major swing points.
-Tracks last swing highs/lows for BOS validation.
Alerts :
-Bullish/Bearish Engulfments (OB signals)
-Internal Structure Shifts
-Bullish/Bearish Break of Structure
-OB Mitigation Events
Inputs & Settings :
-Show/Hide Bullish or Bearish Order Blocks
-Calculate internal shifts by: Open or High/Low
-Set order block fill and border colors
-Enable or disable automatic deletion of mitigated blocks
-Set duration for order block display
This tool is designed to support price action trading by visually mapping key structural changes and zones of interest directly on your chart. It is not intended to function as a standalone trading strategy , but rather as a supplementary tool to inform your own analysis and discretion.

BTC Mining Income Oscillator Z-ScoreBTC Mining Income Oscillator (Z-Score)
Overview
The BTC Mining Income Oscillator (Z-Score) is a custom technical indicator that analyzes Bitcoin mining income to help traders identify overbought and oversold conditions. The indicator uses a Z-Score to track deviations in mining income, highlighting periods of high or low mining profitability.
This indicator is made up of:
Z-Score Line (Blue): Measures how far the current mining income deviates from its historical mean.
Mining Income Oscillator (Orange): A scaled value of mining income that oscillates within a specific range to indicate overbought and oversold conditions.
How the Indicator Works
1. Mining Income Calculation
The BTC Mining Income is determined using two main factors:
Block Reward: The number of BTC miners earn for each block mined (currently 3.125 BTC, adjustable in settings).
Transaction Fees: The average transaction fees per block (default is 0.3 BTC).
Blocks per Day: The number of blocks mined per day (default is 144).
The daily mining income in BTC is calculated as:
Mining Income
=
(
Block Reward
+
Transaction Fees
)
×
Blocks per Day
Mining Income=(Block Reward+Transaction Fees)×Blocks per Day
This value is then converted to USD by multiplying it by the current Bitcoin price.
2. Z-Score Calculation
The Z-Score measures how far the current mining income deviates from its mean over a set period (default is 90 days). The Z-Score helps identify when mining income is unusually high or low:
A high Z-Score indicates that the mining income is significantly above the historical mean, signaling overbought conditions.
A low Z-Score indicates that the mining income is significantly below the historical mean, signaling oversold conditions.
The Z-Score is calculated as follows:
Z-Score
=
(
Current Mining Income
−
Mean Income
)
Standard Deviation
Z-Score=
Standard Deviation
(Current Mining Income−Mean Income)
The result is then smoothed over a period (default is 5) to reduce noise and provide a more stable value.
3. Mining Income Oscillator
The mining income is scaled to oscillate between +20 and +90. This oscillation makes it easy to track overbought and oversold conditions in the market:
Values between 85 and 90 indicate overbought conditions (high mining profitability).
Values between 20 and 22 indicate oversold conditions (low mining profitability).
Values between 22 and 85 indicate neutral conditions, where mining profitability is normal.
The mining income oscillator helps traders spot extreme conditions (overbought or oversold) in mining profitability.
How to Read the Indicator
1. Z-Score Line (Blue)
The Z-Score represents how far current mining income is from the historical average.
Above +2: The mining income is unusually high, indicating an overbought market.
Below -2: The mining income is unusually low, indicating an oversold market.
Between -2 and +2: This range is neutral, where the mining income is within the average historical range.
2. Mining Income Oscillator (Orange)
The Mining Income Oscillator is scaled between 20 and 90.
85–90: Overbought conditions, indicating high mining profitability.
20–22: Oversold conditions, indicating low mining profitability.
22–85: Neutral conditions, indicating moderate mining profitability.
3. Background Shading
Red Shading (85–90): Indicates overbought conditions (mining income is unusually high).
Green Shading (20–22): Indicates oversold conditions (mining income is unusually low).
The shaded regions provide a visual guide to spot periods when the market is overbought or oversold.
4. Key Horizontal Lines
0 Line: Represents the neutral level for the Z-Score, where the mining income is at the historical mean.
+2 and -2 Lines: Indicate overbought and oversold conditions for the Z-Score.
90 and 20 Lines: Indicate the upper and lower bounds for the mining income oscillator.
Where the Data Comes From
Bitcoin Price: The current Bitcoin price is pulled directly from the chart.
Block Reward and Transaction Fees: These values are set manually by the user or can be updated dynamically.
Mining Income: Calculated based on the block reward, transaction fees, and current Bitcoin price.
Z-Score and Oscillator Calculations: Both are calculated based on mining income in USD over a defined look-back period.
Best Timeframe for This Indicator
This indicator is designed to work best on the 2-day chart (2D) timeframe. On the 2-day chart, the mining income data, Z-Score, and the oscillator are less sensitive to noise and short-term volatility, providing more reliable signals. While it can be used on other timeframes, the 2-day chart offers the clearest and most stable analysis.

VWAP Indicator Channel | Multi Timeframe by Osbrah📊 Multi-Timeframe VWAP Indicator (Session / Weekly / Monthly)
This powerful indicator plots the Volume Weighted Average Price (VWAP) across multiple timeframes: intraday session, weekly, and monthly. It's designed to give traders a clear understanding of the market’s fair value over different horizons.
Key Features:
* Display Session VWAP (resets daily)
* Enable Weekly and Monthly VWAPs for broader market context
* Customize colors, styles, and visibility for each VWAP
* Toggle between standard VWAP or anchored to session opens
Use Cases:
* Identify value zones where price tends to gravitate
* Spot institutional levels of interest and potential reversal points
* Align entries with VWAP bounces or breaks
* Combine with EMAs or price action for high-probability setups
Perfect for day traders, swing traders, and institutional-style strategies, this VWAP tool helps you stay aligned with volume-based price dynamics across all market phases.

ADX and DI - Trader FelipeADX and DI - Trader Felipe
This indicator combines the Average Directional Index (ADX) and the Directional Indicators (DI+ and DI-) to help traders assess market trends and their strength. It is designed to provide a clear view of whether the market is in a trending phase (either bullish or bearish) and helps identify potential entry and exit points.
What is ADX and DI?
DI+ (Green Line):
DI+ measures the strength of upward (bullish) price movements. When DI+ is above DI-, it signals that the market is experiencing upward momentum.
DI- (Red Line):
DI- measures the strength of downward (bearish) price movements. When DI- is above DI+, it suggests that the market is in a bearish phase, with downward momentum.
ADX (Blue Line):
ADX quantifies the strength of the trend, irrespective of whether it is bullish or bearish. The higher the ADX, the stronger the trend:
ADX > 20: Indicates a trending market (either up or down).
ADX < 20: Indicates a weak or sideways market with no clear trend.
Threshold Line (Gray Line):
This horizontal line, typically set at 20, represents the threshold for identifying whether the market is trending or not. If ADX is above 20, the market is considered to be in a trend. If ADX is below 20, it suggests that the market is not trending and is likely in a consolidation phase.
Summary of How to Use the Indicator:
Trend Confirmation: Use ADX > 20 to confirm a trending market. If ADX is below 20, avoid trading.
Long Entry: Enter a long position when DI+ > DI- and ADX > 20.
Short Entry: Enter a short position when DI- > DI+ and ADX > 20.
Avoid Sideways Markets: Do not trade when ADX is below 20. Look for other strategies for consolidation phases.
Exit Strategy: Exit the trade if ADX starts to decline or if the DI lines cross in the opposite direction.
Combine with Other Indicators: Use additional indicators like RSI, moving averages, or support/resistance to filter and confirm signals.

US Growth Momentum Index (UGMI)US Growth Momentum Index (UGMI) is a macroeconomic indicator designed to reflect the current economic health of the United States. The index combines four key economic factors—Industrial Production (INDPRO), Retail Sales (RSAFS), Unemployment Rate (UNRATE), and the 10Y-2Y Yield Curve Spread—and aggregates them into a single line representing overall growth momentum.
The UGMI is based on Z-Score calculations for each of these components, helping to identify whether the U.S. economy is in an expansionary growth phase or a contractionary recession phase.
How to Read the UGMI:
Core Growth Line (Blue): This is the main line representing the aggregated growth momentum. It is calculated using the Z-scores of the key economic indicators.
0 Line: The 0 line represents the neutral zone. If the UGMI is above the 0 line, it suggests that the economy is expanding. Below the 0 line indicates contraction or a potential recession.
Zones Above 1: When the UGMI is above 1, it represents a strong expansionary phase or boom, possibly signaling the top of a bull market or local peak.
Zones Below -1: When the UGMI falls below -1, it indicates a severe recession or significant contraction in the economy.
Color Coding:
Green: When the UGMI is above the 1 line, the background turns green, indicating a strong growth phase.
Red: When the UGMI is below -1, the background turns red, representing a recession or significant economic downturn.
This indicator helps traders and investors to understand whether the economy is growing or contracting, and is especially useful for identifying potential market tops or turning points.

Market Sentiment Index US Top 40 [Pt]▮Overview
Market Sentiment Index US Top 40 [Pt} shows how the largest US stocks behave together. You pick one simple measure—High Low breakouts, Above Below moving average, or RSI overbought/oversold—and see how many of your chosen top 10/20/30/40 NYSE or NASDAQ names are bullish, neutral, or bearish.
This tool gives you a quick view of broad-market strength or weakness so you can time trades, confirm trends, and spot hidden shifts in market sentiment.
▮Key Features
► Three Simple Modes
High Low Index: counts stocks making new highs or lows over your lookback period
Above Below MA: flags stocks trading above or below their moving average
RSI Sentiment: marks overbought or oversold stocks and plots a small histogram
► Universe Selection
Top 10, 20, 30, or 40 symbols from NYSE or NASDAQ
Option to weight by market cap or treat all symbols equally
► Timeframe Choice
Use your chart’s timeframe or any intraday, daily, weekly, or monthly resolution
► Histogram Smoothing
Two optional moving averages on the sentiment bars
Markers show when the faster average crosses above or below the slower one
► Ticker Table
Optional on-chart table showing each ticker’s state in color
Grid or single-row layout with adjustable text size and color settings
▮Inputs
► Mode and Lookback
Pick High Low, Above Below MA, or RSI Sentiment
Set lookback length (for example 10 bars)
If using Above Below MA, choose the moving average type (EMA, SMA, etc.)
► Universe Setup
Market: NYSE or NASDAQ
Number of symbols: 10, 20, 30, or 40
Weights: on or off
Timeframe: blank to match chart or pick any other
► Moving Averages on Histogram
Enable fast and slow averages
Set their lengths and types
Choose colors for averages and markers
► Table Options
Show or hide the symbol table
Select text size: tiny, small, or normal
Choose layout: grid or one-row
Pick colors for bullish, neutral, and bearish cells
Show or hide exchange prefixes
▮How to Read It
► Sentiment Bars
Green means bullish
Red means bearish
Near zero means neutral
► Zero Line
Separates bullish from bearish readings
► High Low Line (High Low mode only)
Smooth ratio of highs versus lows over your lookback
► MA Crosses
Fast MA above slow MA hints rising breadth
Fast MA below slow MA hints falling breadth
► Ticker Table
Each cell colored green, gray, or red for bull, neutral, or bear
▮Use Cases
► Confirm Market Trends
Early warning when price makes highs but breadth is weak
Catch rallies when breadth turns strong while price is flat
► Spot Sector Rotation
Switch between NYSE and NASDAQ to see which group leads
Watch tech versus industrial breadth to track money flow
► Filter Trade Signals
Enter longs only when breadth is bullish
Consider shorts when breadth turns negative
► Combine with Other Indicators
Use RSI Sentiment with trend tools to spot overextended moves
Add volume indicators in High Low mode for breakout confirmation
► Timeframe Analysis
Daily for big-picture bias
Intraday (15-min) for precise entries and exits

Internal Market Structure + Order BlocksInternal Market Structure + Order Blocks
This indicator combines internal market structure shifts with order block detection to help traders identify key zones of institutional interest and potential trend reversals. It highlights bullish and bearish engulfing conditions that mark the formation of valid order blocks, and it plots internal structure shifts—early signals that may precede a larger move.
Key Features:
-Bullish & Bearish Order Blocks: Highlighted with shaded boxes (green for bullish, red for bearish) following engulfing price action.
-Internal Structure Shifts: Small black triangles show early signs of a potential reversal, offering a unique perspective beyond standard structure analysis.
-Engulfing Breakouts: Marks when price breaks previous opposing structure, confirming new directional intent.
-Alerts Included: Get notified on key structure breaks and internal shifts to stay ahead of potential setups.
This tool is designed to support price action trading by visually mapping key structural changes and zones of interest directly on your chart. It is not intended to function as a standalone trading strategy , but rather as a supplementary tool to inform your own analysis and discretion.
Note: The arrows, polylines, and colored trendlines shown in the chart example are not generated by the indicator. They have been added manually for illustration purposes to demonstrate how the indicator can be used to trace market structure. Likewise, the order blocks in the example are manually drawn and may differ slightly from the indicator's automatic calculations, serving only to enhance visual clarity.

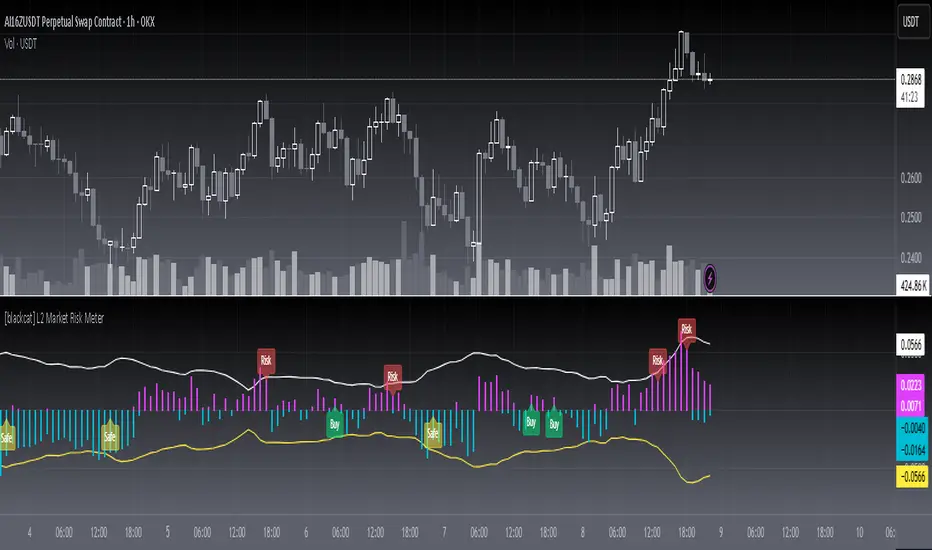
[blackcat] L2 Market Risk MeterOVERVIEW
The L2 Market Risk Meter is designed to evaluate market conditions using various technical indicators including Moving Averages (MA), Moving Average Convergence Divergence (MACD), and Bollinger Bands 📈🔍. By analyzing these elements, the script helps traders identify potential buying opportunities and assess the overall market sentiment more effectively. This comprehensive approach aids in making informed trading decisions by providing clear visual representations of critical market factors 🚀💸.
Key components include the calculation of short-term and long-term moving averages, MACD lines, and Bollinger Bands, which are then used to plot histograms and labels directly on the chart. These visual cues assist traders in quickly interpreting complex market data, thereby enhancing their ability to navigate volatile markets and capitalize on emerging trends ✅✨.
FEATURES
Advanced Technical Analysis:
Utilizes Short and Long Moving Averages (MAs) to capture different trend durations.
Implements MACD for detecting changes in the strength, direction, momentum, and duration of a trend.
Incorporates Bollinger Bands to measure volatility and provide dynamic support/resistance levels.
Comprehensive Visualization:
Generates colored histograms representing positive and negative MACD values.
Displays labels indicating "Safe," "Risk," and "Buy" signals at crucial points on the chart.
Flexible Settings:
Allows customization of the short_ma_period and long_ma_period to tailor the analysis to individual trading styles or asset types.
Provides configurable colors and styles for histograms and labels to suit personal preferences.
Real-Time Feedback:
Updates dynamically as new price data becomes available, ensuring timely insights.
Facilitates rapid identification of shifts in market conditions through clear graphical outputs.
HOW TO USE
Adding the Indicator:
Begin by adding the L2 Market Risk Meter to your chart on TradingView. You can do this via the "Pine Editor" located at the bottom of the screen. Simply copy-paste the script into the editor and click "Add to Chart."
Configuring Parameters:
Adjust the short_ma_period and long_ma_period inputs based on your preferred timeframes and strategies. For example, shorter periods will react faster but may be noisier, while longer periods offer smoother trends but slower reactions.
Interpreting Histograms:
Monitor the plotted histograms closely:
Positive Values: Represent bullish momentum where the closing prices are higher than the moving average.
Negative Values: Suggest bearish pressure when the closing prices fall below the moving average.
Understanding Labels:
Pay attention to generated labels for actionable insights:
"Safe" Zone: Appears when the price crosses from below to above the lower Bollinger Band, suggesting reduced risk.
"Risk" Zone: Indicates heightened caution if the price breaches upward from below the upper Bollinger Band.
"Buy" Signal: Triggered under stringent bullish conditions combining all predefined criteria, signaling an opportune moment to enter long positions.
Integrating with Other Tools:
Use the L2 Market Risk Meter alongside other technical studies and fundamental analyses to corroborate findings and strengthen your trading strategy.
Regular Review:
Periodically revisit and tweak your parameters and interpretations in light of changing market environments and performance evaluations.
LIMITATIONS
Dependency on Historical Data: Since the indicator relies extensively on historical price movements, its predictions about future trends should be viewed cautiously.
Not Standalone Solution: Like any other tool, it does not guarantee profitability and must be part of a holistic trading plan that includes multiple confirmation methods.
Parameter Sensitivity: Optimal performance depends greatly on selecting appropriate MA period lengths; improper choices could lead to misleading signals.
Volatility Assumptions: The effectiveness of Bollinger Bands varies across different market conditions, especially during low volatility phases where bands might fail to expand significantly.
NOTES
Understanding individual components such as MAs, MACDs, and Bollinger Bands is essential before fully depending on this script's output.
Always backtest any new strategy incorporating this meter thoroughly against diverse market scenarios to gauge reliability.
Consider employing supplementary filters like volume spikes or candlestick patterns to validate signals further.
Be mindful of sudden news events or economic releases impacting asset prices independently of underlying trends highlighted here.
THANKS
A big thank you goes out to fellow members of the TradingView community who have contributed invaluable feedback and suggestions throughout the development process of this indicator 🙏. Your input has been instrumental in refining and improving the functionality and usability of the L2 Market Risk Meter. Continue sharing your experiences so we can collectively enhance our trading capabilities!
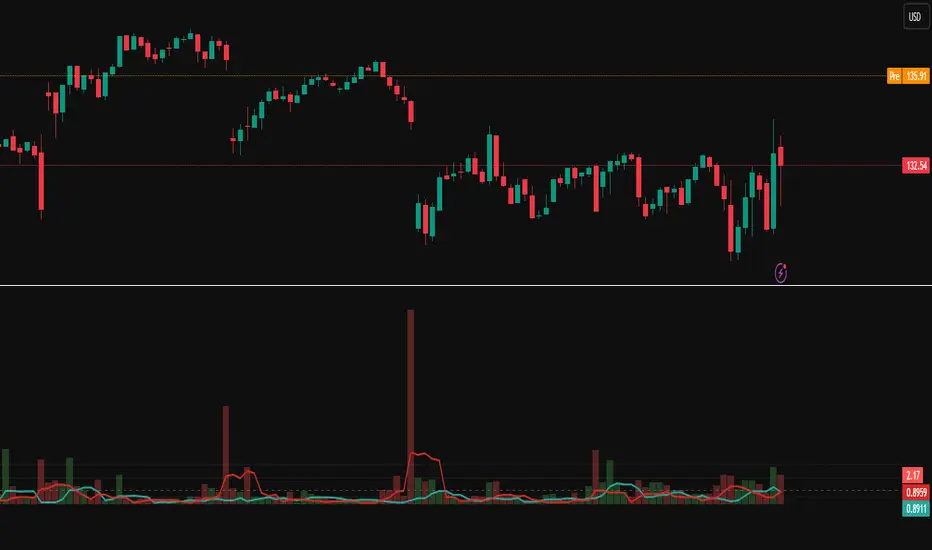
Relative Directional Volume Indicator# Relative Directional Volume Indicator (RelDirVol)
## Overview
The Relative Directional Volume Indicator (RelDirVol) is a powerful volume analysis tool that measures current trading volume relative to historical volume while differentiating between bullish and bearish volume flows. This indicator helps traders identify unusual volume activity and determine whether it's coming from buyers or sellers, providing deeper insights into market participation and potential trend strength.
## Features
- **Relative Volume Calculation**: Compares current volume to historical averages
- **Directional Volume Analysis**: Separates and visualizes bullish vs bearish volume
- **Multiple Moving Average Options**: Customize smoothing with various MA types (SMA, EMA, WMA, HMA, VWMA)
- **Split Moving Averages**: View distinct moving averages for bullish and bearish volume flows
- **Reference Lines**: Visual guides for normal volume (1.0x) and key deviation levels (0.5x, 2.0x, 3.0x)
- **Customizable Colors**: Adjust visual appearance for improved chart readability
## How It Works
The indicator calculates the relative volume by dividing the current bar's volume by the average volume over a specified lookback period. It then categorizes this volume as either bullish (when price closes above the open) or bearish (when price closes below or equal to the open).
1. **Relative Volume**: Current volume ÷ Average volume from previous N bars
2. **Directional Classification**: Assigns volume to bullish or bearish categories based on price action
3. **Moving Averages**: Applies user-selected moving average to smooth the data
The result is displayed as color-coded histogram bars showing the relative volume magnitude, with optional moving average lines for both overall and direction-specific volume trends.
## Interpretation
### Volume Magnitude
- **Above 1.0**: Higher than average volume (more participation than normal)
- **Below 1.0**: Lower than average volume (less participation than normal)
- **2.0+**: Volume twice the normal level (significant participation)
- **3.0+**: Volume three times normal (exceptional participation, often at key events)
### Directional Analysis
- **Strong Green Bars**: Heavy bullish participation driving prices up
- **Strong Red Bars**: Heavy bearish participation driving prices down
- **Bullish MA > Bearish MA**: Overall buying pressure dominating
- **Bearish MA > Bullish MA**: Overall selling pressure dominating
### Key Signals
- **Volume Spikes with Price Breakouts**: Confirms strength of the move
- **Divergence Between MAs**: Early warning of potential shift in market control
- **Sustained Above-Average Volume**: Strong trend continuation likely
- **Volume Decline After Spike**: Potential exhaustion of trend
## Settings
- **Relative Volume Lookback**: Comparison period for average volume (default: 20)
- **Moving Average Type**: Method used for smoothing (default: SMA)
- **Moving Average Length**: Smoothing period (default: 5)
- **Show Moving Average**: Toggle overall volume MA visibility
- **Show Baseline**: Toggle 1.0 reference line visibility
- **Show Bullish/Bearish MAs**: Toggle direction-specific MA visibility
## Best Practices
This indicator performs best when combined with price action analysis and other indicators. Look for:
1. Volume confirmation of breakouts and trend changes
2. Divergence between price movement and volume direction
3. Shifts in the relationship between bullish and bearish MAs
4. Unusual volume patterns during consolidation phases
Particularly effective for swing trading, day trading, and identifying institutional participation in market moves across multiple timeframes.
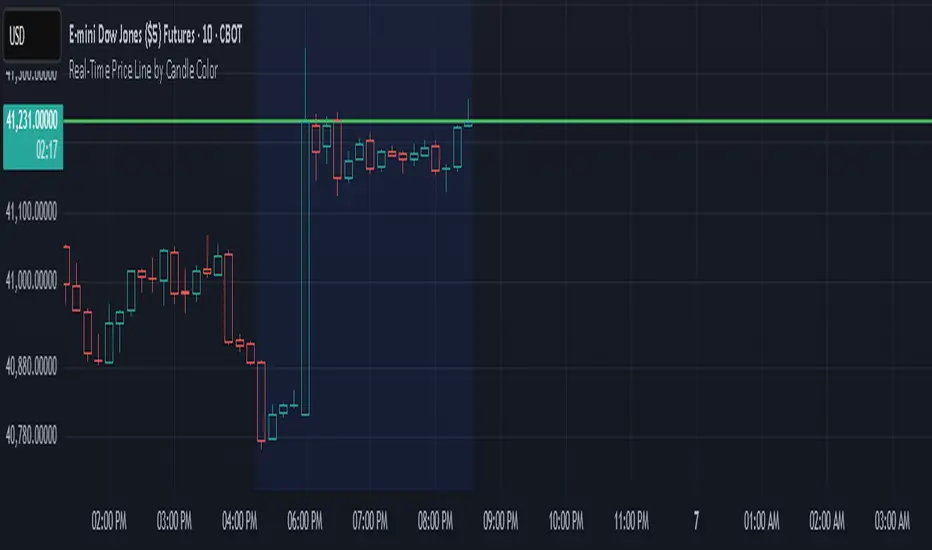
Real-Time Price Line by Candle ColorThis indicator draws a horizontal line at the current price that updates in real time on each candle. The line:
Extends infinitely left and right
Changes color based on the current candle:
🟢 Green if the candle is bullish (close ≥ open)
🔴 Red if the candle is bearish (close < open)
Automatically clears and redraws each bar to reflect the latest price and direction
Use this as a simple but effective visual aid to track the live price and its directional bias.
Overnight Bias: Net Long/Short with PercentOvernight bias can assist with NY session gap fades or gap and go trading once the NY session is open.
Some general gap rules are:
1. Gap Direction Aligned with Overnight Bias
Rule: If the NY session gaps up and the overnight bias is Net Long (e.g., >60% of bars above the overnight open), favor longs.
Confirmation: Look for price to hold above overnight open or VWAP.
Invalidation: If price re-enters the overnight range, reassess.
2. Gap Opposing Overnight Bias (Contrarian Setup)
Rule: If the NY opens opposite the overnight bias, expect potential gap fill or reversal.
Trade Bias: Look for retracement back toward the overnight open or VWAP.
Example: Overnight was Net Long, but NY gaps down → wait for reclaim of VWAP to go long, else fade strength.
3. Gap Into Prior Day Value Area (VAH to VAL)
Rule: If the NY session gaps into the prior day value area:
It implies mean reversion behavior.
Expect price to rotate toward the POC (point of control).
Trade Bias: Fade toward POC if overnight bias is balanced or opposite the gap direction.
4. Gap Outside Prior Day Value Area
Rule: A gap above VAH or below VAL suggests potential breakout or new trend day.
Trade Bias: If overnight bias aligns (e.g., gap above VAH + Net Long overnight), consider trend continuation.
Invalidation: If price breaks back inside the prior day value area, watch for failed breakout → fade trade possible.
5. Gap Above Prior Day High / Below Prior Day Low
Rule: This is a true breakout gap.
Above Prior High + Net Long Bias: Look for continuation.
Below Prior Low + Net Short Bias: Look for sell pressure continuation.
Trade Bias: Use pullbacks to the prior high/low or overnight open for continuation setups.
6. Gap Within Prior Day Range
Rule: If the NY open is within the prior day’s high and low, expect chop or balanced conditions.
Trade Bias: Use overnight VWAP and prior POC as decision zones. Be cautious unless a breakout occurs.
7. Failed Gap and Re-entry into Prior Day Range
Rule: If price gaps above prior high but re-enters the prior range, it's a failed breakout.
Trade Bias: Look for a fade back to VAH or POC.
Confirmation: Watch for breakdown below overnight VWAP or failure to hold overnight open.
8. Gap + Overnight VWAP Divergence
Rule: If price gaps opposite the direction of VWAP (e.g., VWAP rising, gap down), wait for confirmation.
Trade Bias: Be cautious with early trades. Bias may flip if VWAP is reclaimed.
9. Gap + Overnight Open Test
Rule: If price opens with a gap and then retests the overnight open, that level becomes a decision zone.
Trade Bias:
Hold above = trend continuation.
Rejection = gap fill or reversal.
10. Unfilled Gap = Trend Bias
Rule: If the gap remains unfilled for the first 30–60 minutes, it increases the odds of a trend day.
Trade Bias: Trade pullbacks in the direction of the gap and overnight bias.
Should anyone have suggestion to add please do so.

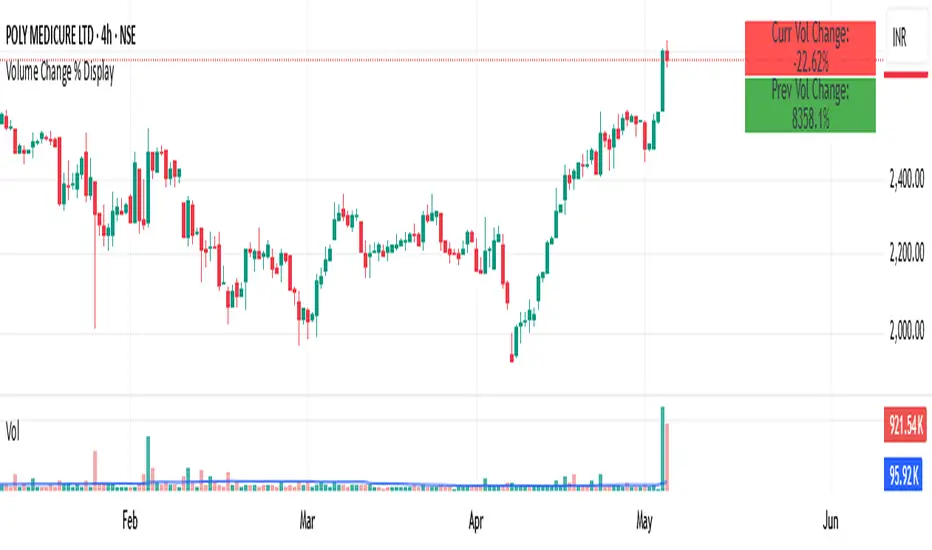
Volume Change % Display1- Current bar's volume change %
2- Previous bar's volume change %
* Each line uses its own color based on volume rising or falling.
* Keeps the layout compact and readable.
Multitimeframe Order Block Finder (Zeiierman)█ Overview
The Multitimeframe Order Block Finder (Zeiierman) is a powerful tool designed to identify potential institutional zones of interest — Order Blocks — across any timeframe, regardless of what chart you're viewing.
Order Blocks are critical supply and demand zones formed by the last opposing candle before an impulsive move. These areas often act as magnets for price and serve as smart-money footprints — ideal for anticipating reversals, retests, or breakouts.
This indicator not only detects such zones in real-time, but also visualizes their mitigation, bull/bear volume pressure, and a smoothed directional trendline based on Order Block behavior.
█ How It Works
The script fetches OHLCV data from your chosen timeframe using request.security() and processes it using strict pattern logic and volume-derived strength conditions. It detects Order Blocks only when the structure aligns with dominant pressure and visually extends valid zones forward for as long as they remain unmitigated.
⚪ Bull/Bear Volume Power Visualization
Each OB includes proportional bars representing estimated buy/sell effort:
Buy Power: % of volume attributed to buyers
Sell Power: % of volume attributed to sellers
This adds a visual, intuitive layer of intent — showing who controlled the price before the OB formed.
⚪ Order Block Trendline (Butterworth Filtered)
A smoothed trendline is derived from the average OB value over time using a two-pole Butterworth low-pass filter. This helps you understand the broader directional pressure:
Trendline up → favor bullish OBs
Trendline down → favor bearish OBs
█ How to Use
⚪ Trade From Order Blocks Like Institutions
Use this tool to find institutional footprints and reaction zones:
Enter at unmitigated OBs
⚪ Volume Power
Volume Pressure Bars inside each OB help you:
Confirm strong buyer/seller dominance
Detect possible traps or exhaustion
Understand how each zone formed
⚪ Find Trend & Pullbacks
The trendline not only helps traders detect the current trend direction, but the built-in trend coloring also highlights potential pullback areas within these trends.
█ Settings
Timeframe – Selects which timeframe to scan for Order Blocks.
Lookback Period – Defines how many bars back are used to detect bullish or bearish momentum shifts.
Sensitivity – When enabled, the indicator uses smoothed price (RMA) with rising/falling logic instead of raw candle closes. This allows more flexible detection of trend shifts and results in more Order Blocks being identified.
Minimum Percent Move – Filters out weak moves. Higher = only strong price shifts.
Mitigated on Mid – OB is removed when price touches its midpoint.
Show OB Table – Displays a panel listing all active (unmitigated) Order Blocks.
Extend Boxes – Controls how far OB boxes stretch into the future.
Show OB Trend – Toggles the trendline derived from Order Block strength.
Passband Ripple (dB) – Controls trendline reactivity. Higher = more sensitive.
Cutoff Frequency – Controls smoothness of trendline (0–0.5). Lower = smoother.
-----------------
Disclaimer
The content provided in my scripts, indicators, ideas, algorithms, and systems is for educational and informational purposes only. It does not constitute financial advice, investment recommendations, or a solicitation to buy or sell any financial instruments. I will not accept liability for any loss or damage, including without limitation any loss of profit, which may arise directly or indirectly from the use of or reliance on such information.
All investments involve risk, and the past performance of a security, industry, sector, market, financial product, trading strategy, backtest, or individual's trading does not guarantee future results or returns. Investors are fully responsible for any investment decisions they make. Such decisions should be based solely on an evaluation of their financial circumstances, investment objectives, risk tolerance, and liquidity needs.

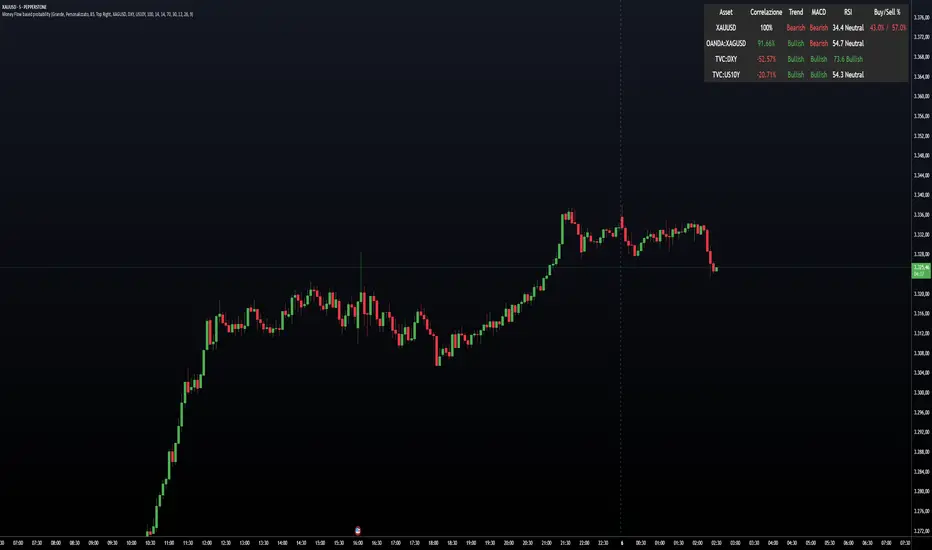
Money Flow based probabilityMoney Flow based probability
This indicator provides a comprehensive correlation and momentum analysis between your main asset and up to three selected correlated assets. It combines correlation, trend, momentum, and overbought/oversold signals into a single, easy-to-read table directly on your chart.
Correlated Asset Selection :
You can select up to three correlated assets (e.g., indices, currencies, bonds) to compare with your main chart symbol. Each asset can be toggled on or off.
Correlation Calculation :
The indicator uses the native Pine Script ta.correlation function to measure the statistical relationship between the closing prices of your asset and each selected pair over a user-defined period.
Technical Analysis Integration :
For each asset (including the main one), the indicator calculates:
Trend direction using EMA (Exponential Moving Average) – optional
Momentum using MACD – optional
Overbought/oversold status using RSI – optional
Probability Scoring :
A weighted scoring system combines correlation, trend, MACD, RSI, and trend exhaustion signals to produce buy and sell probabilities for the main asset.
Visual Table Output :
A customizable table is displayed on the chart, showing:
Asset name
Correlation (as a percentage, -100% to +100%)
Trend (Bullish/Bearish)
MACD status (Bullish/Bearish)
RSI value and status
Buy/Sell probability (with fixed-width formatting for stability)
User Customization :
You can adjust:
Table size, color, and position
Correlation period
EMA, MACD, and RSI parameters
Which assets to display
This indicator is ideal for traders who want to quickly assess the influence of major correlated markets and technical signals on their trading instrument, all in a single glance.
---
Example: Correlation Calculation
corrCurrentAsset1 = ta.correlation(close, asset1Data, correlationPeriod)
Example: Table Output (Buy/Sell %)
buyStr = f_formatPercent(buyProbability) + "%"
sellStr = f_formatPercent(sellProbability) + "%"
cellStr = buyStr + " / " + sellStr
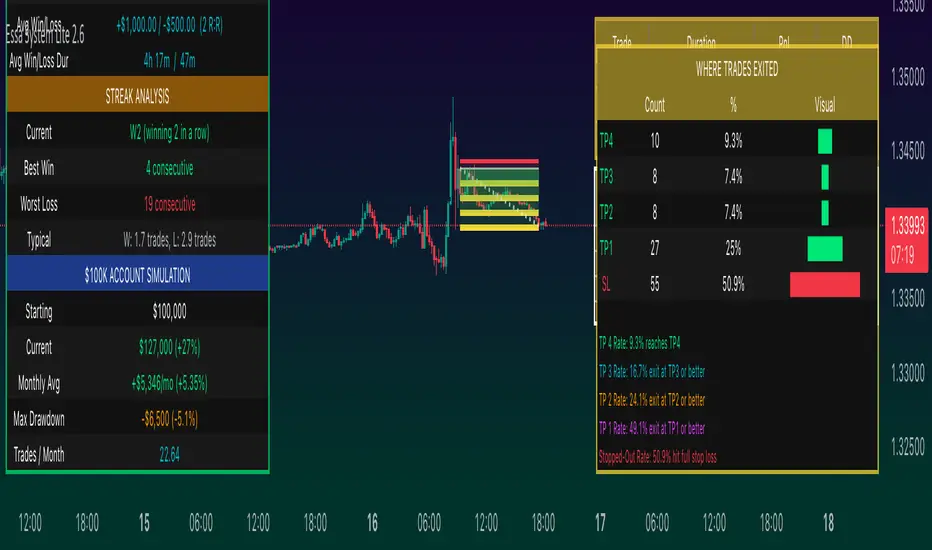
The Echo System🔊 The Echo System – Trend + Momentum Trading Strategy
Overview:
The Echo System is a trend-following and momentum-based trading tool designed to identify high-probability buy and sell signals through a combination of market trend analysis, price movement strength, and candlestick validation.
Key Features:
📈 Trend Detection:
Uses a 30 EMA vs. 200 EMA crossover to confirm bullish or bearish trends.
Visual trend strength meter powered by percentile ranking of EMA distance.
🔄 Momentum Check:
Detects significant price moves over the past 6 bars, enhanced by ATR-based scaling to filter weak signals.
🕯️ Candle Confirmation:
Validates recent price action using the previous and current candle body direction.
✅ Smart Conditions Table:
A live dashboard showing all trade condition checks (Trend, Recent Price Move, Candlestick confirmations) in real-time with visual feedback.
📊 Backtesting & Stats:
Auto-calculates average win, average loss, risk-reward ratio (RRR), and win rate across historical signals.
Clean performance dashboard with color-coded metrics for easy reading.
🔔 Alerts:
Set alerts for trade signals or significant price movements to stay updated without monitoring the chart 24/7.
Visuals:
Trend markers and price movement flags plotted directly on the chart.
Dual tables:
📈 Conditions table (top-right): breaks down trade criteria status.
📊 Performance table (bottom-right): shows real-time stats on win/loss and RRR.🔊 The Echo System – Trend + Momentum Trading Strategy
Overview:
The Echo System is a trend-following and momentum-based trading tool designed to identify high-probability buy and sell signals through a combination of market trend analysis, price movement strength, and candlestick validation.
Key Features:
📈 Trend Detection:
Uses a 30 EMA vs. 200 EMA crossover to confirm bullish or bearish trends.
Visual trend strength meter powered by percentile ranking of EMA distance.
🔄 Momentum Check:
Detects significant price moves over the past 6 bars, enhanced by ATR-based scaling to filter weak signals.
🕯️ Candle Confirmation:
Validates recent price action using the previous and current candle body direction.
✅ Smart Conditions Table:
A live dashboard showing all trade condition checks (Trend, Recent Price Move, Candlestick confirmations) in real-time with visual feedback.
📊 Backtesting & Stats:
Auto-calculates average win, average loss, risk-reward ratio (RRR), and win rate across historical signals.
Clean performance dashboard with color-coded metrics for easy reading.
🔔 Alerts:
Set alerts for trade signals or significant price movements to stay updated without monitoring the chart 24/7.
Visuals:
Trend markers and price movement flags plotted directly on the chart.
Dual tables:
📈 Conditions table (top-right): breaks down trade criteria status.
📊 Performance table (bottom-right): shows real-time stats on win/loss and RRR.
Market Manipulation Index (MMI)The Composite Manipulation Index (CMI) is a structural integrity tool that quantifies how chaotic or orderly current market conditions are, with the aim of detecting potentially manipulated or unstable environments. It blends two distinct mathematical models that assess price behavior in terms of both structural rhythm and predictability.
1. Sine-Fit Deviation Model:
This component assumes that ideal, low-manipulation price behavior resembles a smooth oscillation, such as a sine wave. It generates a synthetic sine wave using a user-defined period and compares it to actual price movement over an adaptive window. The error between the real price and this synthetic wave—normalized by price variance—forms the Sine-Based Manipulation Index. A high error indicates deviation from natural rhythm, suggesting structural disorder.
2. Predictability-Based Model:
The second component estimates how well current price can be predicted using recent price lags. A two-variable rolling linear regression is computed between the current price and two lagged inputs (close and close ). If the predicted price diverges from the actual price, this error—also normalized by price variance—reflects unpredictability. High prediction error implies a more manipulated or erratic environment.
3. Adaptive Mechanism:
Both components are calculated using an adaptive smoothing window based on the Average True Range (ATR). This allows the indicator to respond proportionally to market volatility. During high volatility, the analysis window expands to avoid over-sensitivity; during calm periods, it contracts for better responsiveness.
4. Composite Output:
The two normalized metrics are averaged to form the final CMI value, which is then optionally smoothed further. The output is scaled between 0 and 1:
0 indicates a highly structured, orderly market.
1 indicates complete structural breakdown or randomness.
Suggested Interpretation:
CMI < 0.3: Market is clean and structured. Trend-following or breakout strategies may perform better.
CMI > 0.7: Market is structurally unstable. Choppy price action, fakeouts, or manipulative behavior may dominate.
CMI 0.3–0.7: Transitional zone. Caution or reduced risk may be warranted.
This indicator is designed to serve as a contextual filter, helping traders assess whether current market conditions are conducive to structured strategies, or if discretion and defense are more appropriate.

Heikin Ashi Colored Regular OHLC CandlesHeikin Ashi Colored Regular OHLC Candles
In the world of trading, Heikin Ashi candles are a popular tool for smoothing out price action and identifying trends more clearly. However, Heikin Ashi candles do not reflect the actual open, high, low, and close prices of a market. They are calculated values that change the chart’s structure. This can make it harder to see precise price levels or use standard price-based tools effectively.
To get the best of both worlds, we can apply the color logic of Heikin Ashi candles to regular OHLC candles. This means we keep the true market data, but show the trend visually in the same smooth way Heikin Ashi candles do.
Why use this approach
Heikin Ashi color logic filters out noise and helps provide a clearer view of the current trend direction. Since we are still plotting real OHLC candles, we do not lose important price information such as actual highs, lows, or closing prices. This method offers a hybrid view that combines the accuracy of real price levels with the visual benefits of Heikin Ashi trend coloring. It also helps maintain visual consistency for traders who are used to Heikin Ashi signals but want to see real price action.
Advantages for scalping
Scalping requires fast decisions. Even small price noise can lead to hesitation or bad entries. Coloring regular candles based on Heikin Ashi direction helps reduce that noise and makes short-term trends easier to read. It allows for faster confirmation of momentum without switching away from real prices. Since the candles are not modified, scalpers can still place tight stop-losses and targets based on actual price structure. This approach also avoids clutter, keeping the chart clean and focused.
How it works
We calculate the Heikin Ashi values in the background. If the Heikin Ashi close is higher than the Heikin Ashi open, the trend is considered bullish and the candle is colored green. If the close is lower than the open, it is bearish and the candle is red. If they are equal, the candle is gray or neutral. We then use these colors to paint the real OHLC candles, which are unchanged in shape or position.
BTC Markup/Markdown Zones by Koenigsegg📈 BTC Markup/Markdown Zones
A handcrafted indicator designed to mark Bitcoin's most critical High Time Frame (HTF) structure shifts. This tool overlays true institutional-level Markup and Markdown Zones, selected manually after deep market review. Whether you're testing strategies or actively trading, this tool gives you the bigger picture at all times.
🔍 Key Features:
✅ HTF Markup & Markdown Zones
Every zone is manually selected — no indicators, no repainting. Just raw market history and real structure.
✅ Two Display Modes
• Background Zones — soft overlays with low opacity for visual context — with the option to increase opacity manually if desired.
• Start Candle Highlight — sharply highlighted candle marking the final pivot before a macro reversal.
✅ Custom Color Controls (Style Tab)
All visual styling lives in the Style tab, with clearly labeled fields:
• Markup Zone
• Markdown Zone
• Start Candle Highlight Markup
• Start Candle Highlight Markdown
✅ Minimal Input Section
Just one toggle: display mode. Everything else is kept clean and intuitive.
🧠 Purpose:
This script is made for any timeframe:
• Zoom into lower timeframes to know whether you're trading inside a Markup or Markdown
• Use it during strategy testing for true structural awareness
📅 Handpicked Macro Turning Points:
Each zone originates from a manually confirmed candle — the last meaningful candle before a shift in control between bulls and bears:
• FRI 19 AUG 2011 12PM – MARK DOWN
• THU 20 OCT 2011 12AM – MARK UP
• WED 10 APR 2013 12PM – MARK DOWN
• FRI 12 APR 2013 12PM – MARK UP
• SAT 30 NOV 2013 12AM – MARK DOWN
• WED 14 JAN 2015 12PM – MARK UP
• SUN 17 DEC 2017 12PM – MARK DOWN
• SAT 15 DEC 2018 12PM – MARK UP
• WED 14 APR 2021 4AM – MARK DOWN
• TUE 22 JUN 2021 12PM – MARK UP
• WED 10 NOV 2021 12PM – MARK DOWN
• MON 21 NOV 2022 8PM – MARK UP
• THU 14 MAR 2024 4AM – MARK DOWN
• MON 5 AUG 2024 12PM – MARK UP
• MON 20 JAN 2025 4AM – MARK DOWN
💡 Zones are manually updated by me after each new confirmed Markup or Markdown.
🧬 Fractal Structure for MTF Systems
Price is fractal — meaning the same principles of structure repeat across all timeframes. In Version 2, this tool evolves by introducing manually selected sub-zones inside each High Time Frame (HTF) Markup or Markdown. These sub-zones reflect Medium Timeframe (MTF) structure shifts, offering precision for traders who operate on both intraday and swing levels.
This makes the indicator ideal for low timeframe (LTF) Markup/Markdown awareness — whether you're managing 15m entries or building multi-timeframe confluence systems.
No auto-zones. No guesswork. Just clean, intentional structure division within the broader trend, handpicked for maximum clarity and edge.
💡 Pro Tip:
When price is inside a Markup Zone, shorting becomes riskier — you're trading against a macro bullish structure.
When inside a Markdown Zone, longing becomes riskier — you're fighting against confirmed bearish momentum.
Use this tool to stay aligned with the broader move, especially when zoomed into smaller timeframes or managing entries/exits during intraday setups.
📈 Markup Phase – Bullish Sentiment
Definition: A period where price makes higher highs and higher lows — the uptrend is in full force.
Why sentiment is bullish:
- Institutions and smart money are already positioned long.
- Public/institutional demand drives prices up.
- Momentum is supported by positive news, breakouts, and FOMO.
- Higher highs confirm buyers are in control.
📉 Markdown Phase – Bearish Sentiment
Definition: A period where price makes lower lows and lower highs — clear downtrend.
Why sentiment is bearish:
- Distribution has already occurred, and supply outweighs demand.
- Smart money is short or sidelined, waiting for deeper prices.
- Panic selling or trend-following traders add downside momentum.
- Lower lows confirm sellers are in control.
❌ Trading Against the Trend — Consequences:
-Reduced Probability of Success
-You’re fighting the dominant flow. Most participants are pushing in the opposite direction.
-Drawdowns & Stop-Outs
-Countertrend trades often get wicked or flushed before any meaningful move, especially without structure-based entries.
-Low Risk-Reward Ratio
-Trends offer sustained moves. Countertrend trades may have small take-profit zones or chop.
-Mental Drain & Doubt
-Fighting momentum causes anxiety, second-guessing, and emotional reactions.
-Missed Opportunities
-Focusing on fighting the trend makes you blind to the high-probability setups with the trend.
-Increased Transaction Costs
-More stop-outs and re-entries mean more fees, more friction.
-FOMO from Watching the Trend Run
-Entering countertrend means you might watch the trend explode without you.
-Confirmation Bias & Stubbornness
-Countertrend traders often look for reasons to justify staying in the wrong direction — leading to bigger losses.
🧠 Summary
In markup = bulls dominate → you swim with the current.
In markdown = bears dominate → going long is like pushing a rock uphill.
Trading with the trend is not just safer, it's smarter. The edge lives in momentum — not ego.
⚠️ Disclaimer
This indicator is for educational and analytical use only. It is not financial advice and should not be relied on for decision-making without personal analysis.
This is not a predictive tool. No indicator can forecast upcoming price movements.
What you see here is based purely on past market behavior — specifically, historical tops and bottoms that marked the start of confirmed reversals.
This script does not know where the next reversal begins, nor can it determine where a new Markup or Markdown starts or ends. It is designed to provide context, not prediction.
Always trade with responsibility and perform your own due diligence.
