High-Low IndexHello All,
High-Low Index is a breadth indicator based on Record High Percent (RHP). RHP is based on new 52-week highs and new 52-week lows. RHP => 100 * (new highs) / (new highs + new lows). High-Low Index is a 10-day Simple Moving Average of the RHP, which makes it a smoothed version of RHP. You can find many articles about High-Low Index on the net.
High-Low Index above 50 indicates that there are more new highs than new lows, and considered as Bullish.
High-Low Index below 50 indicates that there are more new lows than new highs, and considered as Bearish.
High-Low Index = 0 indicates there is no new highs (0% new highs).
High-Low Index = 100 indicates that there is at least 1 new high and no new lows.
and High-Low Index = 50 indicates that new highs and new lows is equal.
by default 40 cryptos are used in the script and shows High-Low Index for these cryptos. but you can change them as you wish. for example you can set all of them as stocks and see High-Low Index for these stocks.
You can set " Time frame " and the " Length " using the options. For example; if you set " Time frame " = 1 Week and the " Length " = 52 then it finds High-Low Index for 52weeks .
or another example; if you set " Time frame " = 1 Day and the " Length " = 22 the High-Low Indexn it finds High-Low Index for 22days.
You can enable/disable Record High Percent or Simple Moving Average of High-Low Index. Some traders use High-Low Index with its SMA, for example; High-Low Index generates a buy signal when it crosses above its moving average, and a sell signal when it crosses below its moving average.
Optionally you can see the securities in a table on the left bottom, you can change table size by usşng the options.
In the Table, for each security/cell;
=> if background is green then it has New High
=> if background is red then it has New Low
=> if background is gray then no New High, no New Low
=> if background is back then Data is not available for the security
As you can see in the screenshot below, the securities were changed and stocks are used instead of cryptos, so it calculates & shows High-Low Index for these stocks.
you can also find explanation in this screenshot:
Enjoy!
Простое скользящее среднее (SMA)

Offset Moving AverageWhile Moving Averages can often serve as excellent forms of support or resistance, they are rarely perfect. Often times the price will either stop short or penetrate the moving average and at times it can almost seem consistent. The Offset Moving Average indicator allows for a moving average to be offset by a percentage (as well as time) in order to see if the price has an offset correlation to a moving average.
Offset Moving Average supports a dual color line, in order to better see when the MA has been crossed. It can be used for an SMA , EMA , TEMA or VWMA average with an adjustable source, length and color.
Lastly, Offset Moving Average supports showing the daily moving average on all intervals. This can be disabled in Settings.
Have modification ideas for this indicator? Just let me know and I will gladly consider them!

Change of Moving Averages - TableChange of Moving Averages is a companion table that shows the change of the major moving averages rather than the moving averages themselves in order to more easily interpret momentum.
It can be used for an SMA , EMA , TEMA or VWMA averages with an adjustable source, length and time offset. It uses a daily interval but it can be disabled in settings in order to show the selected interval. The number of days used to calculate the change can be adjusted however this may produce unexpected results if the change is calculated across a peak or trough of the moving average.
More interested in the change of the moving averages over time? Check out "Change in Moving Averages - Chart":
Have modification ideas for this indicator? Just let me know and I will gladly consider them!
Change of Moving Averages - ChartChange of Moving Averages charts the change of the major moving averages rather than the moving averages themselves. This is done in a separate panel, rather than being overlaid in order to more easily interpret momentum.
Change of Moving Averages has dual colored lines, in order to better see when the MA has crossed zero(dotted line). It can be used for an SMA , EMA , TEMA or VWMA averages with an adjustable source, length and time offset. It uses a daily interval but it can be disabled in settings in order to show the selected interval. The number of days used to calculate the change can be adjusted however this may produce unexpected results if the change is calculated across a peak or trough of the moving average.
More interested in just the latest change in the moving averages? Check out the "Change in Moving Averages - Table", which is a simple overlay table:
Have modification ideas for this indicator? Just let me know and I will gladly consider them!

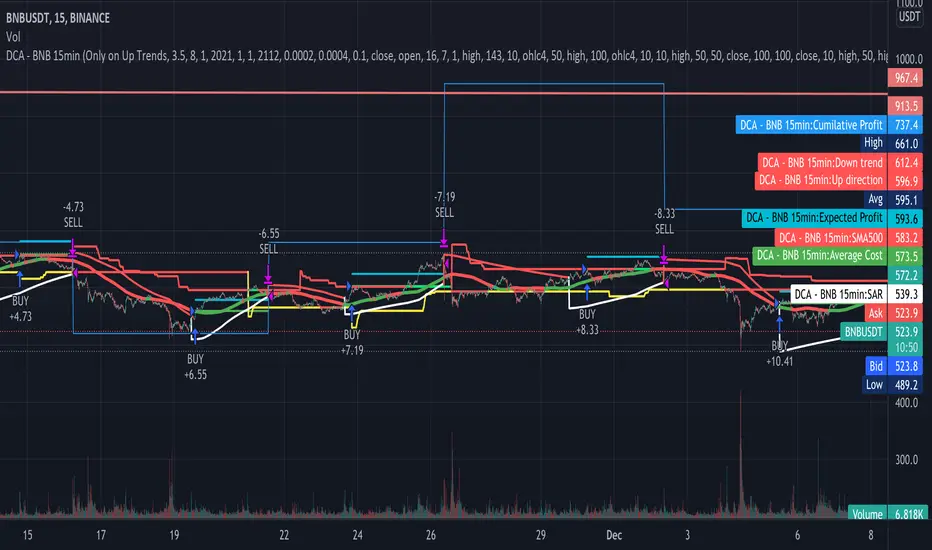
Dollar cost averaging This is a testing startergy based on dollar cost averaging and sell on high points.
UK Sectors Comparison SMAProvides a chart showing SMA of UK equity indexes from CBOE www.cboe.com
Shows either percentage change from baseline, or absolute index values.
All configurable (including selected symbols), but the defaults are:
SMA 100,
Show Absolute Values = true
Baseline is set to CBOEEU:BUKAC
Sector indexes are:
UK Consumer Cyclicals = CBOEEU:BUKCONC
UK Mining and Minerals = CBOEEU:BUKMINP
UK Finance = CBOEEU:BUKFIN
UK Technology = CBOEEU:BUKTEC
UK Telecoms = CBOEEU:BUKTEL
UK Consumer Services = CBOEEU:BUKCONS
UK Healthcare = CBOEEU:BUKHLTH
UK Energy = CBOEEU:BUKENGY
UK Utilities = CBOEEU:BUKUTL
UK Business Services = CBOEEU:BUKBUS
UK Consumer Non-Cyclicals = CBOEEU:BUKCNC
UK Industrials = CBOEEU:BUKIND
UK Non-Energy Minerals = CBOEEU:BUKNIM
NOTE: takes a few seconds to load as it needs to request all the data
Check the tooltips in the settings for detailed help.

Williams % + SMAThe indicator is based on finding the price relative to the moving average (SMA). The Williams Percentage Range indicator (%R) is used to filter the signals.
В основе индикатора лежит нахождение цены относительно скользящей средней (SMA). Для фильтрации сигналов используется индикатор "процентный диапазон Вильямса" (%R).

JC blended MAs v3The best, simplest moving averages you'll find.
Well not really. But it does have SMA, WMA, and EMA in one place. Plus an additional one that averages those, that might give you a leg up because it's not really a standard thing and you won't create a massive worldwide machine-driven feedback loop that crashes the markets (instead profit from them). Or something like that.
Each moving average has their own definable averaging length.
The master time resolution is also definable, or you can use the chart's. (The latter which is not very useful for moving averages, yet so many of them on trading view don't let you specify otherwise.)
For example you can set the master resolution to 5 minutes, 1 hour, 1 day, etc. (Default is 1 hour.) The graphs don't change, only the resolution.
Note: There are a few rare, extreme edge cases where the graphs won't render, which are obvious. In which case all you need to do is choose a more sane resolution. This is more about the limits of Trading View than specific script bugs.

Cloud Ribbon ++ by [JohnnySnow]Inspired by my favorite EMA ribbon - "EMA Ribbon " by fskrypt.
This Ribbon ADD the option to choose the avarage algorithm of the ribbon .
Created also to be more friendly to read along with trendlines and Fibonacci retracements.
For those like me that NOT use this ribbon to find exact price action but instead, to have a grasp of possible Support/Resistance strenght ahead.
High transparency lines and a configurable color palette for filling the background give the ribbon a look of support/ Resistance cloud Strenght.
Each MA length, line, and background color can be easily configured.

RM Moving averageIt is the first version of the crossover function which returns an arrow with the text "LONG"

MA_Script- Entry Point : base on MA20, MA50, MA100, MA200.
- Exit Point : base on stop loss, MA and trailing stop.
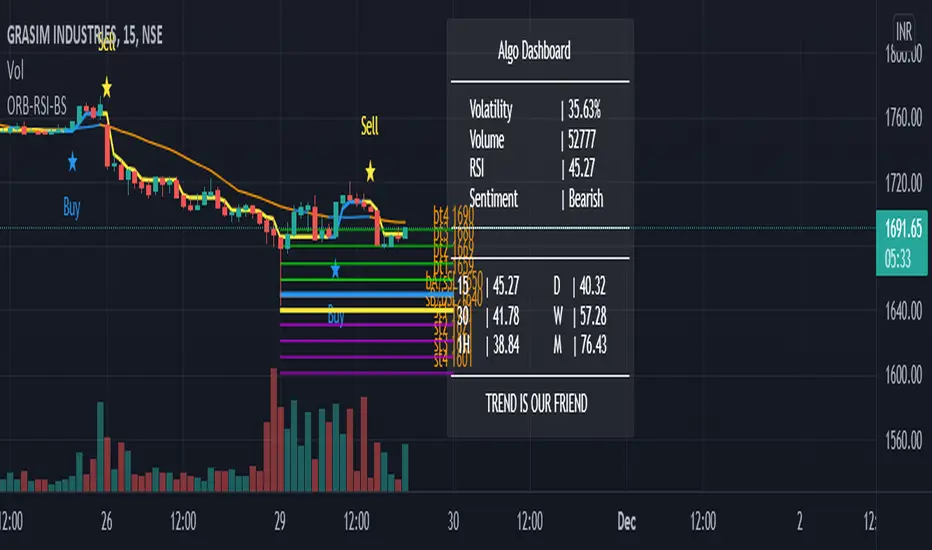
GANN-ORB-RSI-BSGann relied heavily on geometrical and numerical relationships
and created several tools to help with his work. Among these
tools are the Square of Nine, Square of 144, and the Hexagon.
The Square of Nine, or Square as we will refer to here, can be
constructed in at least two ways. The static Square has the
number 1 at the center and the dynamic Square has the historic
low of the time series in the center.
NRTH_ Momentum AlgoA NRTH_ Premium Momentum Based Strategy
Comes included with the Premium Package.
Indicator features
Built-In Alerts
Visual Risk Management
Customizable Entry Rules
4 Levels of confirmation
Customizable MA Ribbon
Usage Tips
This strategy is designed for Swing Trading and Intra-Day timeframes (1hr+)
The Algo uses multiple levels of convolution and confirmation before entering a trade, best used in trending markets. utilizing Stochasitc RSI overbought and oversold levels and an 1-3 MAs to identify trends and pullbacks.
Maximize the accuracy of your signals with up to 4 levels of convolution before entering a trade, filtering out the noise as much as possible.
You can set the overbought and oversold levels required for trade entries and set the types of MAs and how many are required to confirm trending momentum
Works for all markets with the ability to customize to your liking.
Backtesting Results Info
Period 23/9/2021-15/11/2021
Entry value at $1000 with 10x leverage
Binance standard taker fee rate (0.04%)
ATR Exits : 1:2.66 RR
-------------------------------------------
Disclaimer
Copyright NRTH_ Indicators 2021.
NRTH_ and all affiliated parties are not registered as financial advisors. The products & services NRTH_ offers are for educational purposes only and should not be construed as financial advice. You must be aware of the risks and be willing to bear any level of risk to invest in financial markets. Past performance is not necessarily indicative of future results. NRTH_ and all individuals associated assume no responsibility for your trading results or investments.
All investments involve risk, and the past performance of a security, industry, sector, market, financial product, trading strategy, or individual’s trading does not guarantee future results or returns. Investors are fully responsible for any investment decisions they make. Such decisions should be based solely on an evaluation of their financial circumstances, investment objectives, risk tolerance, and liquidity needs.

Moving Average Gradient (MAG) The Moving Average Gradient Indicator uses multiple Moving Averages to create a gradient. It creates continually more faint MAs, filled upwards or downwards to the price at a certain opacity. It can be used efficiently for stocks, forex, crypto, and more. This indicator combines numerous Moving Averages of your choice, a few of which include:
EMA
SMA
WMA
HMA
RMA
DMA
LSMA
VAMA
TMA
MF
Using this indicator will make entries more simple because crossovers and crossovers can more easily be detected, either manually or using alerts. These multiple Moving Averages allow for a smoothed out price trend, and the filtering of irregular and odd short-term price fluctuations. Due to the ample count of price trends that are widely used, it is difficult to view the market through the eyes of all types of investors/traders. This indicator manages to counter exactly that, you will be able to see all existing trends and enter/exit positions accordingly. This indicator can be used with all chart types and works well with many other indicators. It allows for complete customization and offers easy-to-understand settings which can be designated to a certain individual. You can modify every single factor of the MAs which allows for an even more personalized and adapted Indicator that reflects your trading/ investing inquiries. Most importantly, it looks cool.
A few of the technical settings you can change are:
Moving Average Count (Select how many do you want to be displayed.)
Moving Average Type (EMA, SMA, WMA, etc.)
Source (close, open, high, low)
Separate MA Length (The length of each Moving Average, its lookback. How many previous candles should it be based on? Choose each Moving Average's lookback length.)
You can also change the style settings of the indicators like:
Progressive opacity percentage (By how much will the next MAs fill affect the other? 1st: 50%, 3rd: 30%, 4th: 20%, 5th: 10%)
Bullish Candle Color
Bearish Candle Color
This indicator is unique because it can be used for all strategies and all trading styles, for example, day trading or long-term investing, really anything if used correctly. The reason it can be used in so many instances is a result of the detailed and in-depth settings tab. This allows the indicator to be used and to be useful in various situations and allows you to dominate the market. You can either increase the MA length difference by progressively small amounts for day trading and create bigger gaps in the MA length difference for swing trading or long-term investing. Integrated alerts also enhance your efficiency while using this indicator because you can choose to be notified at the crossovers and crossunders of a pair of Moving Averages.
The technical portion of the indicator creates and plots the chosen amount or count of Moving Averages as specified in the settings tab. Then it fills each MA using the selected color and opacity. Afterward, it adapts the moving Averages to use the inputted data from the settings tab and uses it to plot them accordingly.

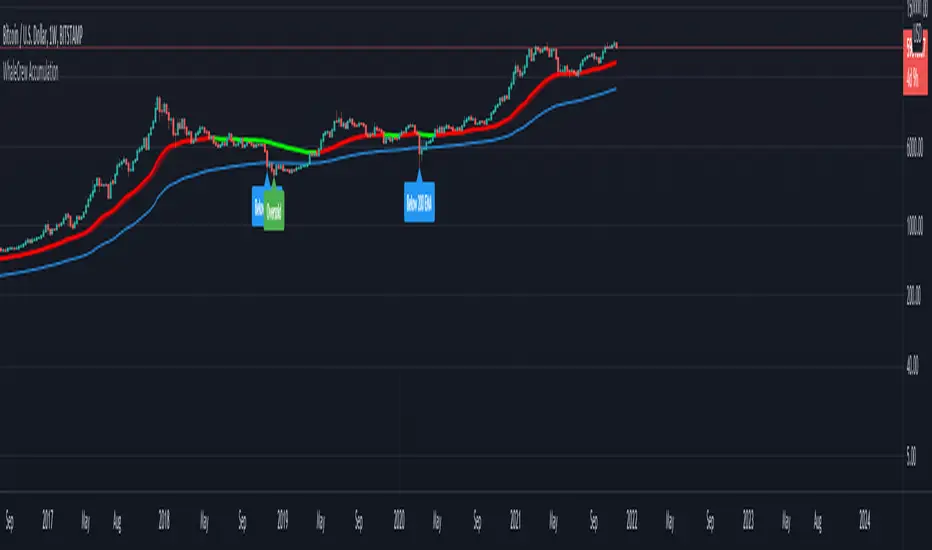
WhaleCrew AccumulationThis script was built for the BTC weekly chart.
Purpose: Accumulation of longterm (spot) holdings.
Bull Market Support-Band:
Bundle of the 20 EMA & SMA
Often acted as support during previous bullmarkets
Some people like to trade retests/breaks of this band
Accumulation-Band (+ alerts):
Green: Possible Accumulation/DCA Opportunity
Color might change while candle is still open (e.g. Weekly Candle - 19 Jul '21, flipped green -> closed red)
Labels (+ alerts):
Break of the 200 Weekly EMA
Oversold RSI (< 30)
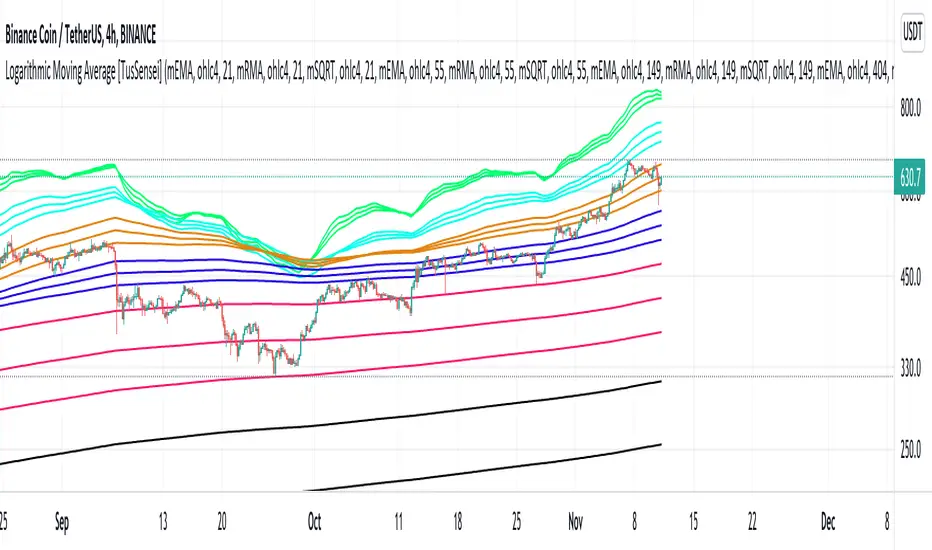
Logarithmic Moving Average [TusSensei]Logarithmic moving averages involve mathematical modification of classical moving averages(EMA-RMA-SMA). Logarithmic modified averages deviate high over short time periods. For long time periods, it behaves exactly like the original moving averages. Its basic formulation is (MovingAverage x (1 + (1 / log(length))).
The most important reason for the operability of logarithmic moving averages is the time periods they use. The values used are 21-55-149-404-1098-2981. These numbers are the consecutive powers of the number "e", which is the base of the natural logarithm (rounded up to an integer).
In this script you will also see another moving average called SQRT. This moving average is equal to the square root of the product of the EMA and the RMA. In other words, it is a moving average that is the geometric mean of two averages. In this script, you can use all of the EMA-RMA-SQRT and SMA averages in the classical and modified way. For formulaic modification, it is sufficient to select "mEMA", "mRMA" forms from the setting section.
Thanks everyone!
RSI & SMA Strategy By DenizIntroduction
It has always been a major challenge to detect the current market price in technical analysis . There are some basic but strong indicators that help us to estimate the next market action. Relative Strength Index and Simple Moving Average indicators were used in this strategy.
This strategy aims to detect the next market action with different calculations & usages of RSI and SMA indicators.
Strategy Features
As per the result of the calculation from RSI and SMA outputs the strategy will decide to go "Long" or "Short" if the directions are changed from long to short the trade will be closed and it's opening new trade as per to the new direction.
Apart from basic "take profit" and "stop" options there is an additional closing trade option named "Long/Short Bar Count". If the trade could not reach the target in a certain period, it will look for a quit with a 0 loss.
Advantages
Informative alarm messages.
High ratio of Profitable trade numbers.
Disadvantages
Less trade count.


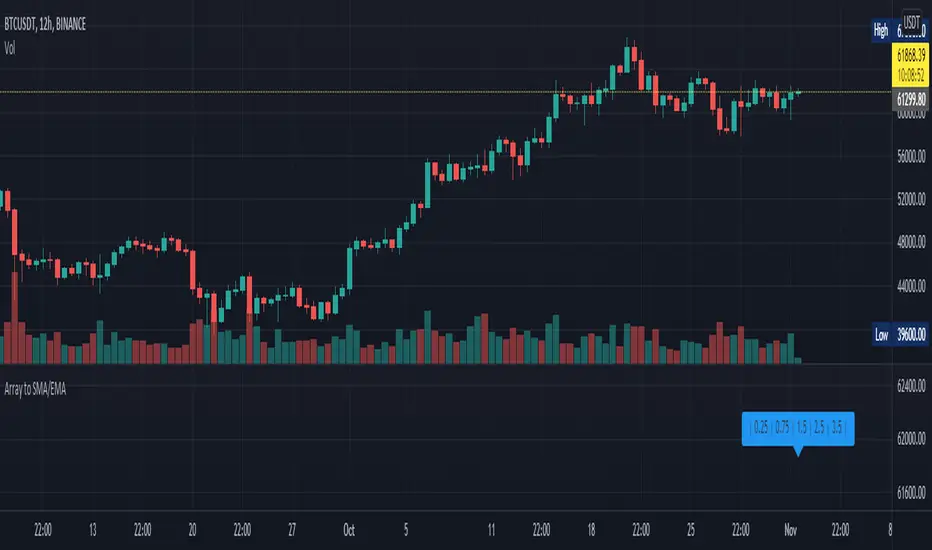
Array to SMA/EMAThis script is to help people with converting arrays to Simple Moving Average and Exponential Moving Average arrays. It is the same as using ta.sma() or ta.ema() in v5 with series but it takes an array as input instead. Both functions have inbuilt bad-input checking logic to ensure that the period length is not too high or too low - which could give unwanted results. If such values are used, the functions will output an array of the same length with NaN values. The EMA function also has an optional argument called sma_seed , which determines whether the first value in the output array will be the SMA of the first value from the input array (true) or the first value itself (false). Both functions work independently of one another, all you have to do is copy the entire function into your code and off you go! I can add more functions such as RMA or VWMA if there is demand, let me know and leave a like! ~ if you want.
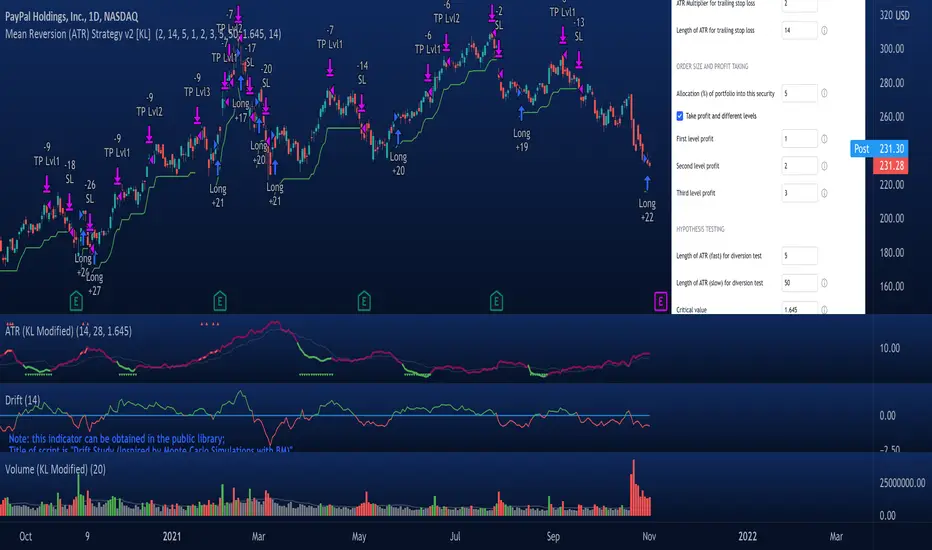
Mean Reversion Strategy v2 [KL]Description :
This strategy will enter a position when the following conditions are met:
a) Main signal: When source data (ATR) diverts from its moving average value, and
b) Confirmation: If predicted direction of trend is favorable.
Assumptions :
During periods of high price volatility, ATR diverts from its moving average value. Eventually, ATR should revert. But since just knowing the magnitude of increase/decrease of ATR does not indicate a trend signal, we need to introduce a model to predict the current trend.
In short:
• Trend Prediction : This strategy calculates the expected logarithmic return of the security (the "Drift") and considers prices to be moving in uptrend if the drift curve is upward sloping.
• Assessment of ATR diversion : To determine "yes/no" regarding whether ATR at a given point in time has diverted, this script conducts a two-tailed hypothesis test at each candlestick period. The null hypothesis (H0) is that the fast moving average value should equal the slow moving average value (say, denoted as H0: atr14 == atr28; it is assumed that atr28 is more meaningful for the purpose of describing the current trend because it has a larger sample size). Investopedia has an article summarizing this topic .
Exit Condition :
When trailing stop loss hits.
Previous version :
This strategy is based on Version 1 published back in September . This older version considers +/- one standard deviation to be the critical values relative to average ATR when testing whether ATR has diverted from the mean. This does not take Standard Error ("SE") into account. As a result, the threshold is often too wide and it generates too many entry signals.
Column XO ZoneColumn XO is an indicator in Prashant Shah's book Trading The Markets The Point & Figure Way. It counts a number of Xs and Os in every column for the length period. Both Xs and Os are calculated separately. Then, both results are divided by half the number of columns which is set by length.
I personally don't find this indicator very useful, because all it can offer is very clear in Point and Figure charts. However, it was designed to give some information on volatility as well as direction.
Good luck!
Column XOColumn XO is an indicator in Prashant Shah's book Trading The Markets The Point & Figure Way. It counts a number of Xs and Os in every column for the long period. Then, the result is divided by the number of columns which is set by length.
This indicator is designed to identify changes in volatility and works well with Wyckoff's Law of Cause and Effect. The longer the price spends in the consolidation, the more volatile and far-reaching should the expansion phase be.
Good luck!

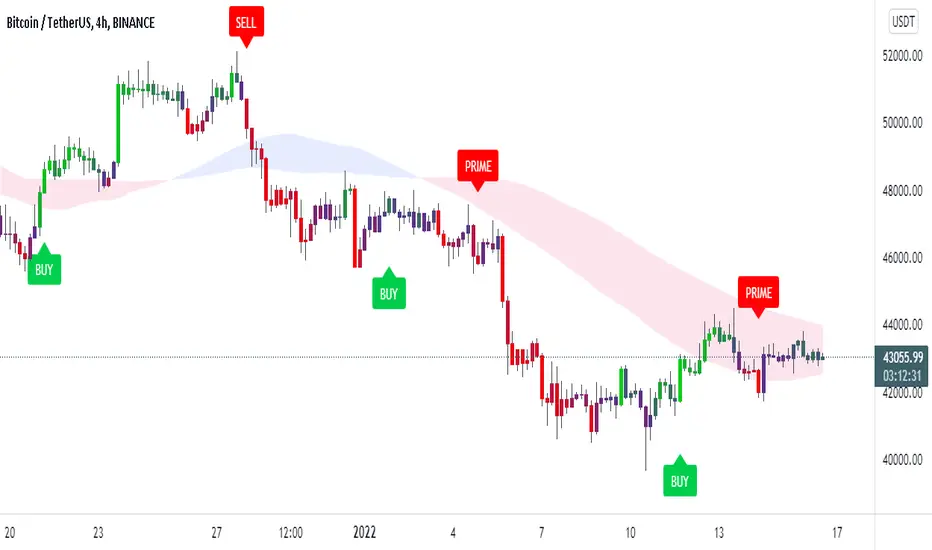
Trendorithm PrimeTrendorithm Prime is a toolkit made up of several different innovative indicators, designed by our team of developers. Get access now and create your own, unique trading strategies using our - all in one algorithm.
Our algorithm works in any market and focuses on finding the direction of the trends and remove noise from the price, for smooth understanding of the market.
Extra Confirmation
Using binomial distribution, the past values are processed to interpret the direction of trend.
After that, the signals are triggered based the volatility of the market,which is derived from the averages of candle size. All of these signals were optimised for each timeframe using timeframe multiplier.
Setting a lesser value on quotient adjusts the lookback length and volatility conditions, thus producing more number of signals that supports scalping trades. Higher the number in quotient, the frequency of trades reduce which helps the trader to hold trades for longer time.
Our Confirmation Signals helps to analyze the direction of trends for all markets and all timeframes, it boosts Trader’s confidence prior taking trades.
We made our Confirmation Signals flexible in order to suit any kind of trading style.
By adjusting the Quotient value in the settings, Traders can control the frequency of signals generated easily.
The Confirmation Signals includes a special type of signal called "Prime" which includes candle coloring to see the strength of the trend.
Our Candle-system is designed in 3 different colorings.
Green ( Bullish )
Red ( Bearish )
Purple (possible reversal or the possible formation of a new trend)
Trendo Cloud
The power of moving averages is always ultimate. This cloud made up of multiple moving averages acts as a dynamic support and resistance. The color and width of the cloud is used to find potential entry and exit points for trades.
Trend Catcher and Trend Chaser
The trend catcher is a trend-following indicator moves close to the price that aims to estimate the recent trend of price. It indicates green in uptrend and red in case of a downtrend.
The trend chaser is similar to the previous Trend Catcher, but it aims to chase long-term trends.
They are specially calculated from the highs and lows of price. Acts as a filter for confirmation signals and provides clarity for the direction of trend.
All of these functionalities tend to help users understand the market conditions as trending or ranging.
If you are using this script, you acknowledge that past performances are not indicative of future results and that there are a lot of factors required that go into being a profitable trader.
You can see the Author’s instructions below to get access to this prime indicator.