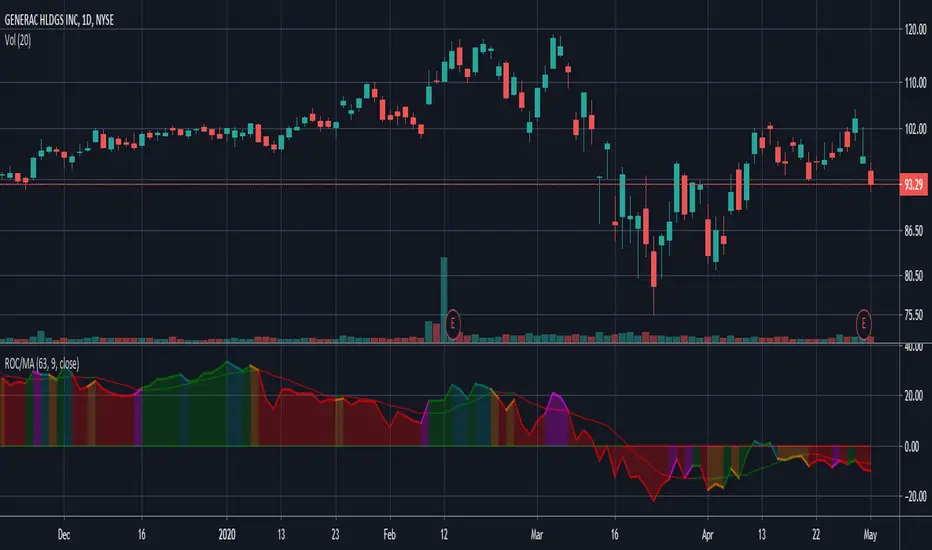
Rate of Change w/ Moving AverageThis is a small spin on the Rate of Change (ROC) indicator where I overlay a simple moving average of the indicator over the prior days.
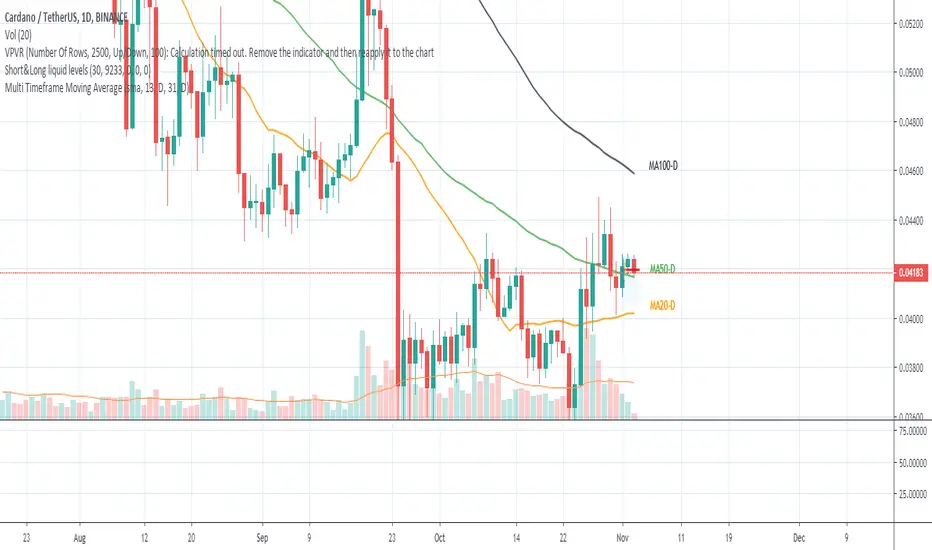
Простое скользящее среднее (SMA)
Multi Time Moving Averageпозволяет выбрать в настройках 2 таймфрейма и 4 МА с разными периодами и отображать выбранные индикаторы на графиках с любым выбранным таймфреймом
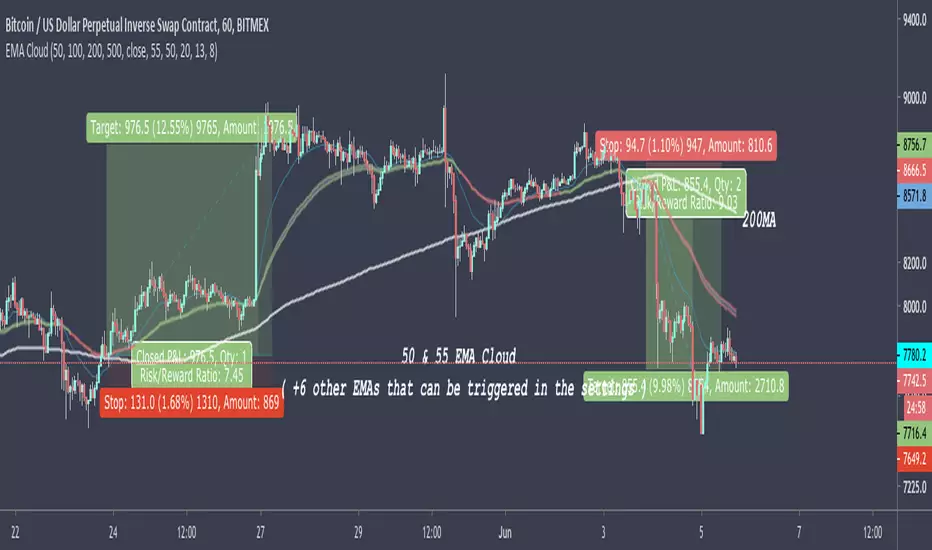
50 & 55 EMA CloudAfter testing thousands of indicators over the years, this simple EMA cloud indicator that I built is still my main weapon. It's always the first one I add to a blank charts and that is not going to change anytime soon.
I find EMAs and MAs are such underrated tools, By observing the price action surrounding these, I can see straight away if it's a good time to get into a trade or not.
As seen here, I also use the 200MA along with the 50/55EMA cloud to find extra strong support and resistances. If price starts to reject both the cloud and the 200MA at the same time/level, then it's a very good indication the price is going to make a big move in that direction as seen here in this chart.
cbci cu//@version=3
// Constance Brown Composite Index
// Re-implementation of CBCI based upon LazyBear's version + source text
// References:
//
// original author: @LazyBear
// "Technical Analysis for Trading Professionals" by Constance Brown, pg. 369

rsi sma/ema cuCustom RSI with SMA 9, EMA 45 and Bull/Bear Control Zones from Krown and Constance Brown.

10/20 MA Cross-Over with Heikin-Ashi Signals by SchobbejakThe 10/20 MA Heikin-Ashi Strategy is the best I know. It's easy, it's elegant, it's effective.
It's particularly effective in markets that trend on the daily. You may lose some money when markets are choppy, but your loss will be more than compensated when you're aboard during the big moves at the beginning of a trend or after retraces. There's that, and you nearly eliminate the risk of losing your profit in the long run.
The results are good throughout most assets, and at their best when an asset is making new all-time highs.
It uses two simple moving averages: the 10 MA (blue), and the 20 MA (red), together with heikin-ashi candles. Now here's the great thing. This script does not change your regular candles into heikin-ashi ones, which would have been annoying; instead, it subtly prints either a blue dot or a red square around your normal candles, indicating a heikin-ashi change from red to green, or from green to red, respectively. This way, you get both regular and heikin ashi "candles" on your chart.
Here's how to use it.
Go LONG in case of ALL of the below:
1) A blue dot appeared under the last daily candle (meaning the heikin-ashi is now "green").
2) The blue MA-line is above the red MA-line.
3) Price has recently breached the blue MA-line upwards, and is now above.
COVER when one or more of the above is no longer the case. This is very important. You want to keep your profit.
Go SHORT in case of ALL of the below:
1) A red square appeared above the last daily candle (meaning the heikin-ashi is now "red").
2) The red MA-line is above the blue MA-line.
3) Price has recently breached the blue MA-line downwards, and is now below.
Again, COVER when one or more of the above is no longer the case. This is what gives you your edge.
It's that easy.
Now, why did I make the signal blue, and not green? Because blue looks much better with red than green does. It's my firm believe one does not become rich using ugly charts.
Good luck trading.
--You may tip me using bitcoin: bc1q9pc95v4kxh6rdxl737jg0j02dcxu23n5z78hq9 . Much appreciated!--

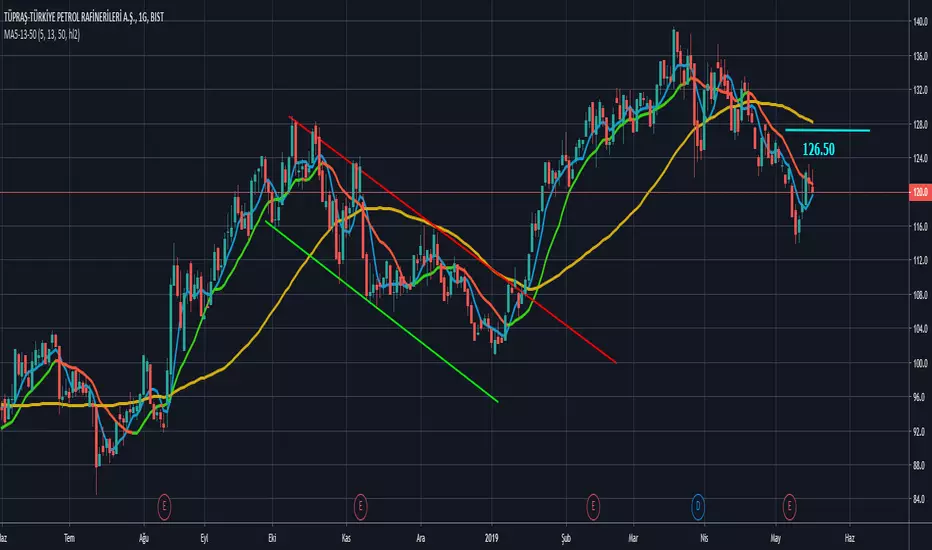
MA5-13-50 by biruvyatirimciUmit Uslucan'ın MA5-13-50 stratejisine göre hareketli ortalamaları çiziyor, MA13 değeri yükselişte ise yeşil inişte ise pembe çiziyor.
* biruvyatirimci
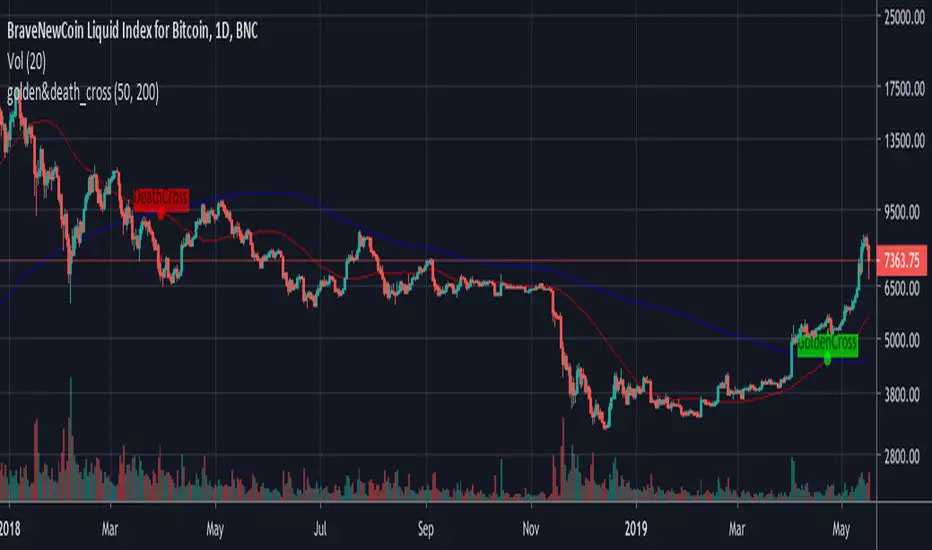
GoldenCross & DeathCrossBNC:BLX
Its a simple Golden- and Death-Cross Indicator BNC:BLX
... it highlights the Crosses and labels them. It also highlights the bar where the cross happend.
Enjoy and buy me a coffee if you liked it.
ETH: 0x4F27c7eC42b898E0B79fA9a35dC9b585e4c56579

Multiple Moving AveragesMade to plot 2 DASHED EMAs and 2 SOLID SMAs with custom period so you don't have to use more than 1 indicator for your MAs.
BB Forecast PrototypeExperiment to try apply @atrader2's MA Forecast () to bollinger bands - didn't exactly work out how I expected it to, especially with the Upper/Lower forecast projections.


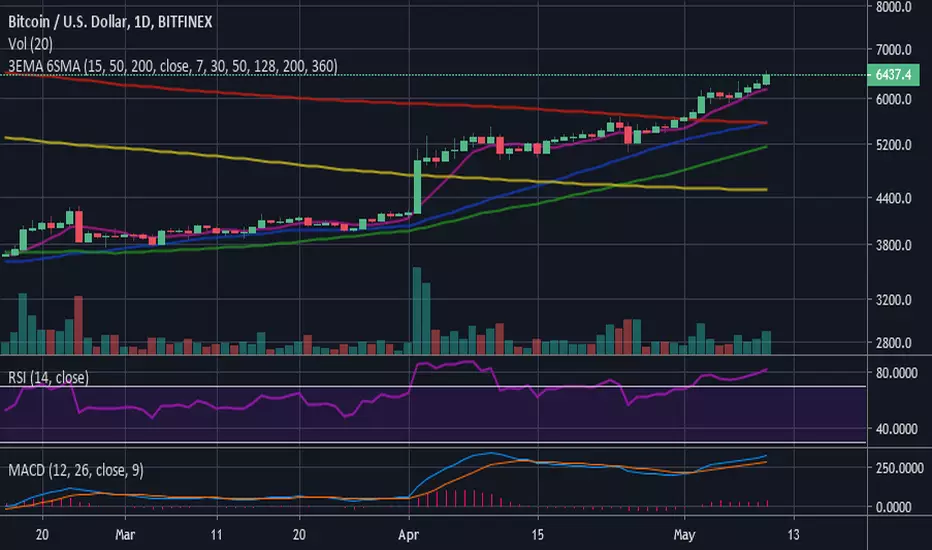
3 EMA (15-50-200) - 6 SMA (7-30-50-128-200-360)3 Moving Average Exponential - 6 Simple Moving Average . Crypto EMA - MA . 7 is a fast support or resistance, 15 confirmation support or resistance. 30 Important support and resistance . 50 institutional support or resistance. 200 institutional general trend, support and resistance , 360 general trend, support and resistance . The use of EMA or MA is according to your liking/trading plan

QSMA - 8 Simple Moving Averages (20, 50 - 400) / CryptoprospaModified others script to make SMA in this range.
By adding this one indicator to your chart, you save time and overcome the limits or restrictions to how many indicators you can add to your chart.
You can also modify the colour and\or width to your liking.
Enjoy.
Regards Cryptoprospa.

QMA/SMA DifferenceIntroduction
The quadratic moving average (QMA) or quadratic weighted moving average (QWMA) is a type of moving average who is closer to the price when price is up trending. This moving average is defined as the square root of the moving average of the squared price. The QMA-SMA difference use this moving average to provide a new volatility indicator who aim to be reactive and filter noisy volatility in order to only provide essential information.
QMA - SMA
This indicator is defined as the difference between a quadratic moving average and a simple moving average of same period. Since the QMA emphasize up movements and tend to be away from down movements she is always greater than the simple moving average, so a simple difference between those moving average provide our volatility indicator. Below is a comparison with a standard deviation and the indicator of both period 100.
Since its a difference between two moving average it can be interesting to use a simple moving as source for the standard deviation to provide another comparison
The standard deviation is smoother but still contain more information as well as having less reactivity.
Conclusion
I have a presented a new volatility indicator based on the quadratic moving average and compared it with a classic standard deviation. It is possible to change the power order of the QMA in order to provide different results, in order to do so you must also change the root, this is done in pine with : pow(sma(pow(close,w),length),1/w) where w is the power order, notice that an high power order can provide non attributed values.

Moving Average Trend IndicatorThis Indicator shows you the major moving averages, both in simple and exponential.


SuperMega Static/Dynamic EMA & SMA MultiComboAll the moving averages you'll ever need!!!
5 EMAs
5 SMAs
3 static EMAs
3 static SMAs
Static EMAs and SMAs are shown on every timeframe. For example, you can set static EMAs or SMAs to show 21 day, 50 week and 200 week on every timeframe of the chart. Plus standard 5 EMAs and 5 SMAs (user-defined) is showing for that specific timeframe.


Moving Average x10 (SMA, EMA)10 configurable Simple and Exponential moving averages combined in one indicator
