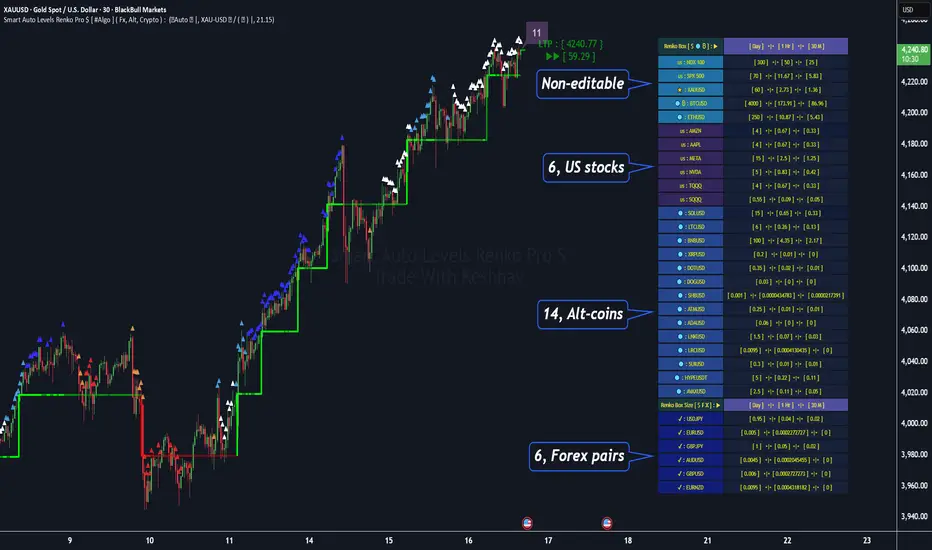
Smart Auto Levels Renko Pro $ [ #Algo ] ( Fx, Alt, Crypto ) : Smart Levels is Smart Trades 🏆
"Smart Auto Levels Renko Pro $ ( Fx, Alt, Crypto ) " indicator is specially designed for " Crypto, Altcoins, Forex pairs, and US exchange" . It gives more power to day traders, pull-back / reverse trend traders / scalpers & trend analysts. This indicator plots the key smart levels , which will be automatically drawn at the session's start or during the session, if specific input is selected.
🔶 Usage and Settings :
A :
⇓ ( *refer 📷 image ) ⇓
B :
⇓ ( *refer 📷 images ) ⇓
🔷 Features :
a : automated smart levels with #algo compatibility.
b : plots Trend strength ▲, and current candle strength count value label.
c : ▄▀ RENKO Emulator engine ( plots *Non-repaintable #renko data as a line chart over the standard chart).
d : session 1st candle's High, Low & 50% levels ( irrespective of chart time-frame ).
e : 1-hour High & Low levels of specific candle ( from the drop-down menu ), for any global
market crypto / altcoins / forex or USA exchange symbols.
f : previous Day / Week / Month, chart High & Low.
g : pivot point levels of the Daily, Weekly & Monthly charts.
h : 2 class types of ⏰ alerts ( only signals or #algo execution ).
i : auto RENKO box size (ATR-based) table for 31 symbols (5 Default non-editable symbols,
6 US exchange symbols, 14 Alt-coins, 6 Forex pairs.)
j : auto processes " daylight saving time 🌓" data and plots accordingly.
💠Note: "For key smart levels, it processes data from a customized time frame, which is not available for the *free Trading View subscription users , and requires a premium plan." By this indicator, you have an edge over the paid subscription plan users and can automatically plot the Non-repaintable RENKO emulator for the current chart on the Trading View free Plan for any time-frame ."
⬇ Take a deep dive 👁️🗨️ into the Smart levels trading Basic Demonstration ⬇
▄▀ 1: "RENKO Emulator Engine" ⭐ , plots a noiseless chart for easy Top/Bottom set-up analysis. 11 types of 💼 asset classes options available in the drop-down menu.
LTP is tagged to the current RSI value ➕ volatility color change for instant quick decisions.
⇓ ( *refer 📷 image ) ⇓
🟣 2: "Trend Strength ▲ Label with color condition.
The strength of the trend will be shown as a number label ( for the current candle ), and the ▲ color format represents the strength of the trend. Can be utilized as an Entry or Exit condition.
⇓ ( *refer 📷 image ) ⇓
🟠 3: plots "Session first candle High, low, and 50%" levels ( irrespective of chart time-frame ), which are critical levels for an intraday trader with add-on levels of Previous Day, Week & Month High and Low levels.
⇓ ( *refer 📷 image ) ⇓
🔵 4: plots "Hourly chart candle" High & Low levels for the specific candles, selected from the drop-down menu with Pivot Points levels of Daily, Weekly, Monthly chart.
⇓ ( *refer 📷 image ) ⇓
🔲 5: "Auto RENKO box size" ( ATR based ) : This indicator is specially designed for 'Renko' trading enthusiasts, where the Box size of the ' Renko chart ' for intraday or swing trading ( ATR based ) , automatically calculated for the selected ( editable ) symbols in the table.
⇓ ( *refer 📷 image ) ⇓
*NOTE :
Table symbols (Non-editable) for 2 USA index, XAU, BTC, ETH.
Symbols (editable) for USA index/stocks.
Table Symbols (editable) for alt-coins.
Table Symbols (editable) for Forex pairs.
⏰ 6: "Alert functions."
⇓ ( *refer 📷 image ) ⇓
◻ : Total 7 signal alerts can be possible in a Single alert.
◻ : Total 10 #algo alerts , ( must ✔ tick the Consent check box for algo execution ).
Note: : alert with RSI ( *manual ✍ input value ) condition.
After selecting alert/alerts ( signals 7 / #algo 10 ), an additional RSI condition can also be used as an input to trigger the alert.
ex: alert = { 🟠 𝟭 Hr 🕯 H & L ➕ ✅ RSI✍ } condition, will trigger the alert when both conditions meet simultaneously.
This Indicator will work like a Trading System . It is different from other indicators, which give Signals only. This script is designed to be tailored to your personal trading style by combining user input components to create your own comprehensive strategy . The synergy between the components is key to its usefulness.
🚀 It focuses on the key Smart Levels and gives you an Extra edge over others.
✅ HOW TO GET ACCESS :
You can see the Author's instructions below to get instant access to this indicator & our premium indicator suites. If you like any of my Invite-Only indicators, kindly DM and let me know!
⚠ RISK DISCLAIMER :
All content provided by "@TradeWithKeshhav" is for informational & educational purposes only.
It does not constitute any financial advice or a solicitation to buy or sell any securities of any type. All investments / trading involve risks. Past performance does not guarantee future results / returns.
Regards :
Team @TradeWithKeshhav
Happy trading and investing!
Smartmoneyconcept
SMC Structures and Multi-Timeframe FVG PYSMC Structures and Multi-Timeframe FVG Indicator
Tip: For optimal performance, adjust the number of FVGs displayed per timeframe in the settings. On high-performance devices, up to 8 FVGs per timeframe can be used without issues. If you experience slowdowns, reduce to 3 or 4 FVGs per timeframe. If the chart flashes, disable indicators one by one to identify conflicts, or try using the TradingView Mobile or Windows App for a smoother experience.
Overview
This Pine Script indicator enhances market analysis by integrating Smart Money Concepts (SMC) with Fair Value Gaps (FVG) across multiple timeframes. It identifies trend continuations (Break of Structure, BOS) and trend reversals (Change of Character, CHoCH) while highlighting liquidity zones through FVG detection. The indicator includes eight customizable Moving Average (MA) curve templates, disabled by default, to complement SMC and FVG analysis. Its originality lies in combining multi-timeframe FVG detection with SMC structure analysis, providing traders with a cohesive tool to visualize price action patterns and liquidity zones efficiently.
Features and Functionality
1. Fair Value Gaps (FVG)
The indicator detects and displays bullish, bearish, and mitigated FVGs, representing liquidity zones where price inefficiencies occur. These gaps are dynamically updated based on price action:
Bullish FVG: Displayed in green when unmitigated, indicating potential upward liquidity zones.
Bearish FVG: Displayed in red when unmitigated, signaling potential downward liquidity zones.
Mitigated FVG: Shown in gray once the gap is partially filled by price action.
Fully Mitigated FVG: Automatically removed from the chart when the gap is fully filled, reducing visual clutter.
Users can customize the number of historical FVGs displayed via the settings, allowing focus on recent liquidity zones for targeted analysis.
2. SMC Structures
The indicator identifies key SMC price action patterns:
Break of Structure (BOS): Marked with gray lines, indicating trend continuation when price breaks a significant high or low.
Change of Character (CHoCH): Highlighted with yellow lines, signaling potential trend reversals when price fails to maintain the current structure.
High/Low Values: Blue lines denote the highest high and lowest low of the current structure, providing reference points for market context.
3. Multi-Timeframe FVG Analysis
A standout feature is the ability to analyze FVGs across multiple timeframes simultaneously. This allows traders to align higher-timeframe liquidity zones with lower-timeframe entries, improving trade precision. The indicator fetches FVG data from user-selected timeframes, displaying them cohesively on the chart.
4. Moving Average (MA) Templates
The indicator includes eight customizable MA curve templates in the Settings > Template section, disabled by default. These templates allow users to overlay MAs (e.g., SMA, EMA, WMA) to complement SMC and FVG analysis. Each template is pre-configured with different periods and types, enabling quick adaptation to various trading strategies, such as trend confirmation or dynamic support/resistance.
How It Works
The script processes price action to detect FVGs by analyzing three-candle patterns where a gap forms between the high/low of the first and third candles. Multi-timeframe data is retrieved using Pine Script’s request.security() function, ensuring accurate FVG plotting across user-defined timeframes. BOS and CHoCH are identified by tracking swing highs and lows, with logic to differentiate trend continuation from reversals. The MA templates are computed using standard Pine Script TA functions, with user inputs controlling visibility and parameters.
How to Use
Add to Chart: Apply the indicator to any TradingView chart.
Configure Settings:
FVG Settings: Adjust the number of historical FVGs to display (default: 10). Enable/disable specific FVG types (bullish, bearish, mitigated).
Timeframe Selection: Choose up to three timeframes for FVG analysis (e.g., 1H, 4H, 1D) to align with your trading strategy.
Structure Settings: Toggle BOS (gray lines) and CHoCH (yellow lines) visibility. Adjust sensitivity for structure detection if needed.
MA Templates: Enable MA curves via the Template section. Select from eight pre-configured MA types and periods to suit your analysis.
Interpret Signals:
Use green/red FVGs for potential entry points targeting liquidity zones.
Monitor gray lines (BOS) for trend continuation and yellow lines (CHoCH) for reversal signals.
Align multi-timeframe FVGs with BOS/CHoCH for high-probability setups.
Optionally, use MA curves for trend confirmation or dynamic levels.
Clean Chart Usage: The indicator is designed to work standalone. Ensure no conflicting scripts are applied unless explicitly needed for your strategy.
Why This Indicator Is Unique
Unlike standalone FVG or SMC indicators, this script combines both concepts with multi-timeframe analysis, offering a comprehensive view of market structure and liquidity. The addition of customizable MA templates enhances flexibility, while the dynamic removal of mitigated FVGs keeps the chart clean. This mashup is purposeful, as it integrates complementary tools to streamline decision-making for traders using SMC strategies.
Credits
This indicator builds on foundational SMC and FVG concepts from the TradingView community. Some open-source code was reused, and do performance enhancement as you guys can read the code. This type of indicators has inspiration was drawn from public domain SMC methodologies. All code is partly original with manual work on performance optimization in Pine Script.
Notes
Ensure your chart is clean (no unnecessary drawings or indicators) to maximize clarity.
The indicator is open-source, and traders are encouraged to review the code for deeper understanding.
For optimal use, test the indicator on a demo account to familiarize yourself with its signals.

3-6-9 Times v3.2 (rdt)3-6-9 Times v3.1 Indicator Overview
Core Concept
This indicator identifies specific times/dates where the digital root (sum of digits reduced to a single number) equals 3, 6, or 9, which are considered significant in numerology and certain trading methodologies.
How It Calculates Roots:
For Intraday Timeframes (minutes, hours):
Formula: Hour + First Minute Digit + Last Minute Digit → Reduce to single digit
For Daily/Weekly/Monthly Timeframes:
Uses Month + Day calculations with similar digit reduction logic.
Key Features:
1. Break Filter (Default: ON)
Only displays labels after a swing high/low is broken
Prevents clutter by filtering out times that don't coincide with price action
Configurable pivot length (default: 2 bars)
Optional directional filter: green candles must break highs, red candles must break lows
2. Root Selection
Toggle individual roots (3, 6, or 9) on/off
Each root has customizable color
Default colors: Blue (3), Green (6), Red (9)
3. Display Options
Marking Style: Labels, Vertical Lines, or Both
Label Text Format:
Root Only (default) - shows just "3", "6", or "9"
Time/Date Only - shows the actual time/date
Root + Time/Date (separate lines) - shows both
Label Background: Toggle colored box behind text (default: OFF)
Chart Background: Toggle colored background highlight (default: OFF)
Text Color: Customizable (default: black)
4. Session Filter:
Set specific hours/minutes for when to display signals
Default: 00:00 to 23:59 (all day)
Useful for focusing on specific trading sessions
5. Hour Offset
Manual adjustment for timezone/DST issues
Range: -12 to +12 hours
Helps align calculations with your preferred timezone
6. Label Placement
Green candles: Label appears above the bar
Red candles: Label appears below the bar
7. Alerts
Four alert conditions available:
Any 3-6-9 root hit
Specific Root 3 hit
Specific Root 6 hit
Specific Root 9 hit
Typical Use Case
Traders use this to identify potential reversal or continuation points when:
A 3/6/9 time occurs
Price breaks a recent swing high/low
Combining this timing signal with other technical analysis
The indicator helps identify "energetic" time windows that may correlate with increased volatility or directional moves.
ICT Daily Levels & Liquidity Zones [HatefBW]ICT Daily Levels & Liquidity Zones
This indicator automatically detects and plots the daily high and low levels for the current day and the two previous days.
Each level dynamically tracks the exact candle that created it, allowing traders to identify where short-term liquidity pools form across multiple timeframes.
What makes this tool unique:
• Three-day structure: Displays current, previous, and 2-day-old highs/lows for contextual price action.
• Dynamic mapping: On lower timeframes, each level aligns precisely with the candle that created the daily high or low.
• Full customization: Traders can toggle each day’s levels, colors, label size, and extension behavior independently.
• Adaptive logic: Lines automatically extend or stay fixed depending on the chosen setting, avoiding chart clutter.
This tool helps ICT traders and smart money practitioners visualize daily liquidity zones — potential areas of stop hunts or institutional targeting.
The script is originally coded by @HatefBW from scratch, with no reused or modified open-source code

FVG +Displcement/ATR/3thClosedBody [hatefbw]Overview
This indicator is a modified version of the LuxAlgo group’s FVG indicator. It now includes three advanced optional filters that help traders identify only the strongest and most reliable Fair Value Gaps (FVGs), aligned with Smart Money Concepts (SMC) and ICT methodology.
How it works
We’ve added the following new configurable options to the indicator:
✅ Confirm Third Closed Body
When enabled, ensures the third candle (right after the gap) closes beyond the wick of the second candle.
✔️ Adds extra validation to price direction and filters out weaker FVGs.
✅ Confirm Displacement Candle
Validates that the second candle (the one forming the FVG) is a strong displacement candle. This condition checks for:
📏 Large body relative to total range (customizable %, default: 70%)
📈 High volume above 20-period moving average
🔺 Break of Structure (BOS) in the direction of the FVG
Bullish FVG: breaks above recent highs
Bearish FVG: breaks below recent lows
✅ ATR-Based Validation (optional)
Adds an additional filter where the second candle’s body or range must exceed the ATR (default: ATR 14, configurable).
✔️ Further confirms that the displacement candle has significant market movement.
Usage
All features are 100% optional and can be toggled in the settings.
Use them to filter out weak FVGs and align trades with institutional-grade setups.

Quarterly Theory [@kaleboraciy]🧠 Daye Quarterly Theory is based on the idea that markets often move in repeating cycles. Each part of the cycle reflects a stage of the market
Consolidation
Manipulation
Distribution
Reversal/Continuation
This is a classic AMD-X pattern, which is widely used in SMC & ICT concepts. By spotting these phases, traders can better understand where the market might be heading next.
⭐ An important feature of this indicator is the Fibonacci levels, which are calculated in a clever way on the Q1 part of each cycle. You can use this levels for precise entries on manipulation in Q2
📖 Now I want to give brief description of each cycle:
Daily Cycle - the day can be broken down into 6 hour quarters
Q1 - 18:00 - 00:00 Asia.
Q2 - 00:00 - 06:00 London (True Open).
Q3 - 06:00 - 12:00 NY AM.
Q4 - 12:00 - 18:00 NY PM.
Pro tips:
Q2 often lines up with the session’s True Open - a key reference for directional bias.
Q3 tends to show the most directional momentum during the trading day.
Q4 is a critical zone for judging whether the day will extend the move or retrace.
Weekly Cycle - Daye determined that although the trading week is composed of 5 trading days, we should ignore Friday, and the small portion of Sunday’s price action:
Q1 - Monday
Q2 - Tuesday (True Open, Daily Candle Open Price).
Q3 - Wednesday.
Q4 - Thursday.
Pro tips:
Wednesday (Q3) often provides the week’s strongest directional movement - many trades target this zone.
Tuesday’s manipulation (Q2) may shake out weak positions or set up the directional swing - be careful
Thursday (Q4) helps confirm whether the weekly trend continues or reverses.
Monthly Cycle - considering that we have four weeks in a month, we start the cycle on the first Monday of the month (regardless of the calendar Day):
Q1 - Week 1: first Monday of the month.
Q2 - Week 2: second Monday of the month (True Open, Daily Candle Open Price).
Q3 - Week 3: third Monday of the month.
Q4 - Week 4: fourth Monday of the month.
I hope, that this awesome tool will boost your trading 💰

ICT Venom Trading Model [TradingFinder] SMC NY Session 2025SetupIntroduction
The ICT Venom Model is one of the most advanced strategies in the ICT framework, designed for intraday trading on major US indices such as US100, US30, and US500. This model is rooted in liquidity theory, time and price dynamics, and institutional order flow.
The Venom Model focuses on detecting Liquidity Sweeps, identifying Fair Value Gaps (FVG), and analyzing Market Structure Shifts (MSS). By combining these ICT core concepts, traders can filter false breakouts, capture sharp reversals, and align their entries with the real institutional liquidity flow during the New York Session.
Key Highlights of ICT Venom Model :
Intraday focus : Optimized for US indices (US100, US30, US500).
Time element : Critical window is 08:00–09:30 AM (Venom Box).
Liquidity sweep logic : Price grabs liquidity at 09:30 AM open.
Confirmation tools : MSS, CISD, FVG, and Order Blocks.
Dual setups : Works in both Bullish Venom and Bearish Venom conditions.
At its core, the ICT Venom Strategy is a framework that explains how institutional players manipulate liquidity pools by engineering false breakouts around the initial range of the market. Between 08:00 and 09:30 AM New York time, a range called the “Venom Box” is formed.
This range acts as a trap for retail traders, and once the 09:30 AM market open occurs, price usually sweeps either the high or the low of this box to collect stop-loss liquidity. After this liquidity grab, the market often reverses sharply, giving birth to a classic Bullish Venom Setup or Bearish Venom Setup
The Venom Model (ICT Venom Trading Strategy) is not just a pattern recognition tool but a precise institutional trading model based on time, liquidity, and market structure. By understanding the Initial Balance Range, watching for Liquidity Sweeps, and entering trades from FVG zones or Order Blocks, traders can anticipate market reversals with high accuracy. This strategy is widely respected among ICT followers because it offers both risk management discipline and clear entry/exit conditions. In short, the Venom Model transforms liquidity manipulation into actionable trading opportunities.
Bullish Setup :
Bearish Setup :
🔵 How to Use
The ICT Venom Model is applied by observing price behavior during the early hours of the New York session. The first step is to define the Initial Range, also called the Venom Box, which is formed between 08:00 and 09:30 AM EST. This range marks the high and low points where institutional traders often create traps for retail participants. Once the official market opens at 09:30 AM, price usually sweeps either the top or bottom of this box to collect liquidity.
After this liquidity grab, the market tends to reverse in alignment with the true directional bias. To confirm the setup, traders look for signals such as a Market Structure Shift (MSS), Change in State of Delivery (CISD), or the appearance of a Fair Value Gap (FVG). These elements validate the reversal and provide precise levels for trade execution.
🟣 Bullish Setup
In a Bullish Venom Setup, the market first sweeps the low of the Venom Box after 09:30 AM, triggering sell-side liquidity collection. This downward move is often sharp and deceptive, designed to stop out retail long positions and attract new sellers. Once liquidity is taken, the market typically shifts direction, forming an MSS or CISD that signals a reversal to the upside.
Traders then wait for price to retrace into a Fair Value Gap or a demand-side Order Block created during the reversal leg. This retracement offers the ideal entry point for long positions. Stop-loss placement should be just below the liquidity sweep low, while profit targets are set at the Venom Box high and, if momentum continues, at higher session or daily highs.
🟣 Bearish Setup
In a Bearish Venom Setup, the process is similar but reversed. After the Initial Range is defined, if price breaks above the Venom Box high following the 09:30 AM open, it signals a false breakout designed to collect buy-side liquidity. This move usually traps eager buyers and clears out stop-losses above the high.
After the liquidity sweep, confirmation comes through an MSS or CISD pointing to a reversal downward. At this stage, traders anticipate a retracement into a Fair Value Gap or a supply-side Order Block formed during the reversal. Short entries are taken within this zone, with stop-loss positioned just above the liquidity sweep high. The logical profit targets include the Venom Box low and, in stronger bearish momentum, deeper session or daily lows.
🔵 Settings
Refine Order Block : Enables finer adjustments to Order Block levels for more accurate price responses.
Mitigation Level OB : Allows users to set specific reaction points within an Order Block, including: Proximal: Closest level to the current price. 50% OB: Midpoint of the Order Block. Distal: Farthest level from the current price.
FVG Filter : The Judas Swing indicator includes a filter for Fair Value Gap (FVG), allowing different filtering based on FVG width: FVG Filter Type: Can be set to "Very Aggressive," "Aggressive," "Defensive," or "Very Defensive." Higher defensiveness narrows the FVG width, focusing on narrower gaps.
Mitigation Level FVG : Like the Order Block, you can set price reaction levels for FVG with options such as Proximal, 50% OB, and Distal.
CISD : The Bar Back Check option enables traders to specify the number of past candles checked for identifying the CISD Level, enhancing CISD Level accuracy on the chart.
🔵 Conclusion
The ICT Venom Model is more than just a reversal setup; it is a complete intraday trading framework that blends liquidity theory, time precision, and market structure analysis. By focusing on the Initial Range between 08:00 and 09:30 AM New York time and observing how price reacts at the 09:30 AM open, traders can identify liquidity sweeps that reveal institutional intentions.
Whether in a Bullish Venom Setup or a Bearish Venom Setup, the model allows for precise entries through Fair Value Gaps (FVGs) and Order Blocks, while maintaining clear risk management with well-defined stop-loss and target levels.
Ultimately, the ICT Venom Model provides traders with a structured way to filter false moves and align their trades with institutional order flow. Its strength lies in transforming liquidity manipulation into actionable opportunities, giving intraday traders an edge in timing, accuracy, and consistency. For those who master its logic, the Venom Model becomes not only a strategy for entry and exit, but also a deeper framework for understanding how liquidity truly drives price in the New York session.

Order Block Volumatic FVG StrategyInspired by: Volumatic Fair Value Gaps —
License: CC BY-NC-SA 4.0 (Creative Commons Attribution–NonCommercial–ShareAlike).
This script is a non-commercial derivative work that credits the original author and keeps the same license.
What this strategy does
This turns BigBeluga’s visual FVG concept into an entry/exit strategy. It scans bullish and bearish FVG boxes, measures how deep price has mitigated into a box (as a percentage), and opens a long/short when your mitigation threshold and filters are satisfied. Risk is managed with a fixed Stop Loss % and a Trailing Stop that activates only after a user-defined profit trigger.
Additions vs. the original indicator
✅ Strategy entries based on % mitigation into FVGs (long/short).
✅ Lower-TF volume split using upticks/downticks; fallback if LTF data is missing (distributes prior bar volume by close’s position in its H–L range) to avoid NaN/0.
✅ Per-FVG total volume filter (min/max) so you can skip weak boxes.
✅ Age filter (min bars since the FVG was created) to avoid fresh/immature boxes.
✅ Bull% / Bear% share filter (the 46%/53% numbers you see inside each FVG).
✅ Optional candle confirmation and cooldown between trades.
✅ Risk management: fixed SL % + Trailing Stop with a profit trigger (doesn’t trail until your trigger is reached).
✅ Pine v6 safety: no unsupported args, no indexof/clamp/when, reverse-index deletes, guards against zero/NaN.
How a trade is decided (logic overview)
Detect FVGs (same rules as the original visual logic).
For each FVG currently intersected by the bar, compute:
Mitigation % (how deep price has entered the box).
Bull%/Bear% split (internal volume share).
Total volume (printed on the box) from LTF aggregation or fallback.
Age (bars) since the box was created.
Apply your filters:
Mitigation ≥ Long/Short threshold.
Volume between your min and max (if enabled).
Age ≥ min bars (if enabled).
Bull% / Bear% within your limits (if enabled).
(Optional) the current candle must be in trade direction (confirm).
If multiple FVGs qualify on the same bar, the strategy uses the most recent one.
Enter long/short (no pyramiding).
Exit with:
Fixed Stop Loss %, and
Trailing Stop that only starts after price reaches your profit trigger %.
Input settings (quick guide)
Mitigation source: close or high/low. Use high/low for intrabar touches; close is stricter.
Mitigation % thresholds: minimal mitigation for Long and Short.
TOTAL Volume filter: skip FVGs with too little/too much total volume (per box).
Bull/Bear share filter: require, e.g., Long only if Bull% ≥ 50; avoid Short when Bull% is high (Short Bull% max).
Age filter (bars): e.g., ≥ 20–30 bars to avoid fresh boxes.
Confirm candle: require candle direction to match the trade.
Cooldown (bars): minimum bars between entries.
Risk:
Stop Loss % (fixed from entry price).
Activate trailing at +% profit (the trigger).
Trailing distance % (the trailing gap once active).
Lower-TF aggregation:
Auto: TF/Divisor → picks 1/3/5m automatically.
Fixed: choose 1/3/5/15m explicitly.
If LTF can’t be fetched, fallback allocates prior bar’s volume by its close position in the bar’s H–L.
Suggested starting presets (you should optimize per market)
Mitigation: 60–80% for both Long/Short.
Bull/Bear share:
Long: Bull% ≥ 50–70, Bear% ≤ 100.
Short: Bull% ≤ 60 (avoid shorting into strong support), Bear% ≥ 0–70 as you prefer.
Age: ≥ 20–30 bars.
Volume: pick a min that filters noise for your symbol/timeframe.
Risk: SL 4–6%, trailing trigger 1–2%, distance 1–2% (crypto example).
Set slippage/fees in Strategy Properties.
Notes, limitations & best practices
Data differences: The LTF split uses request.security_lower_tf. If the exchange/data feed has sparse LTF data, the fallback kicks in (it’s deliberate to avoid NaNs but is a heuristic).
Real-time vs backtest: The current bar can update until close; results on historical bars use closed data. Use “Bar Replay” to understand intrabar effects.
No pyramiding: Only one position at a time. Modify pyramiding in the header if you need scaling.
Assets: For spot/crypto, TradingView “volume” is exchange volume; in some markets it may be tick volume—interpret filters accordingly.
Risk disclosure: Past performance ≠ future results. Use appropriate position sizing and risk controls; this is not financial advice.
Credits
Visual FVG concept and original implementation: BigBeluga.
This derivative strategy adds entry/exit logic, volume/age/share filters, robust LTF handling, and risk management while preserving the original spirit.
License remains CC BY-NC-SA 4.0 (non-commercial, attribution required, share-alike).

Inversion Fair Value Gap Signals [AlgoAlpha]🟠 OVERVIEW
This script is a custom signal tool called Inversion Fair Value Gap Signals (IFVG) , designed to detect, track, and visualize fair value gaps (FVGs) and their inversions directly on price charts. It identifies bullish and bearish imbalances, monitors when these zones are mitigated or rejected, and extends them until resolution or expiration. What makes this script original is the inclusion of inversion logic—when a gap is filled, the area flips into an opposite "inversion fair value gap," creating potential reversal or continuation zones that give traders additional context beyond classic FVG analysis.
🟠 CONCEPTS
The script builds on the Smart Money Concepts (SMC) principle of fair value gaps, where inefficiencies form when price moves too quickly in one direction. Detection requires a three-bar sequence: a strong up or down move that leaves untraded price between bar highs and lows. To refine reliability, the script adds an ATR-based size filter and prevents overlap between zones. Once created, gaps are tracked in arrays until mitigation (price closing back into the gap), expiration, or transformation into an inversion zone. Inversions act as polarity flips, where bullish gaps become bearish resistance and bearish gaps become bullish support. Lower-timeframe volume data is also displayed inside zones to highlight whether buying or selling pressure dominated during gap creation.
🟠 FEATURES
Automatic detection of bullish and bearish FVGs with ATR-based thresholding.
Inversion logic: mitigated gaps flip into opposite-colored IFVG zones.
Volume text overlay inside each zone showing up vs down volume.
Visual markers (△/▽ for FVG, ▲/▼ for IFVG) when price exits a zone without mitigation.
🟠 USAGE
Apply the indicator to any chart and enable/disable bullish or bearish FVG detection depending on your focus. Use the colored gap zones as areas of interest: bullish gaps suggest possible continuation to the upside until mitigated, while bearish gaps suggest continuation down. When a gap flips into an inversion zone, treat it as potential support/resistance—bullish IFVGs below price may act as demand, while bearish IFVGs above price may act as supply. Watch the embedded up/down volume data to gauge the strength of participants during gap formation. Use the △/▽ and ▲/▼ markers to spot when price rejects gaps or inversions without filling them, which can indicate strong trending momentum. For practical use, combine alerts with your trade plan to track when new gaps form, when old ones are resolved, or when key zones flip into inversions, helping you align entries, targets, or reversals with institutional order flow logic.

Dizzy HOLO🚀 Dizzy HOLO is an all-in-one professional trading suite designed for serious traders.
It combines Pivot Points, Opening Range Breakout (ORB), HOLO (High of Low / Low of High), Weekly Levels, SMA Thresholds, and Real-Time Alerts into a single lightweight indicator.
🔑 Key Features:
✅ Pivot Points (Fibonacci & Camarilla) – Automatic support & resistance with labels.
✅ Opening Range Breakout (ORB) – Custom session ORB with historical data and breakout alerts.
✅ HOLO Strategy – Daily High/Low, Highest H1 Open, Lowest H1 Close with dynamic buy/sell zones.
✅ Weekly Levels – Previous Week High/Low/Open/Close with extended dotted projections.
✅ SMA Threshold Zones – Dynamic SMA with gray zone filter and trend-based candle coloring.
✅ Multi-Timeframe Analysis – Auto-switching pivots & real-time confirmation.
✅ Smart Alerts – Pivot breakouts, ORB levels, HOLO crosses, and Weekly breaks.
🎯 Why Use Dizzy HOLO?
This indicator is built for breakout, reversal, and trend traders. It provides clear market structure, liquidity zones, and actionable alerts so you never miss important setups.
🛠️ Best Suited For:
Intraday scalpers
Swing traders
Breakout traders
HOLO strategy followers
Multi-timeframe traders

Auto Levels & Smart Money [ #Algo ] Pro : Smart Levels is Smart Trades 🏆
"Auto Levels & Smart Money Pro" indicator is specially designed for day traders, pull-back / reverse trend traders / scalpers & trend analysts. This indicator plots the key smart levels , which will be automatically drawn at the session's start or during the session, if specific input is selected.
🔶 Usage and Settings :
A :
⇓ ( *refer 📷 image ) ⇓
B :
⇓ ( *refer 📷 images ) ⇓
🔷 Features :
a : automated smart levels with #algo compatibility.
b : plots auto SHADOW candle levels Zones ( smart money concept ).
c : ▄▀ RENKO Emulator engine ( plots Non-repaintable #renko data as a line chart ).
d : session 1st candle's High, Low & 50% levels ( irrespective of chart time-frame ).
e : 1-hour High & Low levels of specific candle, ( from the drop-down menu ), for any global market symbols or crypto.
f : previous Day / Week / Month, chart High & Low.
g : pivot point levels of the Daily, Weekly & Monthly charts.
h : 2 class types of ⏰ alerts ( only signals or algo execution ).
i : auto RENKO box size (ATR-based) table for 30 symbols.
j : auto processes " daylight saving time 🌓" data and plots accordingly.
💠Note: "For key smart levels, it processes data from a customized time frame, which is not available for the *free Trading View subscription users , and requires a premium plan." By this indicator, you have an edge over the paid subscription plan users and can automatically plot the shadow candle levels and Non-repaintable RENKO emulator for the current chart on the free Trading View Plan at any time frame .
⬇ Take a deep dive 👁️🗨️ into the Smart levels trading Basic Demonstration ⬇
▄▀ 1: "RENKO Emulator Engine" ⭐ , plots a noiseless chart for easy Top/Bottom set-up analysis. 10 types of 💼 asset classes options available in the drop-down menu.
LTP is tagged to current RSI ➕ volatility color change for instant decisions.
⇓ ( *refer 📷 image ) ⇓
🟣 2: "Shadow Candle Levels and Zones" will be drawn at the start of the session (which will project shadow candle levels of the previous day), and it comes with a zone. which specifies the Supply and Demand Zone area. *Shadow levels can be drawn for the NSE & BSE: Index/Futures/Options/Equity and MCX: Commodity/FNO market only.
⇓ ( *refer 📷 image ) ⇓https://www.tradingview.com/x/SIskBm77/
🟠 3: plots "Session first candle High, low, and 50%" levels ( irrespective of chart time-frame ), which a very important levels for an intraday trader with add-on levels of Previous Day, Week & Month High and Low levels.
⇓ ( *refer 📷 image ) ⇓
🔵 4: plots "Hourly chart candle" High & Low levels for the specific candles, selected from the drop-down menu with Pivot Points levels of Daily, Weekly, Monthly chart.
Note: The drop-down menu gives a manual selection of the hour candles for all "🌐 Crypto / XAU-USD / Forex / USA".
ex: "2nd hr" will give the session's First hour candle "High & Low" level.
⇓ ( *refer 📷 image ) ⇓
🔲 5: "Auto RENKO box size" ( ATR based ) : This indicator is specially designed for 'Renko' trading enthusiasts, where the Box size of the ' Renko chart ' for intraday or swing trading, ( ATR based ) , automatically calculated for the selected ( editable ) symbols in the table.
⇓ ( *refer 📷 image ) ⇓
*NOTE :
Table symbols are for NSE/BSE/USA.
Symbols are Non-editable (fixed).
Table Symbols for MCX only.
Table Symbols for XAU & 🌐CRYTO.
⏰ 6: "Alert functions."
⇓ ( *refer 📷 image ) ⇓
◻ : Total 8 signal alerts can be possible in a Single alert.
◻ : Total 12 #algo alerts , ( must ✔ tick the Consent check box for algo and alerts execution/trigger ).
💹 Modified moving average line. Includes data from both the exponential and simple moving average.
This Indicator will work like a Trading System . It is different from other indicators, which give Signals only. This script is designed to be tailored to your personal trading style by combining components to create your own comprehensive strategy . The synergy between the components is key to its usefulness.
It focuses on the key Smart Levels and gives you an Extra edge over others.
✅ HOW TO GET ACCESS :
You can see the Author's instructions to get instant access to this indicator & our premium suite. If you like any of my Invite-Only indicators, let me know!
⚠ RISK DISCLAIMER :
All content provided by "TradeWithKeshhav" is for informational & educational purposes only.
It does not constitute any financial advice or a solicitation to buy or sell any securities of any type. All investments / trading involve risks. Past performance does not guarantee future results / returns.
Regards :
TradeWithKeshhav & team
Happy trading and investing!

SMC BOS - Structure Breaks & Median Continuation ProjectionsThis tool shows what usually happens after a Break of Structure (BOS).
It scans past BOS events on your chart, finds the ones most similar to the latest break (using ATR to filter by volatility), and then plots the median continuation path.
Optional percentile bands (P10–P90) display the possible range of outcomes around the median.
Key features:
• Automatic detection of bullish and bearish BOS events
• Library of past BOS with adjustable size and spacing
• ATR-based similarity and recency weighting
• Median continuation projections with optional percentile bands
• Customizable colors, signals, and stats table
• Works on any market and timeframe
Use cases:
• See how price typically behaves after a BOS
• Support SMC analysis with data-driven projections
• Improve trade planning by visualizing likely continuations
• Apply across crypto, forex, stocks, and futures
Originality:
Instead of only marking BOS, this script learns from history and projects forward the median path of the most similar past cases, adjusted for volatility. It turns BOS signals into practical continuation scenarios.
Instructions:
Add the indicator to your chart. When a BOS is detected, the projection is drawn automatically.
Use the settings to adjust the library, ATR weighting, projection style, percentile bands, and the display of signals or stats.
For questions or customization, contact Julien Eche (Julien_Eche) on TradingView.

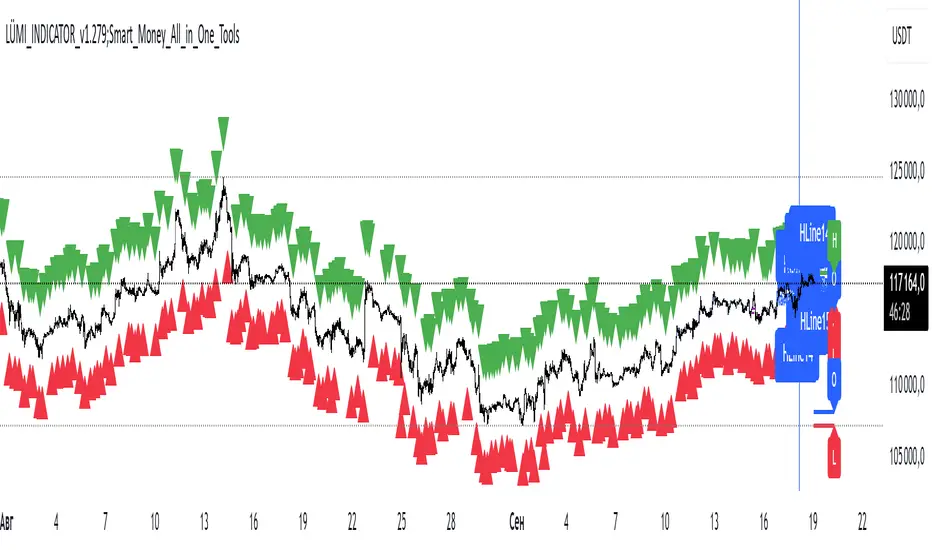
LÜMI_INDICATOR_v1.279_Smart_Money_All_in_One_Tools!!!Русский перевод внизу!!!!
Before using it, go to the settings and uncheck all the boxes!!!
And only then after that deal with this indicator, what you need from there, then add.
In the future, I will release a COMPLETE guide to this indicator with screenshots, so throw it to your favorites, don't waste it.
This version is still raw, but WORKING. There will be improvements in the structure of the indicator so that you can intuitively understand what each of the 100+(!) indicator settings is responsible for.
What's inside:
1. Session indicator. 15 Fully customizable time boxes, for any needs, and sessions. Enter your time zone, the time of your session, and that's it. There are also a couple of unexpected bonuses in this part of the indicator))
2. A set of horizontal lines of lines that come out at the right time for you. It is convenient to designate NYM, NYSE OPEN RANge, and other events on the chart that occur strictly on time. It can be widely used if you know what to look for.
3. Like the 2nd item, only vertical.
4. Fractal indicator.
5. OHL levels for
5.1. Current day
5.2. Current week
5.3. Current month.
6. Vertical chart dividers by opening levels
6.1 Days
6.2. Weeks
6.3. Months.
This feature is ideal for those who trade forex price delivery profiles or indices.
!!! Перед использованием зайдите в настройки и поснимайте все галочки!!!
И только потом после этого разбирайтесь с этим индюком, что вам оттуда нужно, то и добавляйте.
В дальнейшем выпущу ПОЛНЕЙШИЙ гайд на этот индюк со скриншотами, так что кидайте в избранное, не теряйте
Версия пока сырая, но РАБОЧАЯ. Будут доработки в структуре индикатора, чтобы можно было интуитивно понять, за что отвечает каждая из 100+(!) настроек индикатора
Что внутри:
1. Индикатор сессий. 15полностью настраиваемых боксов по времени, под любые нужды, и сессии. Вводите свой часовой пояс, время вашей сессии и всё. В этой части индикатора также есть пара неожиданных бонусов))
2. Набор горизонтальных линий линий, выходят в нужное для вас время. Удобно обозначать NYM, NYSE OPEN RANge, и другие события на графике, которые происходят строго по времени. Применение можно найти широкое, если знать, что искать
3. Как 2 пункт, только вертикальные.
4. Индикатор фракталов.
5. Уровни OHL для
5.1. Текущего дня
5.2. Текущей недели
5.3. Текущего месяца.
6. Вертикальные разделители графика по уровням открытия
6.1 Дня
6.2. Недели
6.3. Месяца.
Эта функция идеальна для тех, кто торгует профили доставки цены форекс или индексов.
Imbalance (FVG)Indicator Description
This script is designed to automatically identify and visualize Fair Value Gaps (FVGs), also known as Imbalances, on your chart. An FVG is a key price action concept that highlights areas where the price moved swiftly, leaving a gap behind. This indicator is simple to use and fully customizable, making it an excellent tool for both novice and experienced traders.
Key Features
Automatic Detection: The indicator scans the market in real-time, automatically drawing FVG zones for both Bullish and Bearish moves.
Mitigation Tracking: When the price returns to an FVG zone, the indicator automatically marks it as "mitigated" (filled) by changing its color and style. This provides a clear signal that the imbalance has been neutralized.
Extend Zones Into the Future: Unmitigated FVG zones are automatically extended into the future, allowing them to be used as potential future support or resistance levels.
Full Customization: The user has complete control over the indicator's appearance. You can change the colors for bullish, bearish, and mitigated zones, as well as toggle their visibility on and off.
Performance Optimization: A built-in limit for the number of drawn objects prevents chart clutter and avoids errors from TradingView's drawing limits, ensuring smooth performance.
How to Use?
FVG zones can be used in various ways, including:
Price Magnets: Markets often tend to revert to "fill" these gaps.
Potential Entry Points: Price entering an FVG zone can present an opportunity to open a position, especially if confirming signals appear.
Support/Resistance Zones: Unfilled gaps can act as strong, dynamic levels of support or resistance.

Multi TF - HTF→LTF OrderblocksMulti TF — HTF→LTF Orderblocks
Identify higher-timeframe (HTF) order blocks and project them onto your lower-timeframe (LTF) chart—clean, fast, and publication-ready.
The script automatically detects swing breaks on your chosen HTF, builds the originating order block, and renders that zone on your current chart so you can execute on lower timeframes with higher-timeframe context.
--------------------
How it works
HTF swing structure is tracked via pivot highs/lows and a user-selected break confirmation (Close or Wick).
On a valid break, the script backtracks to the last opposite candle and creates the HTF order block (wick-to-wick or body-only depending on your setting).
The OB is projected to the LTF and extended bar-by-bar until:
Mitigation: price penetrates at least 50% of the zone → the box is marked “old” (dimmed) or optionally auto-deleted.
Close-break: price closes beyond the far edge → zone is optionally removed immediately.
Each zone includes a centerline and an inside label showing the original HTF (e.g., “M15”, “H1”).
Key features
True HTF→LTF overlay: trade M1/M5 with M15/H1/H4 context.
Mitigation logic (≥50%): first meaningful touch turns the zone “old” or deletes it (your choice).
Close-break handling: auto-remove zones broken by close, to keep charts clean.
Overlap control: choose how to handle overlapping zones on the same side:
Keep Latest, Union (merge), or Intersection (refine).
Wicks vs. Bodies: build zones from full candle range or just the body.
Lightweight UI: only the relevant inputs in the panel; sensible defaults.
Alert included: fires on the first 50% mitigation of any fresh zone.
Performance-friendly limits: cap the number of active zones to fit Pine limits.
Inputs (quick overview)
HTF for Order Blocks: timeframe to scan (e.g., 15, 60, 240, D).
Swing Length (Pivot L/R): pivot sensitivity for structure.
Break Confirmation: Close (recommended) or Wick.
Zones use Wicks: on/off for wick-to-wick zones.
OB Lookback before Break: how far to search for the opposite candle.
Max Active Zones: hard cap for chart cleanliness & performance.
Delete on Close-Break: remove zones that are invalidated by a close.
Delete after Mitigation: remove once a 50% touch occurs.
Handle Overlap: None, Keep Latest, Union (merge), Intersection (refine).
Colors & Border: fresh/old zone colors (default ~35% opacity) and optional borders.
Default profile (as shipped):
Break by Close, zones use wicks, Union overlap handling, 250 lookback, 250 max zones, borders off, and HTF label printed inside each zone.
How to use (suggested workflow)
Pick an HTF (e.g., H1 for intraday) and drop to your execution TF (e.g., M5/M1).
Wait for price to tap ≥50% of a fresh OB → look for your LTF trigger (CHOCH, iFVG, PA).
Place SL beyond the zone (or beyond the LTF swing) and manage to your targets (e.g., 2R–3R or to the next HTF OB).
Keep charts clean by enabling Delete on Close-Break and (optionally) Delete after Mitigation.
Alerts
“OB: Zone berührt (Erstkontakt)” — triggers on the first ≥50% mitigation of any fresh zone.
Create additional TradingView alerts with this condition to get notified in real time.
Notes & limitations
Built with request.security(..., lookahead_off) to avoid future-bar peeking; zones only form after a confirmed HTF break.
As with all pattern-based tools, use alongside your risk management and a defined entry model.
Pine has strict limits on drawings; use Max Active Zones to balance coverage and performance.
Credits
Designed for traders who want HTF precision with LTF execution—a clean, opinionated OB overlay that focuses on what matters: fresh zones, first touch, and invalidation.
High Probability Order Blocks [AlgoAlpha]🟠 OVERVIEW
This script detects and visualizes high-probability order blocks by combining a volatility-based z-score trigger with a statistical survival model inspired by Kaplan-Meier estimation. It builds and manages bullish and bearish order blocks dynamically on the chart, displays live survival probabilities per block, and plots optional rejection signals. What makes this tool unique is its use of historical mitigation behavior to estimate and plot how likely each zone is to persist, offering traders a probabilistic perspective on order block strength—something rarely seen in retail indicators.
🟠 CONCEPTS
Order blocks are regions of strong institutional interest, often marked by large imbalances between buying and selling. This script identifies those areas using z-score thresholds on directional distance (up or down candles), detecting statistically significant moves that signal potential smart money footprints. A bullish block is drawn when a strong up-move (zUp > 4) follows a down candle, and vice versa for bearish blocks. Over time, each block is evaluated: if price “mitigates” it (i.e., closes cleanly past the opposite side and confirmed with a 1 bar delay), it’s considered resolved and logged. These resolved blocks then inform a Kaplan-Meier-like survival curve, estimating the likelihood that future blocks of a given age will remain unbroken. The indicator then draws a probability curve for each side (bull/bear), updating it in real time.
🟠 FEATURES
Live label inside each block showing survival probability or “N.E.D.” if insufficient data.
Kaplan-Meier survival curves drawn directly on the chart to show estimated strength decay.
Rejection markers (▲ ▼) if price bounces cleanly off an active order block.
Alerts for zone creation and rejection signals, supporting rule-based trading workflows.
🟠 USAGE
Read the label inside each block for Age | Survival% (or N.E.D. if there aren’t enough samples yet); higher survival % suggests blocks of that age have historically lasted longer.
Use the right-side survival curves to gauge how probability decays with age for bull vs bear blocks, and align entries with the side showing stronger survival at current age.
Treat ▲ (bullish rejection) and ▼ (bearish rejection) as optional confluence when price tests a boundary and fails to break.
Turn on alerts for “Bullish Zone Created,” “Bearish Zone Created,” and rejection signals so you don’t need to watch constantly.
If your chart gets crowded, enable Prevent Overlap ; tune Max Box Age to your timeframe; and adjust KM Training Window / Minimum Samples to trade off responsiveness vs stability.

Engulfing Pro v1Engulfing Pro v1 — Pro Inside (C2-in-wick) signals
Engulfing Pro v1 finds a precise three-bar sequence designed to catch clean continuations or turns after an impulsive move. The signal—called Pro Inside—fires when price closes back inside the wick of a prior engulfing bar, often indicating a controlled pullback into freshly swept liquidity.
What it detects
Engulfing pre-condition (Bars -2 → -1):
A strict bullish or bearish body engulfing occurs one bar before the signal (larger body, full body containment).
Pro Inside signal (Bar 0 / C2):
The current bar (C2) closes inside the wick of the engulfing bar (C1):
Bullish: C2 closes inside C1’s upper wick
Bearish: C2 closes inside C1’s lower wick
Optional C3 confirmation (info only):
The next bar closes beyond C2’s extreme (above for bullish, below for bearish).
Why it matters
The “close-inside-wick” structure frequently marks a measured pullback after momentum just flipped (engulfing), offering a clear, rules-based entry with defined invalidation.
Inputs
Show Pro Inside (Bullish) — toggle bullish signals
Show Pro Inside (Bearish) — toggle bearish signals
Change bar color on signal (C2) — color C2 (lime/red)
Plot markers — C2 triangles and ✔ on C3 confirmations
Boundary padding (ticks) — nudge wick bounds to reduce marginal touches
Visuals & Alerts
Markers:
“C2” triangle up/down on qualifying bars
“✔” circle on C3 confirmations
Alert names:
Pro Inside (Bullish)
Pro Inside (Bearish)
Pro Inside — Bullish C3 confirmation
Pro Inside — Bearish C3 confirmation
How to use (ideas, not advice)
Entry: Aggressive at/after C2 close; conservative on C3 confirmation.
Stops: Common placements beyond the opposite side of C2, or beyond C1’s wick.
Confluence: Pair with market structure, higher-timeframe bias, or Supply & Demand zones for selectivity.
Timeframes/markets: Works on any symbol/TF; adapt padding for volatility.
Notes
Evaluates on bar close (no look-ahead).
Visual/alert tool for study and workflow—not financial advice.
Always forward-test and risk-manage appropriately.

SMC Analysis - Fair Value Gaps (Enhanced)SMC Analysis - Fair Value Gaps (Enhanced) Script Summary
Overview
The "SMC Analysis - Fair Value Gaps (Enhanced)" script, written in Pine Script (version 6), is a technical analysis indicator designed for TradingView to identify and visualize Fair Value Gaps (FVGs) on a price chart. It supports both the main timeframe and multiple higher timeframes (MTF) for comprehensive market analysis. FVGs are price gaps formed by a three-candle pattern, indicating potential areas of market inefficiency where price may return to fill the gap.
Key Features
FVG Detection:
Identifies bullish FVGs: Occur when the high of a candle two bars prior is lower than the low of the current candle, with the middle candle being bullish (close > open).
Identifies bearish FVGs: Occur when the low of a candle two bars prior is higher than the high of the current candle, with the middle candle being bearish (close < open).
Visualizes FVGs as colored boxes on the chart (green for bullish, red for bearish).
Mitigation Tracking:
Tracks when FVGs are touched (price overlaps the gap range) or mitigated (price fully closes the gap).
Strict Mode: Marks an FVG as mitigated when price touches the gap range.
Normal Mode: Requires a full breakthrough (price crossing the gap’s bottom for bullish FVGs or top for bearish FVGs) for mitigation.
Optionally converts FVG box borders to dashed lines and increases transparency when partially touched.
Multi-Timeframe (MTF) Support:
Analyzes FVGs on three user-defined higher timeframes (default: 15m, 60m, 240m).
Displays MTF FVGs with distinct labels and slightly more transparent colors.
Ensures no duplicate processing of MTF bars to maintain performance.
Customization Options:
FVG Length: Adjustable duration for how long FVGs are displayed (default: 20 bars).
Show/Hide FVGs: Toggle visibility for main timeframe and each MTF.
Color Customization: User-defined colors for bullish and bearish FVGs (default: green and red).
Display Options: Toggle for showing dashed lines after partial touches and strict mitigation mode.
Performance Optimization:
Limits the number of displayed boxes (50 for main timeframe, 20 per MTF) to prevent performance issues.
Automatically removes older boxes to maintain a clean chart.
Functionality
Visualization: Draws boxes around detected FVGs, with customizable colors and text labels ("FVG" for main timeframe, "FVG " for MTF).
Dynamic Updates: Extends or terminates FVG boxes based on mitigation status and user settings.
Efficient Storage: Uses arrays to manage FVG data (boxes, tops, bottoms, indices, mitigation status, and touch status) separately for main and MTF analyses.
Use Case
This indicator is designed for traders using Smart Money Concepts (SMC) to identify areas of market inefficiency (FVGs) for potential price reversals or continuations. The MTF support allows analysis across different timeframes, aiding in confirming trends or spotting higher-timeframe support/resistance zones.

Smart Money Price Action ProSmart Money Price Action Pro - Smart Money and Price Action Dynamic Toolkit
The Smart Money Price Action Pro is designed to bring together multiple layers of market analysis into a single, cohesive framework, combining trend identification and consolidation detection in an actionable format. While individual indicators can provide useful insights, they often work in isolation. This toolkit integrates market flow detection, range analytics, and adaptive visualization into one system, allowing traders to see the bigger picture without piecing together multiple disconnected tools.
Building on principles from institutional trading behaviors, the toolkit gives traders a clearer picture of where “smart money” may be entering or exiting the market. Its design emphasizes confluence: signals from multiple independent modules overlap to create higher conviction setups, offering a structured edge when planning entries, exits, and risk levels.
At its core, the toolkit addresses the duality of market conditions: trending versus ranging. By offering a combination of trend-following signals and contrarian insights, it helps traders operate with a deeper understanding of market structure. While it provides actionable signals and visual guidance, it is intended as an assistive system, helping traders make more informed decisions rather than serving as a single source of truth.
Key Modules
1. Smart Money Signal Module
The Smart Money Signal Module identifies potential institutional activity by analyzing price swings and momentum shifts. Using configurable swing detection, it highlights potential reversal or continuation zones, expressed as adaptive zones around key market levels.
Signals are augmented with trend-colored candle overlays, offering immediate guidance on market bias. Bullish and bearish zones are clearly marked, while continuation and reversal markers help distinguish between trend shifts and market noise.
At its core, the engine applies swing detection combined with a sensitivity filter to track directional momentum across recent bars. This allows it to pinpoint bullish pivots (where downside momentum fades and strength returns) and bearish pivots (where upside momentum collapses). Once a pivot is confirmed, the system draws flow lines that map the breakout and classify it as either continuation or reversal, depending on broader market bias.
Momentum zones are then plotted to show areas where buyers stepped in with strength or sellers forced price lower. These levels extend forward dynamically, shifting in real time as new data forms. Zones change color the moment they break, visually confirming whether market structure has held or failed. Gradient shading highlights periods of extreme pressure, giving traders a clear visual of when momentum surges into overbought or oversold territory.
Instead of simply showing trend direction, this module also maps accumulation and distribution zones tied to institutional flows. When combined with the Range Module, these zones become more meaningful — for example, when institutional accumulation aligns with a breakout from consolidation.
Practical Use: Traders can use these signals to align trades with institutional flows. For example, entering a long position near a bullish accumulation zone or managing risk when bearish distribution areas form. By combining these insights with higher timeframe analysis, traders can filter out false signals and improve decision-making.
2. Range Detection Module
The Range Detection engine continuously monitors price action to flag when markets transition into consolidation phases. Ranges are defined not just by flat price action, but by a measurable contraction in volatility, repeated touches of boundary levels, and the clustering of traded volume around a central equilibrium point.
Once a valid range is identified, the system assigns a compression strength score (0–100). This score reflects how cleanly defined and structurally sound the consolidation is—higher scores indicate tighter boundaries and stronger evidence of accumulation or distribution.
Breakout tendencies are modeled dynamically. The system updates a forward-looking bias by incorporating:
Boundary time distribution – how often price presses against upper vs. lower edges
Historical breakout patterns – probability benchmarks derived from structurally similar ranges
Volume skew – whether traded volume leans toward buyers or sellers inside the range
Momentum alignment – auxiliary filters such as slope-based oscillators that indicate when energy is building for a directional move
The result is a live breakout forecast that evolves bar by bar as the range matures. Each active range carries a visual strength meter plotted above the consolidation zone, quantifying both compression and breakout potential in real time.
The module also supports range memory, preserving completed consolidations even after a breakout. This allows traders to review the prior structure for post-analysis or to track whether price respects the boundaries of the old range as support or resistance going forward.
Practical Use : Traders can use these ranges to anticipate breakout direction or step aside when conditions are unclear. A tight consolidation near a bullish zone, for instance, often signals a potential long opportunity, while overlapping bearish flows warn of false breakouts.
Integrated Workflow
The strength of the toolkit lies in its synergy. Each module is effective on its own, but the real advantage comes when their signals align.
A typical workflow may include:
Assessing the market trend using the Smart Money Signal Module and its trend-colored overlays
Identifying consolidation and breakout zones with the Range Detection Module
Watching for confluences: institutional accumulation aligning with range compression, or dashboard bias matching local setups
Executing trades with structured confidence, using these layered confirmations rather than relying on a single trigger
This integrated workflow streamlines decision-making and avoids the conflicting signals that can occur when combining unrelated indicators.
Additional Features
Adaptive Visualization : Dynamic zones and trend overlays adjust to volatility, keeping charts clear and focused
Analytics Dashboard : A compact summary panel shows active zones, bullish vs bearish flow counts, and current bias, giving context at a glance
Instead of simply adding more signals, the dashboard provides a meta-layer of analysis — context, bias, and flow strength — helping traders manage risk and stay aligned with broader market conditions.
Use Cases
Trend Confluence : Entering trades in line with prevailing smart money flows while filtering out counter-trend setups
Breakout Trading : Using the Range Detection Module to anticipate breakout zones and confirming direction with institutional flow signals
Contrarian Reversal Trades : Targeting accumulation/distribution zones where both modules indicate potential reversals
Each use case demonstrates how layered confluence creates clarity and conviction, making the toolkit a strong complement to other forms of technical analysis.
Conclusion
The Smart Money Signals Toolkit simplifies complex market analysis into actionable, visually intuitive insights. While standalone indicators provide value, this toolkit goes further by combining smart money flows, range detection, adaptive zones, and dashboard analytics into one cohesive system.
It doesn’t just generate buy/sell markers — it shows why a setup matters, where it is occurring, and how it aligns with broader conditions. This allows traders to operate with greater clarity, structure, and discipline.
Risk Disclaimer : This toolkit and its features are for educational and informational purposes only. Past performance does not guarantee future results. All suggested use cases are theoretical and should be applied with proper risk management.

Liquidity Sweep Breakout - LSBLiquidity Sweep Breakout - LSB
A professional session-based breakout system designed for OANDA:USDJPY and other JPY pairs.
Not guesswork, but precision - built on detailed observation of institutional moves to capture clear trade direction daily.
Master the Market’s Daily Bank Flow.
---
Strategy Detail:
I discovered this strategy after carefully studying how Japanese banks influence the forex market during their daily settlement period. Banks are some of the biggest players in the financial world, and when they adjust or settle their accounts in the morning, it often creates a push in the market. From years of observation, I noticed a consistent pattern, once banks finish their settlements, the market usually continues moving in the same direction that was formed right after those actions. This daily banking flow often sets the tone for the entire trading session, especially for JPY pairs like USDJPY.
To capture this move, I built the indicator so that it follows the bank-driven trend with clear rules for entries, stop-loss (SL), and take-profit (TP). The system is designed with professional risk management in mind. By default, it assumes a $10,000 account size, risks only 1% of that balance per trade, and targets a 1:1.5 reward-to-risk ratio. This means for every $100 risked, the potential profit is $150. Such controlled risk makes the system safer and more sustainable for long-term traders. At the same time, users are not limited to this setup, they can adjust the account balance in the settings, and the indicator will automatically recalculate the lot size and risk levels based on their own capital. This ensures the strategy works for small accounts and larger accounts alike.
🌍 Why It Works
Fundamentally driven: Based on **daily Japanese banking settlement flows**.
Session-specific precision: Targets the exact window when USDJPY liquidity reshapes.
Risk-managed: Always calculates lot size based on account and risk preferences.
Automatable: With webhook + MT5 EA, it can be fully hands-free.
---
✅ Recommended
Pair: USDJPY (best observed behavior).
Timeframe: 3-Minute chart.
Platform: TradingView Premium (for webhooks).
Execution: MT5 via EA.
---
🔎 Strategy Concept
The Tokyo Magic Breakout (TMB) is built on years of session observation and the unique daily rhythm of the Japanese banking system.
Every morning between 5:50 AM – 6:10 AM PKT (09:50 – 10:10 JST), Japanese banks perform daily reconciliation and settlement. This often sets the tone for the USDJPY direction of the day.
This strategy isolates that critical moment of liquidity adjustment and waits for a clean breakout confirmation. Instead of chasing noise, it executes only when price action is aligned with the Tokyo market’s hidden flows.
---
🕒 Timing Logic
Session Start: 5:00 AM PKT (Tokyo market open range).
Magic Candle: The 5:54 AM PKT candle is marked as the reference “breakout selector.”
Checkpoints: First confirmation at 6:30 AM PKT, then every 15 minutes until 8:30 AM PKT.
* If price stays inside the magic range → wait.
* If a breakout happens but the candle wick touches the range → wait for the next checkpoint.
* If by 8:30 AM PKT no clean breakout occurs → the day is marked as No Trade Day (NTD).
👉 Recommended timeframe: 3-Minute chart (3M) for precise signals.
---
📈 Trade Execution
Entry: Clean break above/below the magic candle’s range.
Stop-Loss: Opposite side of the Tokyo session high/low.
Take-Profit: Calculated by Reward\:Risk ratio (default 1.5:1).
Lot Size: Auto-calculated based on your risk model:
* Fixed Dollar
* % of Equity
* Conservative (minimum of both).
Visuals include:
✅ Entry/SL/TP lines
✅ Shaded risk (red) and reward (green) zones
✅ Trade labels (Buy/Sell with lot size & levels)
✅ TP/SL hit markers
---
🔔 Alerts & Automation (AutoTMB)
This strategy is fully automation-ready with EA + MT5:
1. Enable alerts in TMB settings.
2. Insert your PineConnector License Key.
3. Configure your risk management preferences.
4. Create a TradingView alert → in the message box simply type:
Pine Script®
{{alert_message}}
and set the EA webhook.
Now, every breakout trade (with exact entry, SL, TP, and lot size) is sent instantly.
👉 On your MT5:
* Install the EA.
* Use the same license key.
* Run it on a VPS or local MT5 terminal.
You now have a hands-free trading system: AutoTMB.

FX4M by fx4_livingFX4M Simplified by fx4_living
1. Previous Period Framework
Selectable Period: Prior Daily, Weekly, or Monthly.
Range Box: Full high-to-low span of the prior period, shaded by up/down close.
Body Box: Open-to-close section within the range box.
High/Low Lines: Horizontal lines at the previous period’s high/low.
Equilibrium Line: Midpoint between the previous high and low.
2. Intraday Opening Lines
Plots reference price lines for:
Daily Open
(00:00 New York) Midnight Open
09:30 AM Open
13:30 PM Open
Current-Hour Open; plus Weekly/Monthly Opens when Weekly/Monthly is selected.
Each line has its own color, style, and time/price label.
3. Intraday High/Low Tracking
Marks the current day’s highest and lowest prices.
“D-H” and “D-L” labels with time in tooltip.
4. Accumulation Range
Definition: First one-third of the selected reference period.
Shows full range (high-to-low) and body (open-to-close), shaded by up/down close.
After it ends, the Accumulation High/Low/EQ are drawn as horizontal lines.
Optional alerts mark the first time the Accumulation High or Low is reached.
5. Accumulation Range Deviation Levels
After the Accumulation period ends, horizontal levels are drawn at ±0.5, ±1.0, ±1.5 … ±3.5 of the Accumulation range size from its High/Low. Optional small labels show the level value.
Optional alerts mark the first time each deviation level is reached.
6. Previous Period Hit Detection
Marks the first time price reaches the prior period’s High, Low, or Equilibrium during the current period.
Optional alerts are possible.
7. Pre-Market Zone
Marks 05:00–06:59 New York time with a shaded box and dotted midline; color reflects up/down close. The midline can extend forward.
Displayed on intraday charts up to 15 minutes.
8. Status Table
Daily High (time & price)
Daily Equilibrium (current deviation % and price)
Daily Low (time & price)
MWD Institutional order flow (optional): shows Daily/Weekly/Monthly closes vs. their respective opens (directional arrows in colored cells).
Customizable Watermark (optional).
Enjoy
fx4_living
Liquidity Sweep Scanner [TradingFinder]🔵 Introduction
Recognizing how liquidity develops and how price reacts at key structural levels is critical for spotting precise, low-risk trade entries. The Liquidity Sweep Scanner is an advanced tool built to track market activity in real time, pinpoint liquidity sweeps, define reaction zones, and identify confirmation candles across multiple instruments and timeframes.
Key Advantages :
Detects high-probability reversal points with precision.
Combines liquidity analysis, market structure, and candle confirmation.
Works seamlessly across multiple symbols and timeframes.
This screener can scan a broad watchlist or analyze every timeframe of a single asset to find optimal reversal zones. It starts by identifying a clear swing point either a swing high or swing low and marking a reaction zone between that point and the candle’s highest or lowest open/close value.
If price revisits the zone, performs a liquidity grab, and forms an indecision candle such as a doji or narrow-bodied bar that closes inside the zone, this may indicate rejection of the level and a failed breakout attempt. Based on the surrounding market context, the screener then flags a potential bullish or bearish reversal and generates the appropriate Long or Short signal.
By focusing on precise entry timing, institutional order flow alignment, and filtering out false breakouts, the Liquidity Sweep Scanner zeroes in on the market areas where liquidity engineering, reversal potential, and inefficiency overlap. This makes it an indispensable tool for price action traders who rely on clear, high-quality setups without the distraction of market noise.
🔵 How to Use
The Liquidity Sweep Scanner continuously evaluates market structure, issuing alerts when a potential reversal setup emerges. It merges liquidity behavior, swing point analysis, and candle confirmation within predefined reaction zones.
To illustrate, imagine price forms a swing high or low, then later returns to that level. If it sweeps the prior extreme and produces a qualifying candle inside the reaction zone, the tool signals a possible reversal.
🟣 Long Setup
For a bullish scenario, the screener first spots a valid swing low a level often packed with sell-side liquidity. From there, it defines a reaction zone stretching from the swing low to the candle’s lowest open/close point.
If price retests this area with a wick dipping below the swing low but then closes back inside the zone, it signals absorption of selling pressure and rejection of further downside. The screener then awaits a confirmation candle commonly a doji or small-bodied bar closing inside the zone. Once these conditions align, a Long signal is logged and, if alerts are active, the trader receives a notification.
🟣 Short Setup
For bearish opportunities, the process begins by locating a valid swing high typically an area dense with buy-side liquidity. The reaction zone is drawn from the swing high to the candle’s highest open/close value.
When price retests this zone, sweeps above the swing high, and fails to close higher, it suggests a bull trap and waning upward momentum. The screener then requires a confirmation candle often a doji or rejection bar that closes back within the zone before confirming a Short signal.
These bearish setups help traders pinpoint likely institutional sell zones, offering a clear view of where price may reverse following a liquidity event.
🔵 Settings
🟣 Logical settings
Liquidity Swing period : You can set the swing detection period.
Market Structure Period :You can set the Pivot Period to determine the detection direction.
Max Swing Back Method : It is in two modes "All" and "Custom". If it is in "All" mode, it will check all swings, and if it is in "Custom" mode, it will check the swings to the extent you determine.
Max Swing Back : You can set the number of swings that will go back for checking.
Maximum Distance Between Swing and Signal : The maximum number of candles allowed between the swing point and the potential signal. The default value is 50, ensuring that only recent and relevant price reactions are considered valid.
🟣 Display Settings
Table on Chart : Allows users to choose the position of the signal dashboard either directly on the chart or below it, depending on their layout preference.
Number of Symbols : Enables users to control how many symbols are displayed in the screener table, from 10 to 20, adjustable in increments of 2 symbols for flexible screening depth.
Table Mode : This setting offers two layout styles for the signal table :
Basic : Mode displays symbols in a single column, using more vertical space.
Extended : Mode arranges symbols in pairs side-by-side, optimizing screen space with a more compact view.
Table Size : Lets you adjust the table’s visual size with options such as: auto, tiny, small, normal, large, huge.
Table Position : Sets the screen location of the table. Choose from 9 possible positions, combining vertical (top, middle, bottom) and horizontal (left, center, right) alignments.
🟣 Symbol Settings
Each of the 10 symbol slots comes with a full set of customizable parameters :
Symbol : Define or select the asset (e.g., XAUUSD, BTCUSD, EURUSD, etc.).
Timeframe : Set your desired timeframe for each symbol (e.g., 15, 60, 240, 1D).
🟣 Alert Settings
Alert : Enables alerts for LSS.
Message Frequency : Determines the frequency of alerts. Options include 'All' (every function call), 'Once Per Bar' (first call within the bar), and 'Once Per Bar Close' (final script execution of the real-time bar). Default is 'Once per Bar'.
Show Alert Time by Time Zone : Configures the time zone for alert messages. Default is 'UTC'.
🔵 Conclusion
The Liquidity Sweep Scanner equips traders with a precise, structured method for spotting high-probability reversals by merging liquidity sweeps, reaction zone mapping, and candle confirmation.
It not only filters out market noise but also highlights price areas where inefficiency and reversal potential align. Beyond identifying clean entry points, the tool includes a market direction detection feature allowing traders to quickly determine the prevailing trend and align their trades accordingly.
With adjustable settings such as the Pivot Period for fine-tuning detection direction, it adapts to various trading styles and timeframes, making it a powerful and versatile addition to any trader’s strategy.
Платный скрипт

Market Sessions — FOREXSOM Editionding for chart screenshots and videos.
Cleaner Interface: Organized settings into clear groups for a smoother user experience.
Bug Fixes: Improved “Only Last…” logic for more stable plotting.
Why I Use and Recommend It:
Easily spot active trading sessions with visual clarity.
Identify key institutional price levels in real time.
Ideal for day traders, swing traders, and anyone applying Smart Money Concepts.
Fully customizable colors and styles to fit any personal workflow.
