RSI + Stochastics RSI Multi-Timeframe[nakano]# RSI + Stochastics RSI Multi-Timeframe
## English Description
### Overview
This indicator focuses on a powerful **Multi-Timeframe (MTF) Dashboard** that integrates both RSI and Stochastic RSI. It allows traders to monitor the trend status and momentum of up to **11 different timeframes** simultaneously in a single, compact table.
### Key Features
* **Massive MTF Support:** Configure up to 11 individual timeframe slots (TF0 to TF10), covering everything from 1-minute to monthly charts.
* **Dual Oscillator Table:** The dashboard displays data for both RSI and Stochastic RSI in each timeframe row, providing a complete view of market momentum.
* **Heatmap Logic:** The table background colors automatically change based on RSI values relative to the 50 line (Green zone / Red zone), making it easy to spot trends instantly.
* **Trend Arrows:**
* **RSI Arrow:** Indicates the slope of the RSI's moving average (Rising/Falling).
* **Stoch Arrow:** Indicates the crossover status (Golden Cross / Dead Cross).
### Settings
* **MTF Table Timeframes:** Enable/Disable and configure timeframes for slots TF0 through TF10.
* **Table Appearance:** Adjust the table position, text size, and toggle visibility for RSI or Stochastic rows.
* **Oscillator Periods:** Customize the calculation lengths for RSI and Stochastic RSI.
---
## 日本語 (Japanese Description)
### 概要
このインジケーターは、RSIとストキャスティクスRSIを統合した強力な**マルチタイムフレーム(MTF)ダッシュボード**機能に特化しています。最大**11種類の時間足**におけるトレンド状態とモメンタムを、コンパクトなテーブルで一括監視することが可能です。
### 主な機能
* **多機能なMTFサポート:** 1分足から月足まで、最大11個の時間足スロット(TF0~TF10)を個別に設定し、テーブルに表示できます。
* **デュアル・オシレーター・テーブル:** 各時間足の行にRSIとストキャスティクスRSIの両方のデータを表示し、市場の勢いを複合的に判断できます。
* **ヒートマップロジック:** RSIの値が50を上回っているか(緑ゾーン)、下回っているか(赤ゾーン)に基づいてテーブルの背景色が自動的に変化し、トレンドの方向を一目で把握できます。
* **トレンド矢印:**
* **RSI矢印:** RSI移動平均線の傾き(上昇/下降)を表示します。
* **Stoch矢印:** ストキャスティクスのクロス状態(ゴールデンクロス/デッドクロス)を表示します。
### 設定項目
* **MTF Table Timeframes:** TF0からTF10までの各スロットの有効化と時間足の設定。
* **Table Appearance:** テーブルの表示位置、文字サイズ、RSI行・Stoch行の表示切り替え。
* **Oscillator Periods:** RSIおよびストキャスティクスRSIの計算期間のカスタマイズ。
Стохастический осциллятор

ChromaFlows Momentum Index | LUPENIndicator Guide: ChromaFlows Momentum Index
Overview
The ChromaFlows Momentum Index is a next-generation momentum oscillator designed to filter out market noise and visualize pure trend strength. Unlike traditional indicators that often give conflicting signals, ChromaFlows uses a Consensus Algorithm. It simultaneously analyzes three distinct engines—RSI, Fast Stochastic, and Slow Stochastic—and only lights up when they all agree on the market direction.
The result is a fluid, glowing "Wave" that provides an immediate visual read on market sentiment:
Green Glow: Strong Bullish Consensus (Safe to buy/hold).
Red Glow: Strong Bearish Consensus (Safe to sell/short).
Gray/Neutral: Indecision or Choppy Market (Stay out or tread carefully).
Key Visual Components
1. The Gradient Wave (Main Oscillator)
This is the heartbeat of the indicator. It is usually based on the Slow Stochastic (customizable in settings) but its color is determined by the Consensus Logic.
How to read it: The higher the wave, the more overbought; the lower, the more oversold. However, pay attention to the Glow Intensity. A bright, solid color indicates all underlying indicators are aligned.
2. The SMI Line (Gold Line)
Overlaid on the wave is the SMI (Stochastic Momentum Index) Blau line. This acts as a fast-moving "Signal Line".
Usage: Watch for how this line interacts with the main wave. It leads price action and often signals reversals before they happen.
3. Signal Arrows (Triangles on the Wave)
▲ Cyan Triangle: SMI Crossover UP. This occurs when the Main Wave crosses above the SMI Signal line. This is a potential Long Entry.
▼ Magenta Triangle: SMI Crossover DOWN. This occurs when the Main Wave crosses below the SMI Signal line. This is a potential Short Entry.
4. Hull Trend Markers (Circles/Shapes at Edges)
Located at the very top and bottom of the indicator panel are the Hull Moving Average (HMA) filters.
Bottom Blue/Green Marker: The longer-term Hull Trend is UP.
Top Orange/Red Marker: The longer-term Hull Trend is DOWN.
How to Trade Strategy
✅ The "Flow" Setup (High Probability)
This strategy focuses on taking trades with the momentum consensus.
Wait for the Glow: Look for the Wave to turn Neon Green (Bullish) or Neon Red (Bearish). This confirms momentum is present.
Check the Filter: Ensure the Hull Trend Marker (at the top/bottom) matches the wave color (e.g., Blue marker + Green Wave).
The Trigger: Enter when a Triangle Signal Arrow appears in the direction of the color.
Example: Wave is Green + Cyan Triangle appears = STRONG BUY.
⚠️ The "Reversal" Setup (Aggressive)
Divergence: Price makes a new high, but the ChromaFlows Wave makes a lower high.
Color Shift: The wave changes from Green to Gray (Neutral), indicating momentum is dying.
The Trigger: Wait for a Magenta Triangle (Cross Down) to confirm the reversal.
⛔ The "No-Trade" Zone
When the Wave is Gray and hovering near the zero line, the markets are ranging or the indicators are conflicting. It is statistically safer to stand aside until the "ChromaFlow" (Green or Red color) returns.
Settings Configuration
Wave Source: Choose which oscillator drives the main wave (Default: Stochastic_2).
Consensus Sensitivity: Adjust the periods of the RSI and Stochastics to make the "Glow" appear faster (more signals) or slower (more filtering).
Visuals: All colors are fully customizable via Hex codes to match your chart theme.

FullerOSOBSQZ v1.1.22FullerOSOBSQZ v1.1.x — OS/OB Levels + Squeeze Anchor + Slope Accel + Alerts
What this script does
Plots Oversold (OS) and Overbought (OB) price levels as horizontal segments (line breaks) that persist for a configurable number of bars.
Tracks two layers of OS/OB logic:
Base triggers (broader detection)
Refined triggers (stricter pattern match layered on top of Base)
Plots a Squeeze anchor level during squeeze “ON” runs and provides squeeze lifecycle alerts (start/release + bull/bear release).
Optionally plots OS/OB start markers (seed points) and slope-acceleration markers for momentum context.
Provides alertconditions for starts, active lines, price interactions, within-N-bar follow-through, squeeze lifecycle, and hold/confirm.
Core Concepts
Mutually inclusive Base + Refined
Refined logic is not a competing system. It is a stricter confirmation layer on top of the Base logic.
You can use Base levels as the “watch” context, and Refined levels as a higher-confidence confirmation (or display both).
Line segments (line breaks)
OS/OB levels are drawn as horizontal segments using line-break style plotting. Each segment represents a “reference level” that remains valid for a limited number of bars after it triggers.
If a new, more extreme OS/OB triggers while a prior one is active, the plot will step to the new level (by design).
How to read the plots
OS Levels (below price)
These are support reference levels. Common reads:
Touch : price trades into the OS line.
Reclaim : close crosses back above the OS line.
Bounce : price dips below OS intrabar but closes above it (same bar).
Hold/Confirm : close stays above OS for N consecutive bars.
OB Levels (above price)
These are resistance reference levels. Common reads:
Touch : price trades into the OB line.
Reject : price trades above/into OB but closes back below it.
Breakout : close crosses above OB.
Hold/Confirm : close stays below OB for N consecutive bars (bear confirmation) or use breakout/hold logic for bull continuation.
Squeeze Anchor
When squeeze is ON, the script anchors a reference line from the first ON bar and holds it for the duration of the continuous squeeze run.
On squeeze release (OFF), you can interpret direction by where price closes relative to the anchor.
Slope Acceleration Markers
These markers highlight momentum inflection behavior derived from the internal regression/slope logic.
If you see fewer markers than another script, it usually means the underlying trend-gate and/or slope parameters differ (not that the feature is “missing”).
Settings — What they do and how changing them affects signals
1) Base Triggers
Controls the Base OS/OB detection layer.
Changing Base thresholds generally affects:
Frequency : looser = more lines; stricter = fewer lines
Quality : stricter = fewer but cleaner levels
Responsiveness : shorter lookbacks = faster reacting, more noise; longer = slower, smoother
2) Base Lines
Controls the Base OS/OB plotted appearance and segmentation length.
Segment length (forward bars): longer = level remains visible/valid longer; shorter = faster turnover and fewer active segments.
Line width : purely visual emphasis (does not change the underlying detection).
3) Refined Triggers
Controls the stricter confirmation layer (Refined OS/OB).
Refined triggers typically reduce false positives but may occur later than Base.
Use Refined when you want: “Only alert me on the higher-confidence pattern.”
4) Refined Colors + Widths
Color and width controls for Refined levels.
Recommended usage:
Keep Base slightly lighter/less prominent.
Make Refined more prominent so confirmations stand out.
5) Trend Context
Trend SMA length (default 62)
Shorter SMA = more sensitive trend context (more “below trend” flips).
Longer SMA = slower trend context (fewer flips, more stability).
Trend mode affects how some context cues render (for example, whether certain momentum markers appear in “below-trend” context).
6) Squeeze
Squeeze ON indicates compression conditions. The script plots a held anchor line during the ON run.
Per-bar render vs static
Per-bar render updates opacity per bar while squeeze is ON (based on your selected strength model).
Static render keeps the anchor appearance constant through the run.
Squeeze opacity model selection
Compression ratio : based on 1 − (BB width / KC width). Higher = tighter squeeze.
Z-score style : normalizes the BB/KC ratio over a lookback and maps extremes to opacity.
Duration boost : increases opacity with consecutive ON bars up to a cap.
Changing squeeze settings affects:
How early/late squeeze turns ON/OFF
How aggressively “tightness” is visually emphasized
How frequently bull/bear release alerts fire
7) Markers
OS/OB Start markers
Shows the first bar where an OS/OB segment begins (Base and/or Refined).
Useful for “N bars after start” logic and for validating what bar started a segment.
Alerts (built-in alertconditions)
Start alerts
OS Start (Any) — Base OR Refined start.
OB Start (Any) — Base OR Refined start.
Active line alerts (true while a line is plotted)
OS Active (Any line)
OB Active (Any line)
Price interaction alerts
OS Touch (Any)
OS Reclaim (Any) — close crosses above OS line
OS Bounce (Any) — low below OS line and close above
OS Breakdown (Any) — close crosses below OS line
OB Touch (Any)
OB Reject (Any) — price probes above/into OB and closes below
OB Breakout (Any) — close crosses above OB line
OB Breakdown (Any)
Within N bars after start alerts
Uses the setting: Within N bars after start (default 5).
OS Reclaim within N bars
OS Bounce within N bars
OS Breakdown within N bars
OB Reject within N bars
OB Breakout within N bars
OB Breakdown within N bars
Hold/Confirm alerts
OS Hold/Confirm (N closes above) — first bar where close stayed above OS for N consecutive bars.
OB Hold/Confirm (N closes below) — first bar where close stayed below OB for N consecutive bars.
SQZ lifecycle alerts
SQZ Start
SQZ Release
SQZ Bull Release — release bar close > SQZ anchor
SQZ Bear Release — release bar close < SQZ anchor
Suggested workflows
Bottom / bounce workflow
Watch: OS Start (Any) or OS Touch (Any)
Confirm: OS Reclaim within N bars + OS Hold/Confirm
Context: SQZ ON and/or SQZ Bull Release to time expansion
Top / rejection workflow
Watch: OB Start (Any) or OB Touch (Any)
Confirm: OB Reject within N bars (or OB Breakdown)
Context: SQZ Bear Release to time expansion lower
Notes
“Active line” alerts will be true on every bar while the line is present. For one-shot alerts, prefer the Start or Within-N-bar alerts.
If you change trend, slope, or squeeze parameters compared to a framework strategy script, you should expect differences in marker density and background behavior. The signal is highly parameter-dependent.
“Oversold/Overbought” levels are currently hardcoded, future version will open up configuration settings.

Gold Sniper V21 + ATR (SMART FILTER)This is the Indicator to combine my Gold Sniper V21 + ATR Filter
How to use the Indicator :
- Recommend to use in M30 Chart.
- Very simple just follow the BUY/SELL Signal once appear. This indicator I try to filter as much as I can for the fake signal.
- Feel free to comment if you found any need to improve

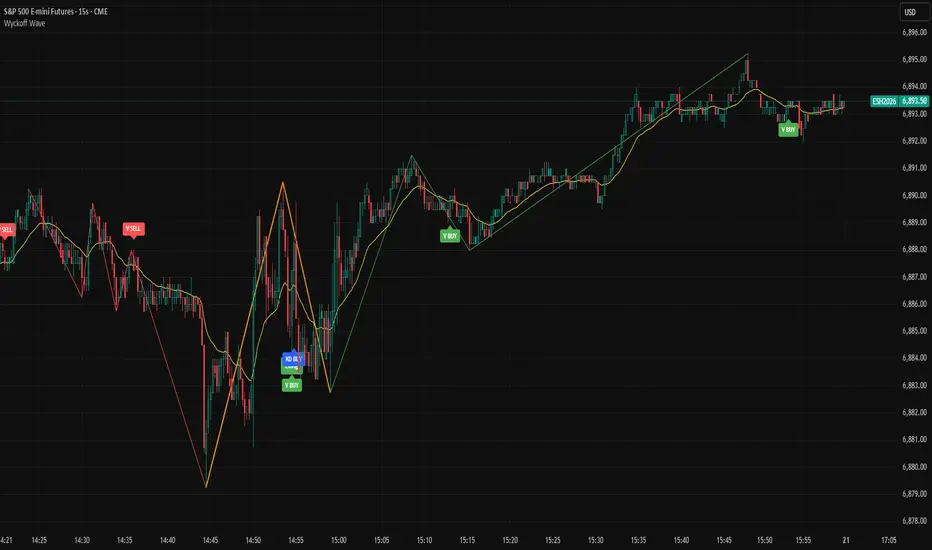
Wyckoff Dual Wave1. Indicator Overview
This Pine Script v5 indicator is built for TradingView, based on Wyckoff Theory. It runs in overlay mode on price charts, featuring dual-wave monitoring for short-term small waves and medium-term large waves. It generates trading signals by combining moving averages, volume analysis, double top/bottom patterns, and KD stochastic indicators. The indicator is suitable for short-term and scalping trading, and can be applied to time frames such as 15 seconds, 1 minute, 3 minutes, and 5 minutes to capture price fluctuations while filtering false signals. It should be noted that the default parameters of this indicator are preset for the 15-second time frame.
2. Some of my thoughts
Wyckoff Wave focuses on dynamic analysis. We need to observe the contest for wave highs and lows. Cumulative trading volume, average volume, and the maximum volume at highs and lows are all helpful for analysis. For the sake of simple and convenient comparison, I only use cumulative trading volume.
For wave analysis, it is necessary for us to refer to the trend of larger time frames. That’s why I use two levels of waves. Instead of adopting specific time frames, I choose large moving averages because, from a certain perspective, large moving averages represent the time frame corresponding to the moving average itself—even more reliably.
3. Input Parameters Explanation
3.1 Core Wave Parameters
Small Wave MA: Default value 50. This is the EMA period used as the base for small wave analysis to define short-term trend boundaries.
Signal MA: Default value 20. This fast EMA is used for double top/bottom signal validation and price crossover detection.
Large Wave MA: Default value 200. This is the EMA period used as the base for large wave analysis to define medium-to-long-term trend boundaries.
PCT Factor: Default value 2.0. This is the ATR multiplier threshold for small wave reversal, controlling the sensitivity of short-term trend changes.
Wave PCT Min: Default value 0.03. This is the minimum price fluctuation percentage required to confirm a valid small wave, filtering minor price movements.
Large Wave PCT Factor: Default value 4.0. This is the ATR multiplier threshold for large wave reversal, controlling the sensitivity of medium-to-long-term trend changes.
Large Wave PCT Min: Default value 0.08. This is the minimum price fluctuation percentage required to confirm a valid large wave, filtering insignificant long-term price swings .
Large Wave Min Bars Distance: Default value 5. This is the minimum number of bars required between pivot highs and lows of large waves, preventing interference from adjacent pivot points.
Min Bars Distance Between Highs/Lows: Default value 3. This is the minimum number of bars required between pivot highs and lows of small waves, filtering dense and invalid pivot points.
3.2 Display Toggle Parameters
Show Large Wave Lines: Default value true. Enables or disables the display of large wave trend lines on the chart.
Show Small Wave MA: Default value false. Toggles the visibility of the small wave base EMA on the chart.
Show Large Wave MA: Default value false. Toggles the visibility of the large wave base EMA on the chart.
Show Signal MA: Default value true. Toggles the visibility of the signal EMA on the chart.
Show Wave: Default value true. Enables or disables the display of small wave trend lines on the chart.
Show Vol: Default value false. Toggles the visibility of volume data and volume labels on the chart.
3.3 Volume Related Parameters
Vol Divisor: Default value 100. This divisor reduces volume values for clearer label display on the chart.
Vol Dist: Default value 2.0. This controls the vertical distance between volume labels and price bars to avoid overlapping.
Vol History Limit: Default value 200. This sets the maximum number of historical volume labels to retain, preventing chart clutter.
3.4 Trend Confirmation Parameters
Trend Confirmation Type: Default value 3-Day Breakaway. It offers three options for trend confirmation rules: Original Rules confirms the trend immediately after a price break; Close Confirmation requires a closing price beyond the pivot point to confirm the trend; 3-Day Breakaway requires three consecutive closing prices beyond the pivot point to validate the trend.
3.5 Signal Display Parameters
Show Long Signals: Default value true. Enables or disables the display of long trading signals on the chart.
Show Short Signals: Default value true. Enables or disables the display of short trading signals on the chart.
Enable Volume Compare Long Signals: Default value true. Triggers additional long signals when pullback volume is lower than the volume of the prior rally phase.
Enable Volume Compare Short Signals: Default value true. Triggers additional short signals when rally volume is lower than the volume of the prior decline phase.
Enable KD Signals: Default value true. Enables or disables trading signals generated by the KD stochastic indicator.
3.6 Pattern Recognition Parameters
Double Pattern ATR Multiplier: Default value 0.0, range from -5.0 to 5.0 with step 0.1. This ATR multiplier is used to calculate the threshold for double top/bottom pattern validation, adjusting the strictness of pattern recognition.
3.7 KD Stochastic Parameters
KD %K Length: Default value 14, minimum 1. This is the calculation period for the %K line of the KD indicator.
KD %K Smoothing: Default value 3, minimum 1. This is the smoothing period for the %K line of the KD indicator.
KD %D Smoothing: Default value 3, minimum 1. This is the calculation period for the %D line of the KD indicator.
KD Overbought Level: Default value 80, range from 50 to 100. This sets the overbought threshold for the KD indicator; values above this level suggest potential short opportunities.
KD Oversold Level: Default value 20, range from 0 to 50. This sets the oversold threshold for the KD indicator; values below this level suggest potential long opportunities.
3.8 Color Customization Parameters
Up Trend Color: Default value green. This is the color used for small wave uptrend lines and related long signal labels.
Down Trend Color: Default value red. This is the color used for small wave downtrend lines and related short signal labels.
Large Wave Up Color: Default value lime. This is the color used for large wave uptrend lines.
Large Wave Down Color: Default value orange. This is the color used for large wave downtrend lines.
4. How to Read Signals and Trade
4.1 Basic Trend Identification
Small Wave Trend: Identified by green (uptrend) or red (downtrend) lines on the chart. Follow small wave trends for short-term trades.
Large Wave Trend: Identified by lime (uptrend) or orange (downtrend) lines. Use large wave trends to filter trades—only take long signals in large uptrends and short signals in large downtrends for higher win rates.
4.2 Trading Signal Types and Usage
Basic Long/Short Signals
Long Signal: Displayed as "Long" label below the price bar. Triggered when price crosses above Signal MA in a small uptrend. Enter long positions on this signal.
Short Signal: Displayed as "Short" label above the price bar. Triggered when price crosses below Signal MA in a small downtrend. Enter short positions on this signal.
Pattern-Based Signals
Double Bottom Buy Signal: Displayed as "DB BUY" or "DBOT" label. Triggered when a double bottom pattern forms in an uptrend. This is a strong long signal—use it for high-confidence entries.
Double Top Short Signal: Displayed as "DT SELL" or "DTOP" label. Triggered when a double top pattern forms in a downtrend. This is a strong short signal.
Volume-Validated Signals
Volume Long Signal: Displayed as "V BUY" label. Triggered when pullback volume is lower than prior rally volume in an uptrend. This confirms buying pressure—use it to add to long positions.
Volume Short Signal: Displayed as "V SELL" label. Triggered when rally volume is lower than prior decline volume in a downtrend. This confirms selling pressure—use it to add to short positions.
KD Resonance Signals
KD Long Signal: Displayed as "KD BUY" label. Triggered when KD %K crosses above oversold level in an uptrend. Use it as a confirmation signal for long entries.
KD Short Signal: Displayed as "KD SELL" label. Triggered when KD %K crosses below overbought level in a downtrend. Use it as a confirmation signal for short entries.
4.3 Signal Filtering Rules (Reduce False Signals)
Trade with the large wave trend: Only take long signals when large wave is in uptrend; only take short signals when large wave is in downtrend.
Combine multiple signal types: Prioritize signals that have both pattern confirmation and volume validation (e.g., DB BUY + V BUY) for higher reliability.
Follow the trend confirmation type: Stick to your chosen trend confirmation rule to avoid premature entries.
5. Risk Management Tips
Do not rely on a single signal—always combine indicator signals with market context (e.g., news, support/resistance levels).
Adjust parameters based on your trading time frame and personal preferences.
Use stop-loss orders: Place stop-loss below the recent pivot low for long positions and above the recent pivot high for short positions to limit losses.
Control position sizes: Adjust position sizes according to your risk tolerance to avoid excessive losses from false signals.
Avoid overtrading: Only take signals that meet your predefined criteria to prevent unnecessary trades.
Market Exhaustion [WavesUnchained]Market Exhaustion
Multi-oscillator exhaustion detector combining MFI + optional CCI, HTF bias, StochRSI timing, and a divergence engine with an Exhaustion Score (0-100).
CORE CONCEPT
- Detects exhaustion via regular divergences anchored on price pivots
- Scores each divergence (0-100) using 5 components
- Line width = quality, color = direction (never thicker than main line)
OSCILLATOR MODES
- MFI : Engine uses MFI only
- CCI : Engine uses CCI mapped to 0-100
- MFI+CCI : Both plotted, engine source selectable (MFI or CCI)
EXHAUSTION SCORE (0-100)
1. Sequence (Div 1/2/3...) - repeated attempts increase score
2. Fatigue - no new oscillator extreme over lookback
3. Formation Time - bars between pivots
4. Reaction - post-divergence bounce/drop vs ATR
5. Impulse - MFI/CCI delta + swing size
DIVERGENCE ENGINE
- Price-pivot anchored (LL/HH) with osc confirmation (HL/LH)
- OS/OB gating with dynamic zones + fallback to 20/80
- Tolerant direction checks (price + osc eps)
- Auto cleanup (max objects)
HTF CONTEXT
- Auto-HTF MFI bias label
- Optional HTF filter for signals
- Bias bonus (optional) for Exhaustion Score
SIGNALS & TIMING
- StochRSI timing + MFI zone confirmation
- Context + timing signals (L/S markers)
- Zone confirm bars
VISUALIZATION
- Color-coded MFI line (OB/OS/neutral)
- Optional CCI (mapped 0-100) line
- Divergence line width = quality, endpoint markers
- Optional mid-label with score
- Dynamic zones + optional fill
BEST USE CASES
- Reversal scouting at extremes
- Filtering weak swings
- 15M-4H swing exhaustion reads
- HTF bias + divergence confluence
Version: 1.0.0
Author: WavesUnchained
Pine Script: v6

Williams %RDescription
This is a modified version of the classic Williams %R oscillator, adapted for markets with defined trading sessions (e.g., FTSEMIB, DAX, US stocks, etc.). It adjusts the lookback period based on the actual trading session length, making it more accurate on intraday timeframes.
Key Features
Session Adjustment:
Automatically scales the period to trading days (default: 8.5 hours for FTSEMIB, DAX, CAC; customizable for any market).
Formula (classic Williams %R):
%R = 100 × (Close - Highest High) / (Highest High - Lowest Low)
over a user-defined period (default 14 days).
Standard Levels:
-20 (overbought)
-50 (middle line)
-80 (oversold)
Visual Enhancements:
- Customizable colors for the line, levels, and background fill
- Shaded overbought/oversold zone
How to Use:
Overbought (above -20):
Potential sell signal or reversal (especially after a prolonged uptrend).
Oversold (below -80):
Potential buy signal or reversal (especially after a downtrend).
Divergences:
Look for bullish/bearish divergences between price and %R for early reversal warnings.
Best Markets:
Indices (FTSEMIB, DAX, SPX), stocks, futures. For 24/7 markets (crypto), set session duration to 24 hours.
Timeframes:
Works on intraday (15m, 1h, etc.) and daily charts.
Customization Tips:
- Adjust the period (shorter = more sensitive, longer = smoother).
- Change session duration for different markets.
- Customize colors to match your chart theme.
Note: Williams %R is a momentum oscillator and should be used in combination with other tools (trendlines, support/resistance, volume). Always practice proper risk management.

Ultimate Confluence Oscillator PROUltimate Confluence Oscillator PRO
Multi-indicator momentum confluence with real-time bias, divergence, and expansion detection — all in one oscillator.
Ultimate Confluence Oscillator PRO is a professional-grade momentum indicator that combines RSI, Stochastic, MACD, divergence analysis, and higher-timeframe context into a single, clean oscillator designed for fast, confident decision-making.
Built for crypto, forex, futures, and equities, it helps traders identify when momentum conditions are aligned and when the market is transitioning from compression into expansion.
🔍 What This Indicator Does
Combines RSI, Stochastic, and MACD into a unified confluence framework
Highlights momentum agreement and disagreement across indicators
Detects momentum divergence using both RSI and MACD
Identifies compression → expansion conditions
Incorporates higher-timeframe trend context for directional awareness
📌 Real-Time Momentum HUD (Built-In)
The indicator includes a locked, on-chart information panel that updates in real time:
Current RSI value
Current Stochastic value
Automatic market state classification
Bullish
Bearish
Neutral
This allows traders to instantly evaluate momentum at any candle without switching indicators or performing manual checks.
Hover → Read → Decide.
📈 Signals & Alerts
Confluence-based BUY / SELL markers
Custom alert conditions for:
Strong momentum confluence
RSI divergence
MACD divergence
Alerts are informational and designed to support — not replace — a trading plan.
⚙️ Key Features
Non-repainting logic
Works on all timeframes
Clean visuals optimized for fast decision-making
Fully adjustable inputs
Suitable for scalping, intraday, and swing trading
🎯 Best Use Cases
Momentum confirmation before entries
Filtering low-quality setups in choppy markets
Identifying early expansion after consolidation
Aligning lower-timeframe trades with broader momentum context
⚠️ Disclaimer
This indicator is a technical analysis tool and does not provide financial advice. Always use proper risk management and your own trading plan.

Black OPS Pro Edition (White Knight) v1.0Black OPS Pro Edition (White Knight) v1.0
Black OPS Pro Edition (White Knight) v1.0 is a professional-grade educational trading tool designed for trend analysis, volatility measurement, and intrabar signal detection. It combines ATR-based volatility tracking, Bollinger Bands, EMA bounces, and stochastic filtering to provide clear visual cues on market movements.
Features:
ATR & Volatility Analysis: Tracks market volatility and directional movement.
Bollinger Bands: Upper, lower, and midline bands with smoothing to identify breakouts and pullbacks.
Trend Detection: Automatically identifies bullish, bearish, and neutral trends.
EMA Bounces: Detects price interactions with multiple EMA levels (1- 200).
Stochastic Filter: Confirms trend signals and helps reduce false alerts.
Visual Signals: Up 🚀 and down 💥 arrows for trend flips, plus EMA bounce indicators ⚔️ 🕵️.
Dashboard: Displays current volatility and trend strength.
Background Coloring: Highlights bullish and bearish periods.
Screen-Fixed Disclaimer: Table at the bottom-right with a permanent educational disclaimer.
User Customization:
Adjust ATR length, volatility lookback, Bollinger Band parameters, EMA settings, and other thresholds to fit your trading style.
Disclaimer:
For educational purposes only. This script does NOT provide financial advice or guarantee profits. Users are fully responsible for their own trading decisions and risk management. Always perform your own analysis before making trades.

Composite Index [Auto Signals]Composite Index
Description (描述正文):
Overview This is an enhanced version of the famous Composite Index (CI) developed by Connie Brown. While the traditional RSI is confined between 0 and 100, often masking true momentum in strong trends, the Composite Index is uncapped and incorporates a momentum component to reveal the market's true structural strength.
I have engineered this script to include Automated Signal Markers based on the crossover of the Composite Index and its Slow Moving Average. This helps traders instantly identify momentum shifts and "Timing" entries/exits without manual guesswork.
Key Features
Uncapped Momentum: Unlike RSI, the CI can go anywhere, preventing the "flattening" effect seen in strong trending markets (e.g., TSLA, NVDA).
Automated Signals:
▲ Green Triangle (Launch): Triggers when the Gray CI line crosses ABOVE the Red Slow MA. This indicates bearish momentum is exhausted and bulls are regaining control.
▼ Red Triangle (Warning): Triggers when the Gray CI line crosses BELOW the Red Slow MA. This indicates bullish momentum is failing, serving as an early warning for exits or tightening stops.
Classic Formula: Uses the standard Connie Brown parameters (14, 9, 3) + SMA smoothing for reliable divergence detection.
How to Use This Indicator This script is best used as a companion to trend indicators like TTM Squeeze or Moving Average Ribbons.
For Entries (The "Dip Buy"): In an uptrend, wait for a pullback. When the Green Triangle (▲) appears, it confirms that the pullback is over and momentum has turned back up.
For Exits (The "Top"): Look for Divergence. If Price makes a Higher High but the Composite Index makes a Lower High—followed by a Red Triangle (▼)—this is a high-probability sell signal.
The "Slow MA" Filter: The signals are generated only when the CI crosses the Slow MA (Red Line). This filters out the noise of minor fluctuations (crossing the Green line) and focuses on significant momentum changes.
Settings
RSI Period: 14 (Default)
Momentum Period: 9 (Default)
Signal Logic: Crossover/Crossunder of the Slow MA (33 Period).
Disclaimer This tool is for educational purposes only. Always combine momentum signals with price action and structure analysis.

Mini RSI+STOCH-RSI+RSI-DIVERGENCE @Marx_CapitalMini version of RSI + STOCHASTIC-RSI with RSI-Divergence detection - all in one, adjustable small table overlayed on your chart. The table box gives RSI and Stoch-RSI values and signals detected RSI divergences.
Uncheck 'Update only on bar close' in indicator settings if the box does not appear right away.

RSI + STOCH RSI - Marx_CapitalSimple RSI + STOCH RSI indicator in one pane. In addition to the standard 30/70 and 20/80 RSI levels you have three adjustable levels (eg. 0, 50, 100) to indicate STOCH RSI overbought/oversold scenarios.


[SM-021] Gaussian Trend System [Optimized]This script is a comprehensive trend-following strategy centered around a Gaussian Channel. It is designed to capture significant market movements while filtering out noise during consolidation phases. This version (v2) introduces code optimizations using Pine Script v6 Arrays and a new Intraday Time Control feature.
1. Core Methodology & Math
The foundation of this strategy is the Gaussian Filter, originally conceptualized by @DonovanWall.
Gaussian Poles: Unlike standard moving averages (SMA/EMA), this filter uses "poles" (referencing signal processing logic) to reduce lag while maintaining smoothness.
Array Optimization: In this specific iteration, the f_pole function has been refactored to utilize Pine Script Arrays. This improves calculation efficiency and rendering speed compared to recursive variable calls, especially when calculating deep historical data.
Channel Logic: The strategy calculates a "Filtered True Range" to create High and Low bands around the main Gaussian line.
Long Entry: Price closes above the High Band.
Short Entry: Price closes below the Low Band.
2. Signal Filtering (Confluence)
To reduce false signals common in trend-following systems, the strategy employs a "confluence" approach using three additional layers:
Baseline Filter: A 200-period (customizable) EMA or SMA acts as a regime filter. Longs are only taken above the baseline; Shorts only below.
ADX Filter (Volatility): The Average Directional Index (ADX) is used to measure trend strength. If the ADX is below a user-defined threshold (default: 20), the market is considered "choppy," and new entries are blocked.
Momentum Check: A Stochastic RSI check ensures that momentum aligns with the breakout direction.
3. NEW: Intraday Session Filter
Per user requests, a time-based filter has been added to restrict trading activity to specific market sessions (e.g., the New York Open).
How it works: Users can toggle a checkbox to enable/disable the filter.
Configuration: You can define a specific time range (Default: 09:30 - 16:00) and a specific Timezone (Default: New York).
Logic: The strategy longCondition and shortCondition now check if the current bar's timestamp falls within this window. If outside the window, no new entries are generated, though existing trades are managed normally.
4. Risk Management
The strategy relies on volatility-based exits rather than fixed percentage stops:
ATR Stop Loss: A multiple of the Average True Range (ATR) is calculated at the moment of entry to set a dynamic Stop Loss.
ATR Take Profit: An optional Reward-to-Risk (RR) ratio can be set to place a Take Profit target relative to the Stop Loss distance.
Band Exit: If the trend reverses and price crosses the opposite band, the trade is closed immediately to prevent large drawdowns.
Credits & Attribution
Original Gaussian Logic: Developed by @DonovanWalll. This script utilizes his mathematical formula for the pole filters.
Strategy Wrapper & Array Refactor: Developed by @sebamarghella.
Community Request: The Intraday Session Filter was added to assist traders focusing on specific liquidity windows.
Disclaimer: This strategy is for educational purposes. Past performance is not indicative of future results. Please use the settings menu to adjust the Session Time and Risk parameters to fit your specific asset class.

Gold Sniper V21: M15 Holding MasterGold Sniper Entry (Follow Trend to enter)
My Indicator :
- Clarify the M30 in Up/Down Trend
- Only entry the trade in M1/M5 Timeframe to make a Sniper Entry.
- Indicator will show when to TP before the Trend Change

Rahul Prakash's BUY/SELL signal for momentum tradeBuy or Sell signal with just on one confirmation candle.
Show a Buy singal then wait for the confirmation candle, is a strong Buy signal.
Show a Sell singal then wait for the confirmation candle, is a strong Sell signal.
You can use as a free version and earn money. Please are taking lots of price for this type of indicator.

VCAI Stochastic RSI+VCAI Stoch RSI+ is a cleaned-up Stochastic RSI built with V-Core colours for faster, clearer momentum reads and more reliable OB/OS signals.
What it shows:
Purple %K line → bearish momentum strengthening
Yellow %D line → bullish momentum building and smoothing
Soft purple/yellow background bands → OB/OS exhaustion zones, not just raw 80/20 triggers
Midline at 50 → balance point where momentum shifts between bull- and bear-side control
Optional HTF mode → run Stoch RSI from any timeframe while viewing it on your current chart
How to read it:
Both lines rising out of OS → early bullish shift; pullbacks that hold direction favour continuation
Both lines falling from OB → early bearish shift; bounces into the purple OB zone can become fade setups
Lines stacked and moving together → strong, cleaner momentum
Lines crossing repeatedly → low-conviction, choppy conditions
OB/OS shading highlights exhaustion so you focus on moves with context, not every 80/20 tick
Why it’s different:
Classic Stoch RSI is hyper-sensitive and mostly noise.
VCAI Stoch RSI+ applies V-Core’s colour-driven regime logic, controlled OB/OS shading, and optional HTF smoothing so you see momentum structure instead of clutter — making it easier to judge when momentum is genuinely shifting and when it’s just another wiggle.

DSS Bressert (Double Smoothed Stochastic) Mid point (H+L)/2Changed source to midpoint (High+Low)/2 instead of Close for a cleaner average.

Bli-Rik : Trend + HTF 34 + HTF RSI Rel + Stoch Filtersprovides you accurate buy and sell signals on 5 mins and 15 mins chart, mainly foe sensex

4x Stochastic Combo - %K only4x Stochastic Combo in one indicator.
Default parameters: (9, 3, 3), (14, 3, 3), (40, 4, 4), (60, 10, 10)
Only %K is shown.
Possibility to set alerts "all above 80" or "all below 20".
How to use:
Look for divergence after getting an alert for good quality signals. Connect the stochastic signals with multi-timeframe analysis.


REMS - Deep SynergyThis is a more flexible version of the REMS Synergy indicator. Like other indicators in the REMS family, it builds upon the foundations assessing the relationships between RSI, EMAs, MACDs, and Stochastic RSI across multiple timeframes. Designed to help traders identify less frequent, but high probability entries across 2 time frames. Uses 3 levels of confluence indicators for both long and short moves.
Features 3 levels of confluence across 2 timeframes. All 3 levels allow filtering of any combination of REMS filters. Features more options and customization than previous REMS Synergy.
Includes VWAP and 4 EMAs as optional visual representations.
Includes 'Enhanced Candles' than can colour code candlesticks for better visual identification. (off by default)
Originally designed with 5 minute and 2 minute timeframes in mind, and pairs well with REMS First Strike and/or REMS Snap Shot indicators.
This version features no hard-coded inputs and allows for more freedom than previous version. With the added flexibility comes the ability for the indicator to be more easily stacked.
