FVG Heatmap [Hash Capital Research]FVG Map
FVG Map is a visual Fair Value Gap (FVG) mapping tool built to make displacement imbalances easy to see and manage in real time. It detects 3-candle FVG zones, plots them as clean heatmap boxes, tracks partial mitigation (how much of the zone has been filled), and summarizes recent “fill speed” behavior in a small regime dashboard.
This is an indicator (not a strategy). It does not place trades and it does not publish performance claims. It is a market-structure visualization tool intended to support discretionary or systematic workflows.
What this script detects
Bullish FVG (gap below price)
A bullish FVG is detected when the candle from two bars ago has a high below the current candle’s low.
The zone spans from that prior high up to the current low.
Bearish FVG (gap above price)
A bearish FVG is detected when the candle from two bars ago has a low above the current candle’s high.
The zone spans from the current high up to that prior low.
What makes it useful
Heatmap zones (clean, readable FVG boxes)
Bullish zones plot below price. Bearish zones plot above price.
Partial fill tracking (mitigation progress)
As price trades back into a zone, the script visually shows how much of the zone has been filled.
Mitigation modes (your definition of “filled”)
• Full Fill: price fully trades through the zone
• 50% Fill: price reaches the midpoint of the zone
• First Touch: price touches the zone one time
Optional auto-cleanup
Optionally remove zones once they’re mitigated to keep the chart clean.
Fill-Speed Regime Dashboard
When zones get mitigated, the script records how many bars it took to fill and summarizes the recent environment:
• Average fill time
• Median fill time
• % fast fills vs % slow fills
• Regime label: choppy/mean-revert, trending/displacement, or mixed
How to use
Use FVG zones as structure, not guaranteed signals.
• Bullish zones are often watched as potential support on pullbacks.
• Bearish zones are often watched as potential resistance on rallies.
The fill-speed dashboard helps provide context: fast fills tend to appear in more rotational conditions, while slow fills tend to appear in stronger trend/displacement conditions.
Alerts
Bullish FVG Created
Bearish FVG Created
Notes
FVGs are not guaranteed reversal points. Fill-speed/regime is descriptive of recent behavior and should be treated as context, not prediction. On realtime candles, visuals may update as the bar forms.
Structure

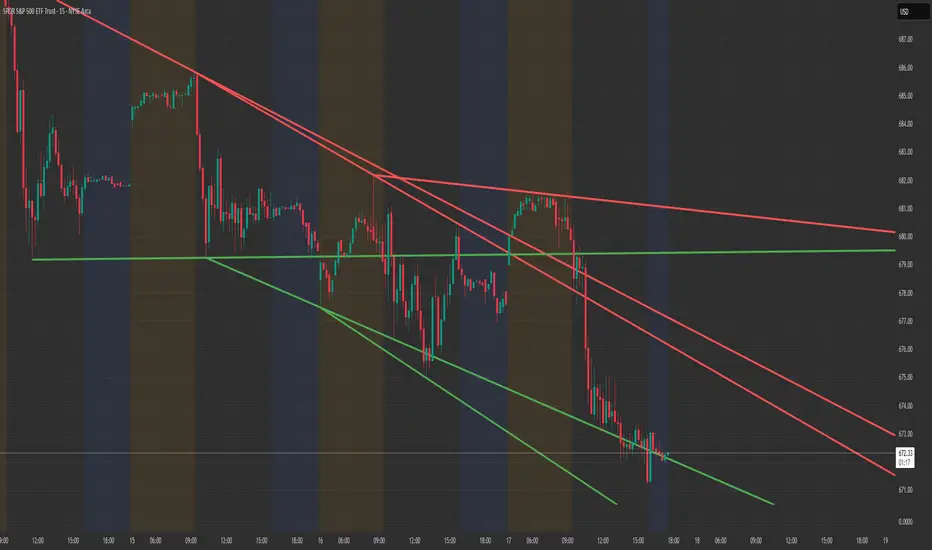
Structure Lite - Automatic Major Trend LinesStructure Lite — Automatic Major Trend Lines
Structure Lite automatically detects and plots major market structure using higher-timeframe pivot highs and lows.
It is designed to provide a clean, lightweight view of primary support and resistance without manual drawing or chart clutter.
This script focuses only on major structure and intentionally excludes short-term noise, advanced liquidity concepts, or signal logic.
Features
Automatically plots major resistance (red) and major support (green) trend lines
Uses higher-period pivots to reflect macro / swing structure
Lines extend right for forward projection
Keeps only the most recent major levels to reduce clutter
Optional toggle to hide all trend lines for a clean chart view
How to Use
Add the indicator to your chart
Adjust Major Pivot Period to control how swing-based the structure is
Higher values = fewer, more important levels
Lower values = more responsive structure
Use the plotted lines to:
Identify higher-timeframe support and resistance
Contextualize price action and trend bias
Toggle Hide All Trend Lines to quickly remove structure without removing the indicator
This tool is intended for context and structure awareness, not trade signals.
Design Philosophy
Structure Lite is intentionally minimal:
No alerts
No buy/sell signals
No predictions
No performance claims
It is built as a foundational structure tool that can be combined with the user’s own methodology.
Notes
Some inputs reference advanced features available in a separate professional version
These options are disabled here and included only for interface consistency
No external links, promotions, or monetization are included in this script
Disclaimer
Educational and informational purposes only.
This script does not provide financial advice or trade recommendations.
Past market behavior does not guarantee future results.
© 2025 GammaBulldog
RF True Structure Engine PROD. V1RF True Structure Engine V1 is a fractal–based market structure indicator that identifies the current active swing leg and bias in real time. It automatically tracks Strong/Weak Highs and Lows, marks MSS (Market Structure Shifts) and BOS (Breaks of Structure) using candle-close confirmation, and plots clean right-side structure levels with an optional midline for quick leg context.
It also includes an optional HTF structure overlay and a compact multi-timeframe bias table (up to 5 timeframes) so you can instantly see whether higher/lower timeframes are bullish or bearish.
Built for clarity and consistency — structure first, noise filtered out.

Ladang_Cuan - [pip.squad]Ladang_Cuan - is an intelligent price mapping system designed to detect Market Structure automatically and with high precision. This indicator eliminates trader confusion in determining entry points by presenting execution zones that are clean, objective, and measurable.
Developed by , this tool works behind the scenes with complex algorithms to filter out price fluctuations, leaving only the crucial levels with high winning probabilities.
The Intelligence Behind the System
Dynamic Structure Mapping: The system automatically maps the market's highest and lowest points to determine the current trend direction without manual intervention.
Intuitive Navigation Labels: No more confusing numbers. Every line has a specific role: from preparation zones and execution points to final targets.
Area Synergy (The Cloud): Colored area visualizations provide instant visual guidance on where price is currently positioned within its movement cycle.
Advanced Entry Trigger: Integrated signal logic ensures you only enter the market when the price is in the most optimal area to minimize risk.
Mastering the Strategy: The Way
This strategy focuses on Trend Following & Rejection, where we hunt for profits when the price undergoes a rest phase (correction) before continuing its primary trend.
1. Identifying the Setup
Observe how the indicator maps the price structure on your chart. These lines are not static; they are a representation of current market psychology.
2. The Golden Zone (Entry Ideal)
This is our "Cuan Field" (Profit Field). Ignore all price movements until it enters the Entry Ideal area.
BUY Signal: Appears when the market is in a bullish structure and the price makes a downward correction into the green zone. This represents the best accumulation momentum.
SELL Signal: Appears when the market is in a bearish structure and the price makes an upward correction into the red zone. This represents the best distribution momentum.
3. Harvesting the Profit
Use a multi-target approach for maximum results:
TP 1 & TP 2: Take early profits to secure your capital.
TP 3: Let the remaining position run to reach the furthest target when the trend is strong.
Protection: STOP LOSS is your last line of defense. If price breaks this level, it means the market structure has shifted, and we exit to wait for the next opportunity.
Why Ladang_Cuan?
In the world of trading, objectivity is everything. Ladang_Cuan - gives you the confidence to execute the market based on real structural data, rather than instinct or emotion.

Trend Engine ProTrend Engine Pro — Index Trend & Market Structure Framework
Trend Engine Pro is an advanced, non-repainting market structure indicator designed for index traders who want clarity on trend direction, balance zones, and price behavior—not buy/sell noise.
Built specifically for NIFTY & BANKNIFTY, this tool helps traders stay aligned with the dominant market context using previous-day structure, dynamic trend logic, and equilibrium-based midlines.
What Trend Engine Pro Does
Trend Identification
Determines bullish or bearish bias using previous-day High / Low structure
Uses 78.6% range logic to confirm decisive trend shifts
Visual trend background for instant market context
Key Price Levels
Dynamic structure levels derived from previous sessions
Equilibrium reference level for balance vs imbalance zones
Helps identify acceptance, rejection, and compression areas
Previous Trend Zones
Automatically captures:
Previous uptrend high
Previous downtrend low
Useful for:
Support & resistance mapping
Mean reversion context
Risk planning reference
Master Trend Midline
Midpoint of the last completed trend range
Acts as a higher-timeframe directional filter
Helps avoid counter-trend bias
Running Trend Midline
Continuously updates during an active trend
Shows trend strength, balance, and momentum health
Ideal for pullback & continuation evaluation
Option Context (Index Only)
Optional option seller reference level derived from structure extremes
Rounded strike logic for planning context
For analytical reference only, not trade execution
Optional Option P/L Table
Manual option & hedge symbol selection
Displays:
Entry price
Live price
Running P/L
Max trade P/L with timestamp
Disabled by default
Alerts Included
Bullish trend shift alert
Bearish trend shift alert
(Alerts are informational and based on confirmed structure changes)
Who This Indicator Is For
NIFTY & BANKNIFTY traders
Intraday & positional traders
Option sellers seeking market context
Traders who prefer structure over signals
Users who value non-repainting logic
What Trend Engine Pro Does NOT Do
No buy/sell signals
No automated trading
No profit guarantees
No repainting
Disclaimer
This indicator is for educational and analytical purposes only.
It does not provide trading or investment advice.
I am not a SEBI registered investment advisor.
Trading involves risk. Use this tool at your own discretion.
Best Usage Tip
Trend Engine Pro works best when used to:
Align trades with dominant trend
Avoid trades near equilibrium zones
Combine with your own entry and risk management logic

MWTI Introduction onChartMarket Wave TransIndex (MWTI)
Colors show when to attack and when to rest.
• Background = current market wave
• Masked zones = low momentum (rest)
• Upper dots = higher timeframe bias
No symbols, no predictions.
Just read the market state.
Works on any market, any timeframe.
Introduction (sample) is optimized for the 15m chart.
Try it on any market in 15m.
-------------------------------------------------------

IVX: Institutional Velocity X-Ray [Ash_TheTrader]The Intrabar Liquidity X-Ray: Seeing Institutional Speed Inside the Candle ⚡🐢
Stop getting trapped by standard candlesticks. It’s time to see how fast the money is actually moving.
A standard candlestick tells you four things: Open, High, Low, and Close. It’s the foundation of technical analysis.
But it hides the most important metric of all: Speed.
Two bullish 1-Hour candles can look identical on your chart. Both opened at $100 and closed at $105.
Candle A hit $105 in the first 5 minutes, then spent 55 minutes holding that level.
Candle B ground slowly upwards, finally hitting $105 in the 59th minute.
To a standard indicator, these candles are the same. To a professional trader, they are opposites. One shows aggressive, front-loaded institutional buying; the other shows weak, exhausted retail grinding.
As @Ash_TheTrader, I developed the Intrabar Liquidity X-Ray to solve this problem. It stops looking at the surface of the candle and looks inside it.
🧠 The Concept: Time-To-Form
This indicator uses advanced Pine Script technology to conduct an "X-Ray" scan of the bar you are looking at.
If you are on a 1-Hour chart, the script uses request.security_lower_tf to fetch the data of the 60 individual 1-minute bars hidden inside that single hour bar.
It then asks a critical question: How long did it take for this candle to achieve its ultimate High or Low?
In a Bullish candle, we measure the time it took to hit the specific minute of the bar's High.
In a Bearish candle, we measure the time it took to hit the specific minute of the bar's Low.
By measuring this "Time-To-Form," we can classify the intent behind the move.
⚡ The "Fast" Candle (Institutional Aggression)
When smart money wants to move an asset, they don't wait all day. They execute large block orders that move price rapidly to their desired level, and then they defend it.
The Signal: The indicator identifies a bar as "Fast" if it hits its High (for bulls) or Low (for bears) in the first 20% of the candle's duration.
The Visual: The bar turns Neon Cyan and is marked with a lightning bolt ⚡.
Interpretation by @Ash_TheTrader: This is urgent liquidity. Institutions are front-loading their orders. These levels are often strong zones of support or resistance on retests because the big players showed their hand early.
🐢 The "Slow" Candle (Retail Grind)
Conversely, when a move is driven by retail traders chasing price, or when a trend is exhausted, price struggles to make new extremes. It grinds slowly, taking the entire duration of the candle just to inch slightly higher or lower.
The Signal: The indicator identifies a bar as "Slow" if it takes more than 80% of the candle's duration to finally reach its High or Low.
The Visual: The bar turns Orange and is marked with a turtle 🐢 beneath it.
Interpretation by @Ash_TheTrader: This is "weak" movement. Even if the candle is green, if it took 58 minutes of a 60-minute bar just to make a new high, the buyers are exhausted. Be wary of reversals after seeing a cluster of 🐢 candles.
💻 Features and The Dashboard
To make this data actionable in real-time, I have engineered a clean Heads-Up Display (HUD) directly on the chart.
The On-Chart Dashboard: Located in the top right, the dashboard gives you the live stats of the current forming bar. It tells you exactly what percentage of the time has passed and whether the current structure is considered Institutional ⚡ or a Retail Grind 🐢.
Other Features:
Dual Polarity Logic: Works seamlessly for both bullish trends (tracking speed to Highs) and bearish trends (tracking speed to Lows).
Smart Volume Filtering: The indicator automatically ignores insignificant low-volume "noise" bars, only highlighting speed on candles with above-average volume.
Full Alert Capability: Set alerts for "Fast ⚡" detections to catch sudden institutional activity as it happens.
⚙️ Best Practices for Using This Tool
Because this tool looks inside a bar, it is designed to be used on Higher Timeframes.
Recommended Timeframes: 30-Minute, 1-Hour, 4-Hour, or Daily charts.
Do Not Use On: 1-Minute or 5-Minute charts. (You cannot effectively "X-Ray" a 1-minute bar using 1-minute data; the math doesn't work).
A Final Note from @Ash_TheTrader
Trading is about information asymmetry. The market hides the most valuable data beneath the surface of the Open and Close. Use the Intrabar Liquidity X-Ray to stop guessing the speed of the market and start seeing it.
Trade safe, trade smart.⚡

Previous Day Week Month Highs & Lows [MHA Finverse]Previous Day Week Month Highs & Lows is a comprehensive multi-timeframe indicator that automatically plots previous period highs and lows across Daily, Weekly, Monthly, 4-Hour, and 8-Hour timeframes. Perfect for identifying key support and resistance levels that often act as magnets for price action.
How It Works
The indicator retrieves the highest high and lowest low from the previous completed period for each selected timeframe. Lines extend forward into current price action, allowing you to see when price approaches or breaks these critical levels in real-time. The indicator tracks the exact bar where each high and low occurred, ensuring accurate historical placement.
---
Key Features
Multi-Timeframe Levels:
• Current Daily, Previous Daily, 4H, 8H, Weekly, and Monthly highs/lows
• Fully customizable colors and line styles (Solid, Dashed, Dotted)
• Adjustable line width and extension length
Visual Enhancements:
• Price labels showing exact level values
• Range position percentage (distance from high/low)
• Optional period boxes highlighting timeframe ranges
• Day and date labels for reference
Trading Tools:
• Breakout markers when price crosses key levels
• Touch count tracking (how many times price tested each level)
• Time at level display (consolidation detection)
• Customizable thresholds for touch and time analysis
Alert System:
• Individual alerts for each timeframe: Daily High/Low Break, 4H High/Low Break, 8H High/Low Break, Weekly High/Low Break, Monthly High/Low Break
• Toggle switches to enable/disable alerts per timeframe
• Clear messages showing which level was broken and at what price
---
How to Use
Setup:
1. Enable your preferred timeframes in "Highs & Lows MTF" settings
2. Customize colors and styles to match your chart
3. Turn on visual features like price labels and range percentages
4. Set up alerts by creating specific alert conditions or using toggle switches
Trading Applications:
Breakout Trading: Watch for strong momentum when price breaks above previous highs or below previous lows
Support/Resistance: Use these levels as potential reversal points for entry/exit signals
Range Trading: Trade between previous highs and lows using the range position indicator
Stop Loss Placement: Place stops just beyond previous highs (shorts) or lows (longs)
Multiple Timeframe Confirmation: Combine timeframes for stronger signals (e.g., Daily near Weekly support)
---
Best Practices
• Use Weekly/Monthly for swing trading, Daily/4H/8H for day trading
• Combine with volume or momentum indicators for confirmation
• Multiple timeframe levels clustering together create high-probability zones
• The more touches a level has, the more significant it becomes
---
Disclaimer
This indicator is a technical analysis tool for identifying price levels based on historical data. It does not guarantee profits or predict future movements. Trading involves substantial risk. Always use proper risk management and never risk more than you can afford to lose.

Structure Breakout - Buy Sell IndicatorStructure Breakout - Buy Sell Indicator
📈 OVERVIEW:
A minimalist indicator that identifies market structure breakouts using swing point analysis.
Displays clear blue buy arrows and red sell arrows when price breaks key swing levels.
🔧 HOW IT WORKS:
1. Identifies swing highs and lows using configurable lookback period
2. Triggers BUY signal (blue arrow) when price closes above previous swing high
3. Triggers SELL signal (red arrow) when price closes below previous swing low
4. Uses clean visual arrows without cluttering the chart
⚙️ KEY FEATURES:
• Clean, uncluttered visual signals
• Customizable sensitivity period
• Blue arrows for buy signals (below bars)
• Red arrows for sell signals (above bars)
• No lagging repainting
• Works on all timeframes
🎯 TRADING APPLICATIONS:
• Swing trading entries
• Breakout confirmation
• Trend continuation signals
• Support/resistance breaks
⚡ SETTINGS:
• Structure Detection Period (default: 20) - Adjust sensitivity of swing detection
⚠️ RISK DISCLAIMER:
This is an educational tool. Always use proper risk management.
Past performance does not guarantee future results.

AI Probabilistic OrderFlow Scalper⭐ Description:
📌 AI Probabilistic OrderFlow Scalper
This script combines Order Flow, Auction Market Theory, Volume Imbalance, Market Structure (HH/LL), RSI bias filtering, and a probability-based direction model inspired by AI and statistics.
It produces high-precision scalping entries designed for fast markets such as Futures, while remaining compatible with all markets (indices, crypto, forex, metals).
This is not a typical indicator — it is a probabilistic predictive model engineered to provide sniper entries, a tick-based Take Profit, a volatility-adaptive ATR Stop Loss, and optional Value Area levels (VAH/VAL/POC).
⭐ Main Features:
🔥 Directional probability model (AI-style weighted scoring)
📊 Order Flow imbalance (delta-like logic)
📈 HH/LL market structure detection
🎯 Smart RSI bias filter
🚀 One signal per trend shift (anti-spam)
🎯 Tick-based Take Profit (perfect for NQ / futures)
🛡️ ATR-based dynamic Stop Loss
📉 Value Area display: VAH, VAL, POC
🔊 Volume confirmation filter
📡 Directional probability plot
✔️ Works for Futures, Crypto, Forex, Indices
🧠 Probabilistic AI Approach
The model uses a 3-factor scoring system:
Order Flow imbalance
Market structure (HH/LL)
RSI trend bias
Each validated condition = 1 point.
The total score is converted into Buy/Sell probabilities, and the higher-probability direction is selected.
When probability exceeds the threshold (e.g. 80%), the system triggers a high-confidence sniper signal.
This mirrors Revenue Management logic:
→ Only take a decision when probability of success is maximized.
🎯 Buy/Sell Signals (Sniper Entries)
🔵 Green triangle under the candle = high-probability Buy
🔴 Red triangle above the candle = high-probability Sell
✔️ Only one signal per directional shift
✔️ Signals appear only when all strict filters are satisfied
📌 Automatic TP / SL
TP: fixed tick-based (e.g. 100 ticks for NQ scalping)
SL: ATR-based, adapts to volatility
TP/SL display can be enabled or disabled
Perfectly calibrated for high-speed scalping.
📘 How to Use
Use on every timeframe
Adjust probability threshold (75–90 recommended)
Enable strict mode for maximum precision
Let the model filter entries automatically
Choose a TP suitable for your market
Optionally display VAH/VAL/POC for Auction Theory context
Always test using backtesting before going live
🏆 Advantages
Extremely fast for scalping
High win-rate potential via probabilistic filtering
Clean signals (no noise or spam)
Combines the strongest trading frameworks:
Order Flow
Market Structure
Statistical modeling
Volume profiling
Automated risk management

Session, Weekly, Daily LevelsScroll down for hungarian description!
Magyar leíráshoz görgess lejjebb!
Overview
This script provides a unified market structure mapping tool that automatically identifies and visualizes key intraday, daily, and weekly reference levels. It helps traders contextualize price action throughout the trading week by marking true session opens, previous day highs/lows, weekly highs/lows, and weekday opens, all with accurate historical anchoring and correct timezone handling.
What This Script Does
1. Intraday Session Opens (Tokyo, London, New York)
- Detects the exact candle where each session opens.
- Draws horizontal rays with labels.
- Automatically clears lines at the start of each new day.
- Uses a custom local-to-exchange timezone conversion system.
2. Weekly Levels
- Last week high and low (precise bar anchoring, not HTF aggregation)
- Current week open (also Monday open)
- Auto-reset on new week
- Levels are always drawn from the true candle where they formed.
3. Previous Day High & Low
- Continuously tracks intraday highs and lows.
- On a new day, stores yesterday’s values and anchors rays to the exact bars.
- Levels remain visible for the full current day and reset the next day.
4. Weekday Opens (Tue–Fri)
- Captures the exact opening price of Tuesday–Friday.
- Monday open = Week open, so it is not shown separately.
- Auto-reset on new week.
Timezone Logic (Original Feature)
The script converts:
local session times → exchange timezone → chart timestamps
It works correctly regardless of chart timezone or instrument exchange location.
Line Drawing Logic
- Finds the exact bar_index where each level forms.
- Draws rays extending to the right.
- Labels are placed ahead of price.
- Safe updating prevents “bar index too far” errors.
How to Use
- Identify daily/weekly structure.
- Track bias relative to session opens.
- Observe reactions around weekday opens.
- Compare price action to last week's range.
Originality
- Custom timezone conversion engine.
- True historical bar anchoring.
- Fully automated weekly/daily structural resets.
- Independent styling for each level type.
- Not a mashup; all components follow one unified logic.
Limitations
- Does not predict trend or direction.
- Structural tool only.
Summary
A precise and reliable market structure tool that unifies weekly, daily, and intraday reference levels with full timezone automation and true-candle anchoring.
MAGYAR LEÍRÁS
--------------
Áttekintés
Ez az indikátor egy összetett piaci szerkezet-feltérképező eszköz, amely automatikusan megjeleníti a legfontosabb intraday, napi és heti referenciaértékeket. A célja, hogy a kereskedő tisztán lássa a piac aktuális környezetét: hol nyíltak a főbb devizapiaci szekciók, hogyan alakult a tegnapi tartomány, hol volt a múlt heti csúcs/mélypont, és hogyan nyitottak az egyes hétköznapok.
Mit tud a script?
1. Szekciónyitások (Tokyo, London, New York)
- Megkeresi a pontos gyertyát, amely a szekciónyitáskori árat tartalmazza.
- Vízszintes vonalat és címkét rajzol.
- Minden nap elején automatikusan törli a korábbi nap szintjeit.
- Egyedi időzóna-konverziós rendszerrel működik (helyi idő → tőzsdei idő → chart idő).
2. Heti szintek
- Múlt heti maximum és minimum (pontos gyertyapontra horgonyozva)
- Aktuális heti nyitóár (egyben a hétfői nyitó is)
- Új hét kezdetekor automatikusan frissül.
- A múlt heti high/low nem fix időpontra, hanem a valódi gyertyára kerül.
3. Előző napi High és Low
- Folyamatosan követi a napi maximumot és minimumot.
- Napváltáskor elmenti és pontos gyertyáról indítja a ray-t.
- A szintek a teljes nap folyamán megmaradnak, majd a következő nap törlődnek.
4. Hétköznapok nyitóárai (Kedd–Péntek)
- A kedd, szerda, csütörtök és péntek nyitóárát rögzíti és megjeleníti.
- A hétfői nyitó a Week Open, ezért külön nem jelenik meg.
- Heti váltáskor automatikusan törlődnek.
Időzóna-kezelés (egyedi megoldás)
A script a felhasználó helyi idejét átszámítja az instrumentum tőzsdei időzónájára, majd a chartra vetíti.
Ez biztosítja, hogy minden szekciónyitás helyesen jelenik meg, bármely chart vagy instrumentum esetén.
Vonalrajzolási logika
- A szintek a valódi bar_index alapján kerülnek rögzítésre.
- Jobbra nyúló ray-eket rajzol.
- A címkék mindig a jobb oldalon, előre helyezve jelennek meg.
- Biztonságos frissítési rendszer akadályozza meg a hibákat (pl. “bar index too far”).
Használat
- Napi/heti szerkezet meghatározása.
- Bias követése a session openekhez viszonyítva.
- Reakciók figyelése a hétköznapok nyitóárai körül.
- Összevetés a múlt heti tartománnyal.
Eredetiség
- Egyedi időzóna-kezelő motor.
- Igazi gyertyapont-alapú horgonyzás.
- Automatikus napi/heti reset.
- Minden szint külön stílusban konfigurálható.
- Nem mashup; egységes rendszer.
Összegzés
Professzionális, pontos eszköz a piaci szerkezet feltérképezésére, amely egyesíti a heti, napi és intraday szinteket, teljes időzóna-automatizálással és gyertyapontra horgonyzott kijelölésekkel.

MTF Market Structure Pro [Elykia]MTF Market Structure Pro - Fractal Flow System
Overview
The MTF Market Structure Pro is a comprehensive trading system designed to decode the fractal nature of the markets.
Most traders fail because they focus on a single timeframe, missing the "Big Picture". This algorithm simultaneously maps market structure (Highs/Lows) across 3 distinct timeframes overlaid on your chart.
It automatically identifies trends, pivot points, and price inefficiencies (EPA/FVG), giving you an X-ray vision of institutional order flow.
💎 The Strategy: "Fractal Alignment"
This tool is optimized for the "Triple Sync" strategy. Never trade against the macro trend.
1. The Bias (Sequence C / TF3): Look at the highest structure (e.g., H4). If the markers are Green/Ascending (HH/HL), the flow is Bullish. Look for buys only.
2. The Retracement (Sequence B / TF2): On the intermediate timeframe (e.g., M15), wait for price to pull back into an inefficiency zone (dashed "EPA" lines) or test a previous structural level.
3. The Entry (Sequence A / TF1): This is your trigger (e.g., M1 or M5). Wait for the structure to realign with Sequence C.
Buy Signal: TF3 is Bullish + Price retraces + TF1 breaks structure to the upside (creating a new HH).
Key Features
⚡ Multi-Timeframe Analysis (3-Layer): Displays 3 independent structures (A, B, C) with distinct colors for instant readability.
📊 Smart Dashboard: A summary panel shows real-time Trend (Bull/Bear) and Market State (Balanced or Open Gap) for each Timeframe.
🎯 Inefficiency Lines (EPA): Automatically plots unvisited price zones (Imbalances) that act as magnets for price action.
⚙️ 100% Customizable: Choose your timeframes, colors, and dashboard position.
Settings Guide
Sequence A: Your execution timeframe (e.g., Current Chart or M5).
Sequence B: Your intraday trend (e.g., M15 or H1).
Sequence C: Your macro bias (e.g., H4 or Daily).
Tip: Ensure you use distinct colors for each sequence to keep the chart clean.
⚠️ DISCLAIMER
This indicator is a technical analysis support tool and does not constitute financial advice. Trading involves a risk of capital loss. Past performance does not guarantee future results.

Hash SupertrendHash Supertrend is a visually enhanced Supertrend-based indicator designed by Hash Capital Research, tuned specifically for crypto trend trading on Solana (SOL) and Bitcoin (BTC). It combines institutional-style color coding, an optional session time filter, and production-ready alerts for systematic and discretionary traders alike.
What This Indicator Is
Hash Supertrend is a trend-following volatility band indicator built on TradingView’s native ta.supertrend() function.
It’s optimized and visually styled for:
High-volatility crypto pairs (especially SOL/USDT, SOL/USD, BTC/USDT, BTC/USD)
Timeframes typically used by crypto traders (from 5m scalping to 4H swing and 1D trend following)
The script is an indicator, not a strategy:
It does not place trades or show backtest results.
It provides clear trend states, flips, and alerts that you can plug into your own execution stack or manual trading.
Key Features
✅ Tuned for Crypto (Solana & Bitcoin)
Parameters are chosen to respond well to the volatility profile of SOL and BTC, reducing noise while still catching strong moves.
✅ Non-repainting Supertrend Core
Uses TradingView’s built-in ta.supertrend — values may move intrabar as the bar forms, but once a bar closes, the historical line and signals do not repaint.
✅ Fluorescent Trend Visualization
Bright green for bullish phases
Bright red for bearish phases
Adaptive color intensity based on user setting
✅ Glow Layer & Trend Zones
Glow effect around the Supertrend line for instant visual recognition
Optional filled zones between price and line for “trend cloud” style visualization
✅ Time Filter (Session Control)
Option to only mark signals during specific hours for those wanting to integrate with webhooks
Designed for traders who avoid certain sessions (e.g., low-liquidity hours)
✅ Signal Dots & Alerts
Tiny green dots for bullish flips
Tiny red dots for bearish flips
Professional, preconfigured alerts for:
Long Entry
Short Entry
Any Trend Change
Filtered signals outside trading hours (for monitoring only)
The core logic is built on:
ATR Length (ATR Length) Default: 16
Lower values (7–10): more sensitive, more signals, more noise
Higher values (12–20): smoother, fewer but stronger trend signals
Factor (Factor) Default: 3.11
Lower values (1.5–2.5): tighter bands, earlier entries, higher whipsaws
Higher values (3.0–4.0+): wider bands, later entries, stronger trend confirmation
The indicator reads direction from ta.supertrend and classifies:
Bullish Trend: direction < 0
Bearish Trend: direction > 0
A trend flip happens when direction changes sign:
longSignal: Supertrend flips from above price to below price (bearish → bullish)
shortSignal: Supertrend flips from below price to above price (bullish → bearish)

ZynIQ Order Block Master Pro v2 - (Pro Plus Pack)Overview
ZynIQ Order Block Master Pro v2 identifies areas where price showed strong displacement and left behind significant zones of interest. It highlights potential reaction areas, continuation blocks and mitigation zones based on structural behaviour and directional flow.
Key Features
• Automatic detection of bullish and bearish order block zones
• Optional refinement filters for higher-quality zones
• Displacement-aware logic to reduce weak signals
• Optional mitigation markers when price revisits a zone
• Configurable sensitivity for different markets and timeframes
• Clean labels and minimal chart clutter
• Complements structure, liquidity and FVG tools
Use Cases
• Highlighting key reaction areas based on previous strong moves
• Tracking potential continuation or reversal zones
• Combining order blocks with BOS/CHOCH and liquidity mapping
• Building confluence with breakout or volume tools
Notes
This tool provides contextual price zones based on displacement and structural movement. It is not a standalone trading system. Use with your own confirmation and risk management.

ZynIQ Core Pro Suite v2 - (Pro Plus Pack)Overview
ZynIQ Breakout Core Pro Suite v2 is an advanced breakout engine designed to analyse compression, expansion and directional bias with high precision. It incorporates multi-factor filtering, adaptive volatility logic and refined breakout mapping to highlight moments where the market transitions from contraction to expansion.
Key Features
• Adaptive breakout zones with refined volatility filters
• Direction-aware breakout confirmation
• Optional multi-stage filtering for higher-quality expansions
• Pullback and continuation gating to reduce noise
• Integrated structure awareness for more reliable triggers
• Clean labels and minimal chart clutter
• Optimised for intraday, swing and high-volatility markets
Use Cases
• Identifying structurally significant breakout points
• Avoiding false expansions during low-volatility phases
• Combining breakout logic with trend, structure or volume tools
• Mapping expansion phases after compression builds
Notes
This tool provides structural and volatility-aware breakout context. It is not a complete trading system. Use with your own confirmation tools and risk management.

ZynIQ FVG Master Pro v2 - (Pro Pack)Overview
ZynIQ FVG Master v2 (Pro) identifies fair value gaps and highlights key imbalance zones within price action. It includes detection for standard and extended FVGs, optional mitigation logic and context filters to help traders understand where inefficiencies may be filled.
Key Features
• Detection of regular and extended FVGs
• Optional mitigation and fill markers
• Configurable minimum gap size and sensitivity
• Direction-aware colour coding
• Optional smart filtering to reduce low-quality gaps
• Clean visuals designed for intraday and swing analysis
• Can be used alongside structure and liquidity tools for confluence
Use Cases
• Identifying imbalance zones likely to be revisited
• Spotting high-probability mitigation areas
• Combining FVGs with BOS/CHOCH or liquidity sweeps
• Mapping context for continuation and reversal setups
Notes
This tool provides FVG and imbalance context. It is not a standalone trading system. Use with your preferred confirmation and risk management.

ZynIQ Liquidity Master Pro v2 - (Pro Pack)Overview
ZynIQ Liquidity Master v2 (Pro) identifies key liquidity pools and sweep zones using automated swing logic, equal-high/low detection and multi-level liquidity mapping. It provides a clear view of where liquidity may be resting above or below price, helping traders understand potential sweep or mitigation behaviour.
Key Features
• Automatic detection of EQH/EQL (equal highs/lows)
• Mapping of major swing liquidity zones
• Optional PDH/PDL (previous day high/low) and weekly levels
• Detection of potential liquidity sweep areas
• Clean labels for swing points and liquidity clusters
• Configurable sensitivity for different markets or timeframes
• Lightweight visuals with minimal clutter
Use Cases
• Identifying major liquidity pools above or below price
• Spotting potential sweep conditions before reversals
• Anchoring market structure or FVG tools with liquidity context
• Understanding where price may target during expansion moves
Notes
This tool identifies areas of resting liquidity based on swing and equal-high/low logic. It is not a standalone trading system. Use with your preferred confirmation and risk management.

ZynIQ Market Structure Master v2 - (Pro Pack)Overview
ZynIQ Market Structure Master v2 (Pro) maps structural shifts in price action using automated BOS/CHOCH detection, swing analysis and directional flow. It provides a clear view of when the market transitions between expansion, pullback and reversal phases.
Key Features
• Automated BOS (Break of Structure) and CHOCH detection
• Swing high/low mapping with optional filtering
• Directional flow logic for identifying trend vs reversal phases
• Optional EQ levels and mitigation markers
• Configurable structure sensitivity for different timeframes
• Clean labels and minimal clutter for fast interpretation
• Suitable for intraday and swing structure analysis
Use Cases
• Identifying key structural shifts in trend
• Spotting early reversal signals via CHOCH
• Assessing trend continuation vs distribution/accumulation
• Combining structure with liquidity, FVG or breakout tools
Notes
This tool provides structural context using break-of-structure and swing logic. It is not a trading system by itself. Use alongside your own confirmation and risk management.

ZynIQ Breakout Pro v2 - (Pro Pack)Overview
ZynIQ Breakout Pro v2 is an advanced breakout framework designed to identify high-quality expansion points from compression zones. It includes adaptive volatility filters, directional detection, optional confirmation logic and an integrated risk-mapping system for structured trade planning.
Key Features
• Adaptive breakout range detection with smart volatility filters
• Direction-aware breakout triggers
• Optional ADX or volatility conditions for confirmation
• Pullback gating to reduce low-quality continuation attempts
• Integrated Risk Helper for SL/TP structure
• Clean labels and minimal chart clutter
• Suitable for intraday and swing trading
Use Cases
• Identifying breakout moments with stronger confirmation
• Avoiding noise and clustering during choppy phases
• Structuring entries around expansion from compression
• Combining breakout signals with trend, momentum or volume tools
Notes
Breakout Pro v2 provides structural and volatility-aware breakout context. It is not a standalone trading system. Use with your own confirmation tools and risk management.

ZynIQ Trend Master V2 - (Pro Pack)Overview
ZynIQ Trend Master v2 (Pro) provides a structured, multi-layered approach to trend analysis. It combines volatility-aware trend detection, adaptive cloud colouring, and pullback signalling to help traders see trend strength, continuation phases and potential shift points with clarity.
Key Features
• Multi-profile trend modes (Scalping / Intraday / Swing)
• Adaptive trend cloud with colour transitions based on strength
• Volatility-aware pullback detection
• Optional HTF trend alignment
• Clean labels marking key transitions
• Configurable filters for smoothing and responsiveness
• Lightweight visuals for fast intraday charting
Use Cases
• Identifying conditions where trend strength is increasing or weakening
• Timing entries during pullbacks within a trend
• Aligning intraday and HTF directional bias
• Combining with breakout, volume or market structure tools for confirmation
Notes
This tool provides structured trend context and momentum flow. It is not a trading system on its own. Use with your preferred confirmation and risk management.

ZynIQ Premium/Discount Master v2 - (Lite Pack)Overview
ZynIQ Premium-Discount Master v2 (Lite) is a simplified tool designed to highlight premium/discount zones relative to short-term market structure. It helps traders see when price is stretched above or below fair value, using volatility-adjusted logic suitable for intraday and swing trading.
Key Features
• Automated premium/discount classification
• Volatility-aware thresholds for mild and strong stretch conditions
• Clear visual cues for overbought/oversold environments
• Direction-aware structure to complement trend and momentum tools
• Clean labels marking stretch transitions
• Lightweight visuals suitable for fast charting workflows
Use Cases
• Identifying premium and discount zones for entries or exits
• Assessing when price has deviated significantly from equilibrium
• Combining with breakout or VWAP tools for structured confluence
• Improving trade timing with stretch-based context
Notes
This tool provides premium/discount structure and stretch context. It is not a standalone trading system. Use it along with your own confirmation and risk management rules.

WaveLab GOLD Study**Description**
`WaveLab GOLD Study – Liquidity & Structure` is an educational chart study that visualizes market structure, liquidity context and confluence.
It is not a trading system and does not generate trade instructions or orders.
**Main Components**
* **Liquidity Engine** – Builds demand/supply-style boxes around strong breaks of structure, high-volume candles and optional FVG conditions.
When price revisits a strong box, the study can plot bar markers:
`B` below the bar for bullish context, `S` above the bar for bearish context.
* **Trend & LR / MTF Context** – Optional EMAs, Donchian, VWAP and a Linear Regression slope with simple angle classification (`strong up / flat / strong down`), plus multi-timeframe RSI to show broader directional background.
* **Price Action Layer** – Detects a small set of classic bar patterns (engulfing, hammer / shooting star, inside / outside bar) and summarizes them into a qualitative bias (bullish, bearish, inside, outside, neutral).
* **Dashboard** – Compact table that displays price, short-term momentum, trend state, PA status, liquidity context and the current B/S confluence marker.
**How to Use (Educational)**
1. Start from liquidity boxes to see where reactions cluster.
2. Add trend, LR and MTF context to understand whether price is moving with or against the broader environment.
3. Use B/S markers and the dashboard only as visual summaries to review bars and build a discretionary framework; they are not entry or exit signals.
**Disclaimer**
This script is for educational and illustrative purposes only.
It does not provide financial advice or recommendations, and any trading decisions remain entirely the user’s responsibility.

IMS 4H Structural Framework (MA / Pivot / MTF Levels)IMS 4H Structural Framework (MA / Pivot / MTF Levels)
✅ SHORT, COMPLIANT DESCRIPTION (Invite-Only Safe)
Description:
This tool visualizes a 4H Institutional Market Structure (IMS) framework by combining three workflow components into a single structural map—MA-based bias shifts, pivot-derived 4H trendlines, and multi-timeframe (1H/45m) structural levels.
It does not generate signals or performance claims.
The framework is designed purely for visual, discretionary analysis of structural flow, risk context, and higher-timeframe alignment.
Core Components:
• 4H Bias Shift (MA): Highlights directional bias transitions.
• 4H Trendlines (Pivot-Based): Shows structural slopes and reaction zones.
• MTF Levels (1H & 45m): Adds micro-structure inside the 4H box for refinement.
• Caution Zones: Marks potential reaction areas near support/resistance or trendlines.
• Dashboard: Displays bias context and educational guidance only.
Intended Use:
For traders who analyze 4H structural flow and wish to visualize bias, context, and multi-timeframe alignment—not for automation or signals.
________________________________________
✅ SHORT, SAFE DISCLAIMER (Invite-Only Approved)
Disclaimer:
This tool is for educational and informational purposes only.
It does not provide trading signals, financial advice, or performance guarantees.
All decisions remain solely with the user.
