NSDT Custom High and Low LinesFirst, the credit for the original script to plot a High and Low between a certain time goes to developer paaax.
I took that idea, converted it to Pinescript V5, cleaned up the code, and added a few more lines so you can plot different levels based on time of day.
Published open source like the original.
The example shown has:
Blue - plotting from the start of the Futures Asian session to the start of the Futures USA Session. (6:00PM - 9:30AM Eastern)
Yellow - plotting from the start of the Futures Europe session to the start of the Futures USA Session. (3:00AM - 9:30AM Eastern)
Green - plotting from the start of the Futures US Premarket session to the start of the Futures USA Session. (8:00AM - 9:30AM Eastern)
These are great levels to use for breakouts and/or support and resistance.
Combine these levels with the 5 min Open Range levels, as you have some good trades.
Each of the three sessions have individual start and end times that can be modified by the trader, so you can easily mark off important areas for your style of trading.
Support

Golden ZoneIntroducing the "Golden Zone" indicator, a powerful tool that simplifies the Fibonacci indicator by creating a clear Golden Zone to identify potential future price movements. The Golden Zone is a supply or demand zone that corresponds to the 61.8% and 50% Fibonacci retracement levels. These levels are important because they often mark zones where the price reacts, making it an essential area for traders to watch.
The script plots the Fibonacci levels in the background, enabling traders to identify potential support and resistance levels quickly. The Golden Zone is highlighted with a yellow filled area, making it easy to spot on the chart. Traders use this zone to identify areas where the stock price may react, either bouncing off the support level or encountering resistance at the resistance level.
For example, if a stock price is moving up and reaches the Golden Zone, a trader may look for signs of resistance and consider selling the stock if the price begins to move back down. Conversely, if a stock price is moving down and reaches the Golden Zone, a trader may look for signs of support and consider buying the stock if the price begins to move back up.
The "Golden Zone" indicator is highly versatile and can be used in all markets, whether you are a swing trader or a day trader. It can be combined with other strategies, such as an EMA crossover strategy or price action, or as an area of confluence.
In summary, the "Golden Zone" indicator is a must-have tool for traders looking to identify potential price movements and locate key support and resistance levels. Its user-friendly inputs and clear display make it a valuable addition to any trading arsenal.
So, the "Golden Zone" indicator is like a magic tool that helps people who trade in the stock market find valuable things to buy or sell. And with its ability to identify key support and resistance levels, it can help traders make better-informed decisions when buying or selling stocks.
I hope you like it!
Volume Profile Matrix [LuxAlgo]The Volume Profile Matrix indicator extends from regular volume profiles by also considering calculation intervals within the calculation window rather than only dividing the calculation window in rows.
Note that this indicator is subject to repainting & back-painting, however, treating the indicator as a tool for identifying frequent points of interest can still be very useful.
🔶 SETTINGS
Lookback: Number of most recent bars used to calculate the indicator.
Columns: Number of columns (intervals) used to calculate the volume profile matrix.
Rows: Number of rows (intervals) used to calculate the volume profile matrix.
🔶 USAGE
The Volume Profile Matrix indicator can be used to obtain more information regarding liquidity on specific time intervals. Instead of simply dividing the calculation window into equidistant rows, the calculation is done through a grid.
Grid cells with trading activity occurring inside them are colored. More activity is highlighted through a gradient and by default, cells with a color that are closer to red indicate that more trading activity took place within that cell. The cell with the highest amount of trading activity is always highlighted in yellow.
Each interval (column) includes a point of control which highlights an estimate of the price level with the highest traded volume on that interval. The level with the highest traded volume of the overall grid is extended to the most recent bar.

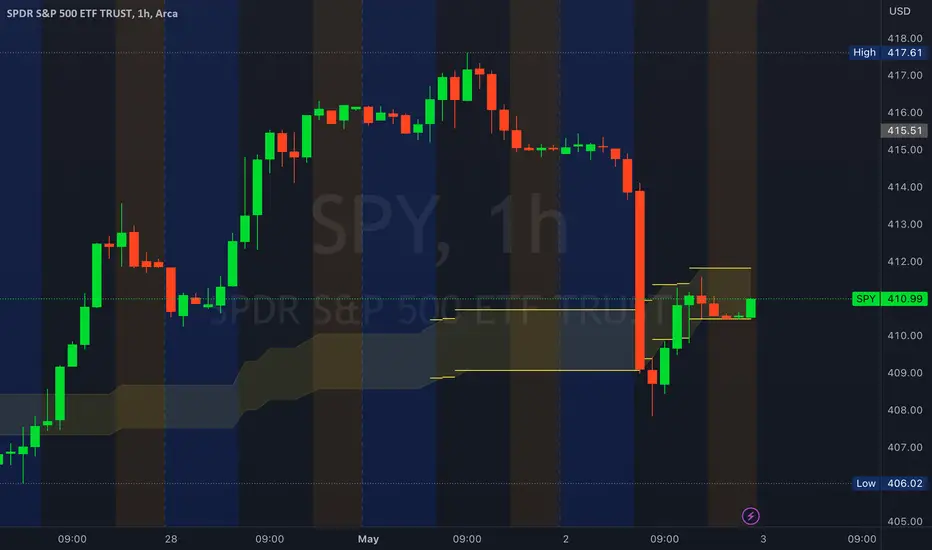
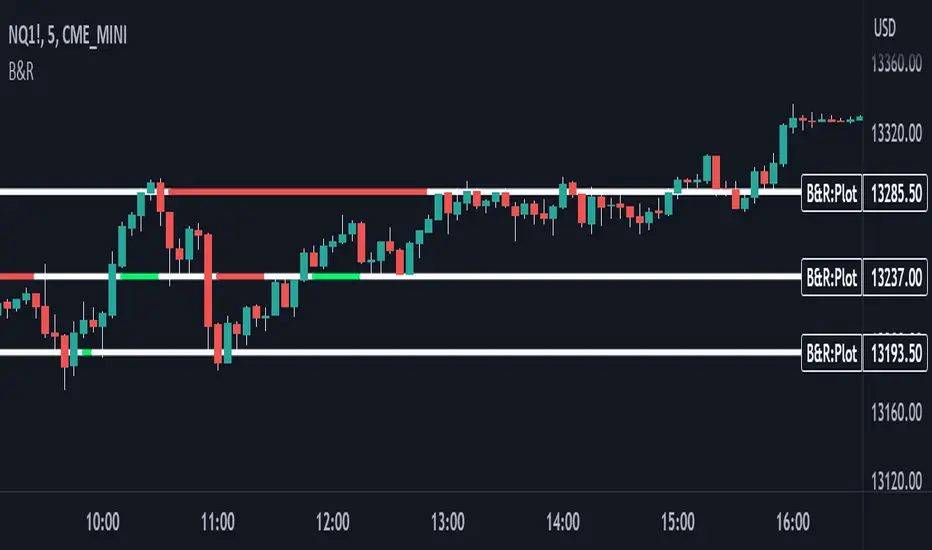
Support & Resistance With Breakout & RetestIntro
The Breakout Retest Indicator is a valuable tool utilized to confirm the occurrence of a proper breakout so you know when to enter on a retest. It analyses the price movement of an asset and identifies a breakout when the price level surpasses the inputted support and resistance values.
Conditions
The indicator operates based on simple yet reliable conditions. Once a candle closes above or below the specified line, the next candle's closure above or below without touching the high or low levels confirms the breakout. The indicator subsequently changes its color, signaling a long or short position. Upon retesting, it reverts to its original color.
Need Your Help
I am sharing this indicator to solicit your input in improving it. As a committed developer, I have ambitious plans for enhancing the indicator's functionality. To that end, I welcome your suggestions and ideas to build indicators that can contribute to the success of people's strategies.
Future Ideas
Some of the potential improvements that I plan to incorporate include the implementation of zones. Users will be able to define zones that require breaking above or below for a confirmed breakout. Additionally, a volume check will provide additional confirmation by evaluating the volume level relative to the breakout. Lastly, close above or below feature will ensure that a certain number of ticks, percentage, or price level has been breached to confirm the breakout.
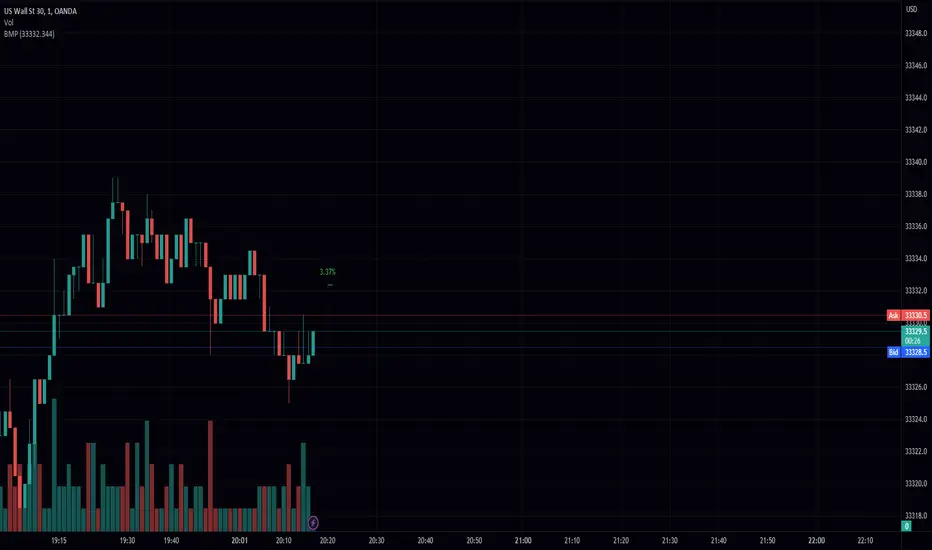
Bar Move Probability (BMP)Hello fellow traders! I am excited to share with you my latest creation, the Bar Move Probability (BMP) indicator. This powerful tool is designed to give you a statistical edge in your trading by helping you understand the likelihood of price movements based on historical data. In this blog post, I'll give you an overview of the indicator, its features, and how it can help you make more informed trading decisions. Let's dive in!
What is the Bar Move Probability Indicator?
The Bar Move Probability (BMP) indicator is a unique tool that calculates the probability of a bar's price movement, either up or down, based on past occurrences of similar price movements. This can give you valuable insights into the potential direction of the market, allowing you to make better-informed trading decisions.
One of the key features of the BMP indicator is that it allows you to choose the price you want to determine the probability of. By inputting your desired price, the indicator will analyze historical data and provide you with the likelihood of reaching that price, offering a more personalized approach to trading.
How Does the BMP Indicator Work?
The BMP indicator calculates the probability of a bar's price movement by comparing the current price change (in percentage) to historical price changes. It does this by maintaining separate arrays for green (bullish) and red (bearish) price movements, as well as corresponding arrays for the count of each movement.
Whenever a new bar is formed, the indicator checks whether the price movement (in percentage) is already present in the respective array. If it is, the corresponding count is updated. Otherwise, a new entry is added to the array, with an initial count of 1.
After analyzing the historical data, the BMP indicator calculates the probability of each price movement by dividing the count of each movement by the sum of all counts. These probabilities are then stored in separate arrays for green and red movements.
Finally, the indicator displays the probability of the current price movement as a label on the chart. The label is color-coded, with green indicating a bullish price movement and red indicating a bearish price movement.
How Can the BMP Indicator Benefit Your Trading?
The primary benefit of the BMP indicator is its ability to provide you with a statistical edge in your trading. By analyzing historical price data, the indicator helps you understand the likelihood of a certain price movement occurring, allowing you to make more informed decisions about your trades.
The customizable nature of the BMP indicator, allowing you to input your desired price, makes it a valuable tool for traders with specific price targets in mind. By understanding the probability of reaching your target price, you can better manage your risk and optimize your trading strategy.
For example, suppose the BMP indicator shows a high probability of a bullish price movement towards your target price. In that case, you may consider entering a long position or tightening your stop loss on an existing short position. Conversely, if the indicator displays a high probability of a bearish price movement away from your target price, you may consider entering a short position or taking profit on an existing long position.
The BMP indicator can be used in conjunction with other technical analysis tools and indicators to further strengthen your trading strategy. For example, you can combine the BMP indicator with support and resistance levels, trend lines, and moving averages to better time your entries and exits.
Wrapping Up
In conclusion, the Bar Move Probability (BMP) indicator is a powerful and customizable tool that can help you gain a statistical edge in your trading. By analyzing historical price data and allowing you to input your desired price, the indicator provides valuable insights into the likelihood of price movements, enabling you to make better-informed trading decisions.
I hope you find the BMP indicator useful
Range Sentiment Profile [LuxAlgo]The Range Sentiment Profile indicator is inspired from the volume profile and aims to indicate the degree of bullish/bearish variations within equidistant price areas inside the most recent price range.
The most bullish/bearish price areas are highlighted through lines extending over the entire range.
🔶 SETTINGS
Length: Most recent bars used for the calculation of the indicator.
Rows: Number of price areas the price range is divided into.
Use Intrabar: Use intrabar data to compute the range sentiment profile.
Timeframe: Intrabar data timeframe.
🔶 USAGE
This tool can be used to easily determine if a certain price area contain more significant bullish or bearish price variations. This is done by obtaining an estimate of the accumulation of all the close to open variations occurring within a specific profile area.
A blue range background indicates a majority of bullish variations within each area while an orange background indicates a majority of bearish variations within each area.
Users can easily identify the areas with the most bullish/bearish price variations by looking at the bullish/bearish maximums.
It can be of interest to see where profile bins might have no length, these can indicate price areas with price variations with alternating signs (bullish variations are followed by a bearish sign) and similar body. They can also indicate a majority of either bullish or bearish variations alongside a minority of more significant opposite variations.
These areas can also provide support/resistance, as such price entering these areas could reverse.
Users can obtain more precise results by allowing the profile to use intrabar data. This will change the calculation of the profile, see the details section for more information.
🔶 DETAILS
The Range Sentiment Profile's design is similar to the way a volume profile is constructed.
First the maximum/minimum values over the most recent Length bars are obtained, these define the calculation range of the profile.
The range is divided into Rows equidistant areas. We then see if price lied within a specific area, if it's the case we accumulate the difference between the closing and opening price for that specific area.
Let d = close - open . The length of the bin associated to a specific area is determined as follows:
length = Width / 100 * Area / Max
Where Area is the accumulated d within the area, and Max the maximum value between the absolute value of each accumulated d of all areas.
The percentage visible on each bin is determined as 100 multiplied by the accumulated d within the area divided by the total absolute value of d over the entire range.
🔹 Intrabar Calculation
When using intrabar data the range sentiment profile is calculated differently.
For a specific area and candle within the interval, the accumulated close to open difference is accumulated only if the intrabar candle of the user selected timeframe lies within the area.
This can return more precise results compared to the standard method, at the cost of a higher computation time.

Auto Fib ZonesAuto Fib Zones is a extension of the ABC finder script that I released. It uses the pivot point system I developed in the ABC finder to identify major or significant trending moves in the market.
It will then draw the fibzones for the trend line. The fib zone will auto update for as long as the trend line continues (size will keep increasing).
The zones will continue to extend to the right along with price until it is tested. The start of the green teal zone is the 0.618 and fills to the 0.786 and the Blue zone is the 0.786 and fills to the trend start or 1 value of the fib.
You can adjust the Bars Back variable to require more or less candles to create/ validate a new trend. In the screen shot about it is set to 50 bars however I've seen good results on higher timeframes like 4h + with 15 bars as the setting.
This is basically ITC's Optimal Trade Entry concept at least that is what the original inspiration for modifying my base script was.
As always hope it helps. God bless

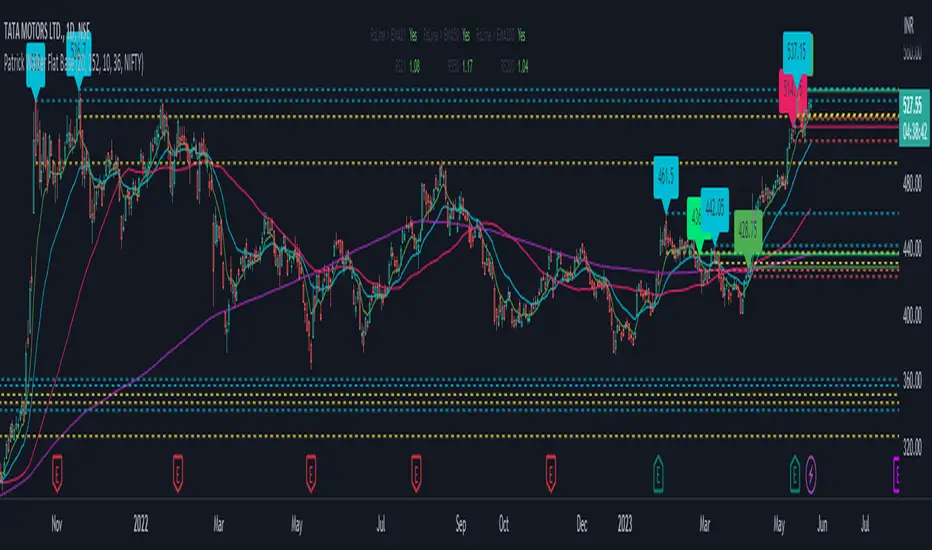
Patrick Walker Flat BaseThis pine script is provide recent support and resistance.
Script will use ema8, ema21, sma50 and sma200 to generate the support and resistance line.
Inspired from Patrick Walker style of trading. This is my personal logic i build studying the charts.
There is 3 types of resistance generated by this script.
1) top resistance 1
when ema8 > ema21 and low > ema8 and gap between ema21 and sma50 is less than 10% and in last 3 days previous 4th days highs is not crossed by close.
2) top resistance 2
when close/open below ema21 and ema8 > ema21 and high >= ema8 and ema21 > sma50 and gap between ema21 and sma50 is less than 10%
3) bottom resistance
when ema8 < ema21 and close/open cross above ema8 but high < ema21
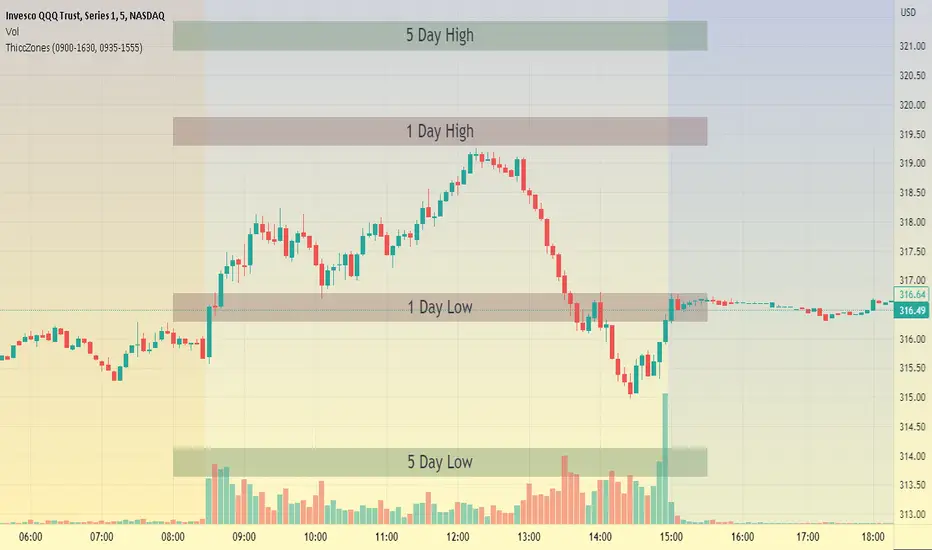
ThiccZonesThis indicator is a formula that includes 4 different zones which are different sizes based on the ticker you decide to use. It was optimized for SPY and other market ETFs but works well for all stocks on the market. The formula puts a zone at the previous day's high and low, and the previous 5 day's high and low. These zones are meant to be used as support and resistance and can even overlap, creating a 'master zone'. This is different than other zone indicators because the formula for these zones is something I created myself and have been unable to find on here. I have had the most success using a 1-15 minute chart and using my zones for reversal areas. I often look for other indications of reversal as well that line up with the area of the zones. It can also be used on the break and retest of these zones. I have found that when a stock breaks one of these zones it will often retest and continue that trend.
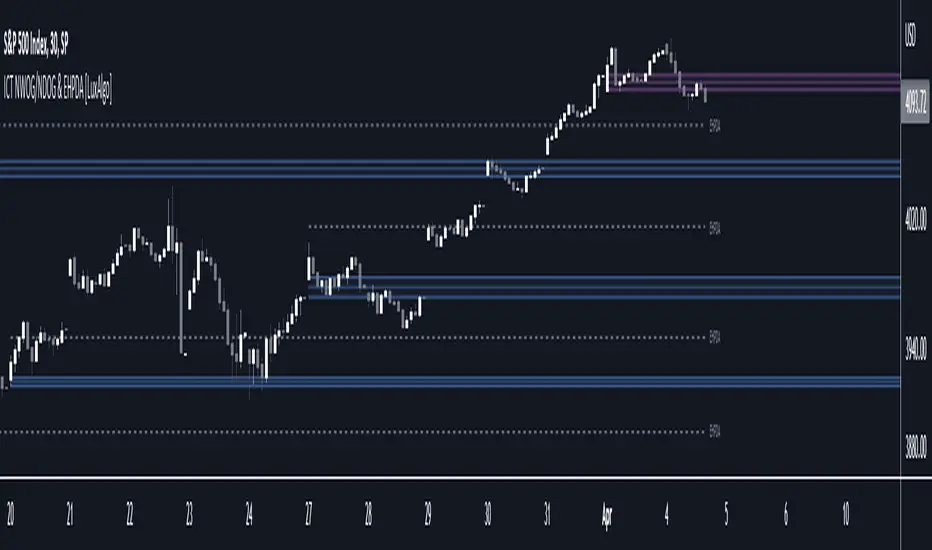
ICT NWOG/NDOG & EHPDA [LuxAlgo]This indicator displays New Week/Day Opening Gaps alongside Event Horizon PD Arrays which were conceptualized by a trader, ICT.
🔶 SETTINGS
Show: Determines if new week opening gaps (NWOG) or new day opening gaps (NDOG) are shown.
Amount: Controls the amount of most recent NWOGs/NDOGs to display on the chart.
Show EHPDA: Displays Event Horizons PD arrays.
🔶 USAGE
New Week/Day Opening Gaps are generally used as potential support or resistance areas.
Trader ICT describes that under consolidating market conditions, price tends to revert towards the opening gap area. This is consistent with other analysis suggesting that price has a tendency to come back toward gaps, ultimately looking to fill them.
ICT also introduces a novel concept, the "Event Horizon PD Array" (EHPDA) which are intermediary levels constructed from the average between the neighboring NWOGs or NDOGs.
EHPDA's are described by ICT as levels that "will not allow price to escape to the NWOG that will create a surge towards the NWOG it got too "close" to but has not yet reached."
Swing BoxesHey, folks!
Sorry for not posting anything for such a long time. Don't have enough ideas and resources to get inspiration, so trying to brainstorm good stuff in my free time from university studies.
But despite my absence more I now have 300+ people subscribed to me! Thanks, guys, for keeping interest for my work, as I still do value each boost on my script, for real :)
So here is new script , enjoy!
Swing Boxes is pretty simple indicator, which plots signals with "boxes", that help you determine price targets.
What is the idea behind?
I wanted to make indicator, that could help me make swing trades with nice accuracy (as all we want, lol), and for signal criteria I decided to use highs and lows of the price . Then I started coding some ideas to see which of them could be worthy. And, actually, Swing Boxes appeared to be good. But the thing is, that I didn't intend to build them, they appeared as an anomaly from my code :)
I started to explore this anomaly (it looked super cool, but was repainting hard) to fix it and I succeeded, now Swng Boxes don't repaint.
The main idea is that when price goes above it's highest value of p-bars back or below it's lowest value p-bars back, then there is a some god probability, that price will continue to follow current direction.
And the things about Swing Boxes is that when there is a good trend movement, the boxes become super small to track price movement and when price breaks out in the counter-trend direction, then you will be able to almost perfectly catch a top or a bottom! But most of the signals won't be so high-quality, so don't think that is this some holy grail to trade swing-trading, because it is not.
Signal logic
Quick hint:
- epsilon(variable e ) = ATR * ATR_Factor . It is used to determine box's sensitivity to price changes.
If previous close is higher than variable, which contains previous HIGHEST value (variable h in the code), then update the this variable by taking up-to-date highest value and add epsilon( e ) to it;
If previous close is lower than variable, which contains previous LOWEST value (variable l in the code), then update the this variable by taking up-to-date lowest value and substract epsilon( e ) from it.
Variables decribed above ( h and l ) are box's top and bottom respectively, so if price cross them, it is logical to update it is value.
Settings and what is what
Swing Box Period - numbers fo bars in the past to find highest and lowest price from. The bigger the input, the bigger the boxes will be;
ATR Period;
ATR Factor - multiplier for ATR, determines sensitivity for price changes. The bigger this input, the more accurate signals will be, but less the probability that the signal will be on the top or a bottom.
Show Boxes? - when chosen, plots box's top and bottom. Used to determine price targets.
Show Baseline? - when chosen, plot's baseline, which midline between box's top and bottom.
How to use?
This indicator plots green and red triangles by default.
- Green triangle --> Buy ;
- Red triangle --> Sell ;
As I've said before, many signals from indicator will probably be garbage, so you need to tune settings for youself, so it could satisfy you .
You can enable showing boxes to see box's top and bottom. Box's bottom --> your entry, top --> your profit target.
If you find a way to sort bad signals, you will be able to trade with super cool RR, because the signal from Swing Boxes appear to be a good one, there is almost 95% probability, that price will not even come close to your stop loss, so you can trade with super small stop-losses! Smaller stop-loss --> smaller risk --> smaller loss --> bigger profit, it is that easy.
Also you can enable baseline to use at as your 1st TP, and box's top/bottom as 2nd TP, closing 25% on TP1 and the rest on TP2 (but that is just mine recommendation, you can use different RM (risk-management), if you want).
Also you can use baseline as your S/R (Support/Resistance) line, test it out on your charts.
And please, hear me out: as all other indicators out here on the TradingView, Swing Boxes ARE NOT meant to be traded in solo! Many bad signal can go in a row, so PLEASE find your way to filter out bad signals with other indicators.
You can see here the example of a garabge-class signal in a row, so be don't be deluded!
I do hope that somebody will suggest and idea to improve this thing, as I personally don't have enough time to think about it because of my university studies, but I will probably try it make this thing better throughout the time.
And that's it for now, folks! If you have any ideas for scripts, strategies or anything else, feel free to DM me or leave a comment, I will check it.
Hope you will find this script useful.
Take your profits!
- Tarasenko Fyodor

Strongest Supports And ResistancesDraws the best support and resistance lines. How it works:
1) Tries every possible line through lows, highs, opens, closes
2) Finds the total hit counts given the confidence interval as input to the candlesticks
3) Calculates the strength of every line according to hit count, total volumes on hits, and timestamps
4) Eliminates similar lines, confidence interval is set as input
5) Selects the strongest 20(changable as an input) lines and draws them on the graph.
Makes your work way easier!!!
Feel free to adjust the parameters for your own style!
Cheers!!

Volume Based Support & ResistanceThis script uses the Volume of each candle to find support and resistances on the whole visible chart. There is a single easy to use setting that is the Distance between major S/R lines which is 10% for the default and better for Daily timeframe. If you set a lower number, for example 5% then there will be more lines on the chart which is better for lower time frames and higher number like 20% maybe better for weekly timeframes.
It is developed based on using for Bitcoin daily timeframe, but it can be used for any symbol on any timeframe with the proper settings.
The limitation is the number of visible candles which the data and S/R lines are calculated based on them (if the previous data was within the same price range and if not, there is no issue).
Also, this code is a good learning example of using arrays and lines together in the trading view's pine script.

The Perfect Support & ResistanceSupport & Resistance drawn based on overbought & oversold RSI . where the overbought acts as resistance and oversold acts as support.
It has 2 levels (for support and resistance - i call them level_n_high or level_n_low) for each lookback period. it checks the highest pivot and the lowest pivot based on the lookback period then we compare if rsi is higher than the highest pivot or the lowest pivot and we also check if rsi is overbought or oversold and if the statement is true, then we assign the high to the variable level_n_high or level_n_low. n being the number of levels. in total there are 5 levels with both high & low for 5 lookback periods. This is basically how the code works.
these levels can be accessed at any timeframe. the defaults are 5m and 30m.
RSI settings: (default)
-------------------
length - 14
source - close
overbought - 70
oversold - 30
lookback settings: (default)
---------------------
lookback_0 - 200
lookback_1 - 100
lookback_2 - 50
lookback_3 - 20
lookback_4 - 10
Timeframe Settings: (default)
-------------------
htf1 - 5m
htf2 - 30m
Enjoy!

Fibonacci Levels Based on Supertrend [By MUQWISHI]A “ Fibonacci Levels Based on Supertrend ” indicator is supertrend indicator planned with Fibonacci retracements levels. Fibonacci retracements provides a sequence of levels starting from 0% to 100% in addition to extension levels. 0% is measured to be the initial Supertrend line, and 100% is the previous Supertrend line where it has been broken by candle. This tool could be valuable in terms of managing trades by setting targets and reducing the risk in the trend direction.
█ OVERVIEW
█ INDICATOR SETTINGS
Please let me know if you have any questions.
Thank you.

PSAR-Support ResistanceParabolic Support Resistance -PSAR SR is based on the Dynamic Reversal Points of Price. This indicator eliminates the false signals of regular Parabolic SAR (Stop and Reverse). The Price of previous SAR Reversal point is plotted as Support and Resistance. The idea is to trade only after the previous reversal point is crossed and a new candle formation above / below the support resistance lines.
Price moves sideways in between the S/R Lines mostly.
Buy and Sell Signals are based on normal P-SAR settings however this S/R must be considered. Please be aware that the indicator cannot be used as a stand alone. Please make required confirmations before going into action.
Disclaimer: Please use it at your own Risk.

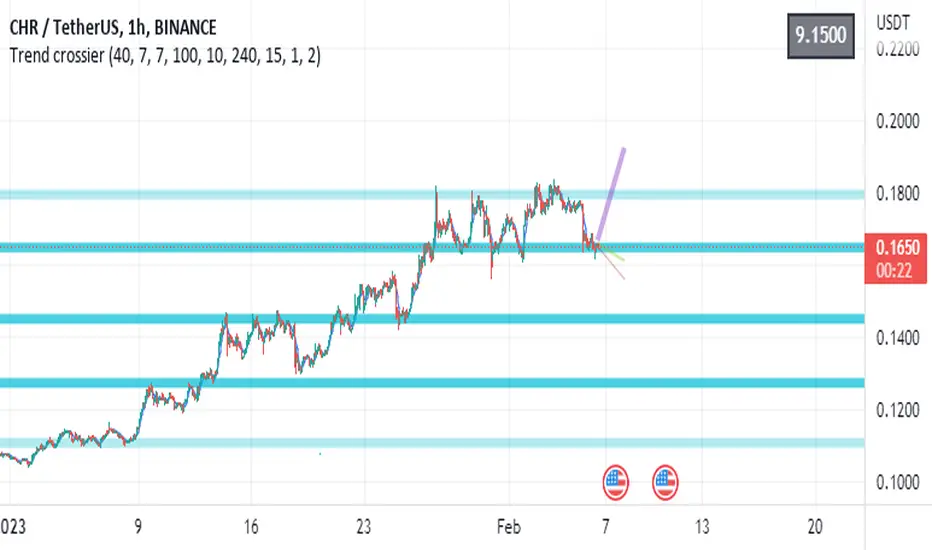
Trend crossierHello there!
I would like to share my script.
This is S/R levels indicator based on custom range for each step used for computing minimum/maximum of the range.
For example - we predefined step with 50 candles as one, after we have got the minimum and maximum of it - we come to the next 50 candles and do the same to it.
Finaly - we have got 20 lines for 10 steps.
After that - we set the ( SMA * mult) to have step between lines and if N of lines in range of step from eachother(if a+step > b and b+step > c ...) we call it a strong level.
It is not my idea(but my code), so I do not claim the uniqueness of this idea (the customer asked me to code it, but I also read about this method in open sources before).
The second thing - vectors of current trend direction on different timeframes.
For this task I took the same ranges, but ema () of each range. After first step it has an array with N values.
The next thing it does is take out "chain" one by one on each iteration. How does it do that? We take new AVG with neighbor values.
If we have 10 length at start - after iteration it becomes 9. So it repeats computing till length is 2.
After we have 2 points left - we can plot the line using indexes.
This way we can see the trend direction on different timeframes.
Feel free to use, change, put into another scripts. You can even never use it!
The right to publish this particular code was issued by the customer.
Have fun!
NhaDuHanhFX - Congestion Zone (Complete & Incomplete)
When the market is trending, the momentum is strong, the price often moves quickly in one direction. In the higher time frame, we see that the closing price of the candlestick is often far away from the previous candlesticks.
When the market is sideways, the momentum is weak, and prices often move slowly around an area. In the higher time frame, we see that the closing price of the candlestick is usually within the range of the previous candlesticks.
The Congestion Zone is a price action indicator that marks out such a sideways market area. It has many patterns: Complete and incomplete patterns.
- Complete Congestion Zone (Default): It includes at least 3 candlesticks that the next candlestick has a closing price within the previous candlestick range. Then, if a candlestick closes outside the range of the previous candlestick, it is a sign that the market has most likely ended the sideway, moving into a trending state.
- Incomplete Congestion Zone (Settings Option): It is more complex Congestion patterns. It also marks out sideways of the market. However, during the congestion formation, the price tried to break out of the zone with a candlestick closing outside the previous candlestick , right after that the price turns back and continues to congest.
In addition to using the Congestion Zone to predict if the market is likely to have moved from sideways to trending. The Congestion Zone is also used as a Support & Resistance area. When the price goes away and returns to the Congestion Zone, it will likely reverse.
Pay attention to the price area that previously appeared a lot of congestion zone. It is more likely to reverse.

Sup/Res Levels [QuantVue]Shows basic pivot point of support and resistance levels. Will show alerts for break of sup. or res. Allows for a volume filter for sup. res. breaks as well.
"B" means break of either a Sup. or Res. level with volume greater than the threshold.
"Bull/Bear Wick" means bullish/bearish candle on break.
Left - number of bars left hand side of the pivot .
Right - number of bars right hand side of the pivot .
Volume Thres. - the threshold value (%) for the Volume.
This indicator is useful to filter our insignificant breaks of sup. or res. Can help trader determine when to sit on their hands, or enter a trade.

Alex trading stragedyOverview
This script, named "ALEX TRADING STRATEGY", is a technical trading strategy designed for new investing groups. It uses a combination of various technical indicators to identify potential buying and selling opportunities in the market. The script includes the Relative Strength Index (RSI), Simple Moving Averages (SMA), Exponential Moving Averages (EMA), and Higher High Lower Low (HHLL) strategies to create a complete trading solution.
The user can change the position from long to short in the Input Settings. The script uses bar colors to indicate the current trading position. The script also has exit strategies to help manage the open trades. The user can also set the period for the various indicators used in the strategy.
The script provides various technical indicators and entry/exit signals to make the trading decision easier for the user. It also includes pivot lines, resistance and support levels to help the user make a more informed decision.
This Pine script implements a multi-indicator trading strategy that combines several technical analysis techniques for making trading decisions. The script uses the Relative Strength Index (RSI) to determine overbought and oversold conditions in the market and plots the RSI values on the chart. The RSI values above 70 are considered overbought and plotted as red upward triangles, while the RSI values below 30 are considered oversold and plotted as green downward triangles.
The script also calculates Simple Moving Averages (SMAs) with the user-defined period and plots them along with the Exponential Moving Averages (EMAs) of 20, 50, and 100 periods. Based on the crossover of the close price and the moving averages, the script enters long or short trades. The script sets the trade exit conditions as the low or high crossing the lower or upper band, respectively.
In addition to the moving average crossover, the script uses the highest high and lowest low over a user-defined period to determine long and short entries. The script plots the long and short conditions on the chart as green upward and red downward triangles, respectively. The script allows the user to switch between long and short trades by changing the input settings.
Finally, the script changes the bar colors based on the trade direction, with green bars indicating a long trade, red bars indicating a short trade, and blue bars indicating no trade. Overall, this Pine script provides a comprehensive trading strategy that combines several technical analysis techniques to make informed trading decisions.
HOW TO USE
Input Settings: In the Input Settings section, you can change the long to short position. You can also change the period value (default is 10) used to calculate the Simple Moving Average (SMA) for the Keltner channel.
Indicators: The script uses RSI (Relative Strength Index) with 14 periods as well as multiple EMAs (Exponential Moving Averages) with periods 20, 50, and 100 to help in making trading decisions.
Entry Signals: The script uses two main entry signals: (1) Keltner Channel and (2) HHLL (High-Low). When the closing price crosses above the upper band of the Keltner channel, the script generates a long signal, and when the closing price crosses below the lower band of the Keltner channel, the script generates a short signal. The HHLL strategy generates a long signal when the current high crosses above the highest high of the last "nPeriod" bars, and generates a short signal when the current low crosses below the lowest low of the last "nPeriod" bars.
Exit Signals: The script uses two exit signals: (1) Stop Loss based on Keltner channel and (2) Profit Target based on Keltner channel. The script exits the long position when the closing price crosses below the lower band of the Keltner channel, and the script exits the short position when the closing price crosses above the upper band of the Keltner channel.
To use this script, you will need to have access to a trading platform that supports PineScript, such as TradingView, and attach the script to a chart. The script will then automatically generate entry and exit signals based on the rules described above. It's important to note that this script is just a tool and not a guarantee of profit. As with any trading strategy, it's important to thoroughly test and understand the script before using it for live trading.

Bounce Price Detector ~ By mohx_404꧁༺ 𝓑𝓸𝓾𝓷𝓬𝓮 𝓟𝓻𝓲𝓬𝓮 𝓓𝓮𝓽𝓮𝓬𝓽𝓸𝓻 𝓘𝓷𝓭𝓲𝓬𝓪𝓽𝓸𝓻 ༻꧂
* Hi everybody here's the ★彡 𝓑𝓸𝓾𝓷𝓬𝓮 𝓟𝓻𝓲𝓬𝓮 𝓓𝓮𝓽𝓮𝓬𝓽𝓸𝓻 𝓘𝓷𝓭𝓲𝓬𝓪𝓽𝓸𝓻 彡★ indicator and how to use it :
彡彡彡彡彡彡彡彡彡彡彡彡彡彡彡彡彡彡彡彡彡彡彡彡彡彡彡彡彡
First : Depending on Pivot (HH,LL), the two possible price Correction appears on chart if the price under the Correction levels it would be a Resistance levels and to entry there candle must close above the levels, you can use Replay Mod to get the previous price Correction levels
And Here's Some Example : The price make a new HH,LL and new levels appears on chart but the price didn't confirm a bounce signale and close above the first level
So in next candle the price brake the levels and drop down :
Then a new HH,LL and new levels appears on chart and the price back to the lower levels as a Resistance Levels but when it's close above the levels and test it again it become a Support levels and price bounce again
Here's another example when price go above the levels , test it and bounce again
About The levels : depending on Fibonacci golden rate
░▒▓█ 𝐍𝐨𝐭𝐞 : You could change the pivots the value 10 for low time frame and
scalping for higher time frame you could increase the pivots value or keep it as you want █▓▒░

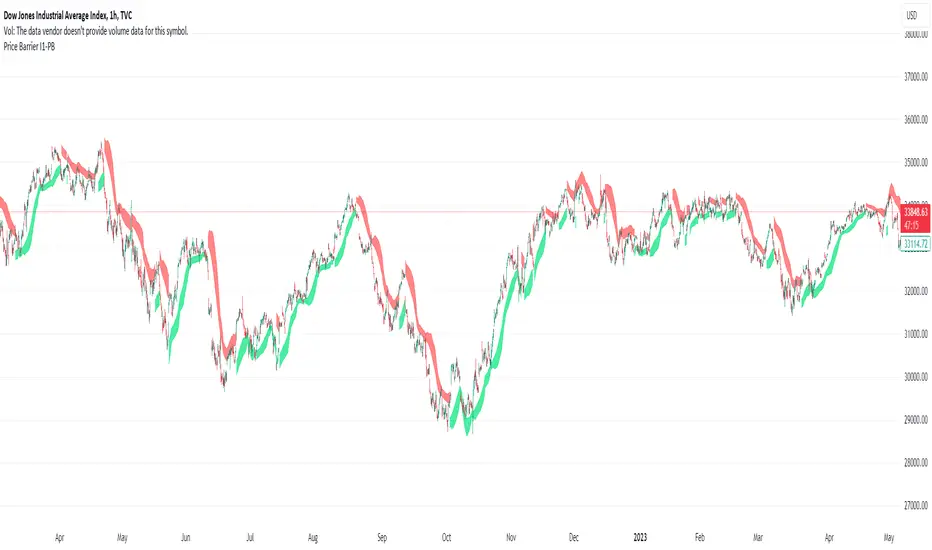
Price Barrier I1-PBIdea:
This script combines: Parabolic SAR, Stochastic RSI and MA
SAR is used to determine the price direction of an asset, as well as draw attention to when the price direction is changing.
Combine Stochastic RSI to point out the strength of the SAR signals.(Of course the setting for Stochastic RSI in this script is customized).
Then using MA to calculate and plot.
The plot line of this script at the center line and draw 2 line with offset to the center line.
Concept:
(Note that we take the close to get the closing price)
-SAR provides series of dots placed either above or below the price bars. A dot below the price is deemed to be a bullish signal.
-Stochastic RSI with its crossing of K and D line, last crossing of K and D will be recognized as crossing point. The direction of latest points will be current trend also in some case value above 80 is Over Buy and below 20 is Over Sell.
-So how could we present the domain line? (The domain line are two line with background color filled) Using the deviation from the MA as the baseline, we will draw two lines with 2 distinct points, then color them. We will call them price barrier. There are 4 plot MA, 2 for above and 2 for below.
-Strength of barrier calculation based on SAR and RSI mentioned above.
How it works:
1. The price barrier (domain line) displays above and below bar which could be resistance or support for current bar.
- Yellow means the soon/week signal.
- Green below bar means the support barrier.
- Red above bar mean the resistance barrier.
2. This indicator provides a warning signal when the color of the price barrier changes.
- Above barrier's color:
+Turn red: "Down Red"
+Turn yellow: "Down Yellow"
- Below barrier's color:
+Turn green: "Up Green"
+Turn yellow: "Up Yellow"
Suitable time frames:
4h, 1D, 1W
* Please note that this logic does not attempt to predict future prices or 100% accurate signal.
(INVITE ONLY indicator. Please direct message or visit website if you want to try it out)
Hope you guys enjoy!
Examples:
BTCUSD 4H
XAUUSD 1D
EURUSD 1D
AAPL 1D
TARVIS Labs - Support & Resistances IndicatorOVERVIEW
This indicator helps automatically determine support and resistances on any chart across any time frame. You can therefore use this indicator for different purposes, to determine HTF S/R zones, LTF breakouts by combining various lookback periods. I'll try and provide examples below for both.
INPUTS
Let's review the inputs to start
"lookback ticks" - the number of historical ticks that you want to take into account to figure out supports and resistance levels for that period. For example, do you want to figure out the support and resistances for that past 250 chart ticks, 500, 750 etc.
"number of supports & resistances wanted" - This will output more or less resistances based on requested input. The supports and resistances are ordered by strongest to weakest, so 1 is the strongest support/resistance on the chart which is the blue line, 2 is the next strongest, 3 the next, etc.
"resistance color" - Simply the color for resistances you want to use on the chart
"support color" - Simply the color for supports you want to use on the chart
"automatically figure out increment" - if this is set to true the algorithm will automatically try and figure out the price range & price range increment sizes for the lookback period provided to determine zones of supports/resistance. When you can I would suggest putting in the increment yourself. Ill provide an example below as well
increment - the size of the support/resistance zones you want to use. Ideally this would be as small as possible to be most helpful.
Ex 1.
Let's say you want to use this indicator on ETH on the last 750 ticks of data and on that 750 ticks of data the price ranges from $1,200 to $1,400. You can choose to uncheck "automatically figure out increment" and keep increment at 1. It will then figure out the S/R zones based on $1 ticks of data.
Ex 2.
Let's say you want to use this indicator on BTC 1d chart on the last 750 ticks of data but you dont really want to figure out the price range for the past 750 days of data, well you can just check "automatically figure out increment" and leave the "increment" input as is and it will automatically figure out the increment sizes for you and the S/Rs for that automatically generated range.
BEST USING THE INDICATOR
When you are trying to figure out supports and resistances I would start with HTF first. You can use the 1d chart for this which typically works well. Each touch point or "level" provided by the blue line is considered a significant support or resistance. If there are many different levels provided by the blue line around a general area that would be considered a zone of support or resistance. The longer the blue line stayed in a historical level the stronger that level of support or resistance is. Using the blue line, you can extend the blue levels using the line tool on TradingView across the entire chart. You should now have your HTF supports and resistances outlined. You can see in the DOGE chart provided, the long standing blue lines of support (which created a zone) were discovered way before it was ever touched by DOGE and was the bottom for DOGE's movement in the bear market.
Once you have your HTF supports/resistances outlined you can move to LTF, and you can use the indicator on the 15m chart (where I think it works really well). You can figure out if the chart is breaking out if it clears all LTF resistances, and where it may hit its next major resistance from the outlined HTF resistances you already created. On the flip side, if the price has lost all major supports it may be a good opportunity to short.
If the price of the chart has gone way above the blue line on LTF but the blue line hasn't moved up around the current price, theres a good chance the price will come back down as it wasn't a strong enough push. You can use this as a way to wait to enter on moves up.
There is a lot of ways to use this indicator, and I implore you to mess around with it to get acclimated to how it functions to serve you in the best way possible.
NOTE - this indicator is computationally heavy, therefore if its not loading for you please reduce the number of lookback ticks or consider increasing the increment size in order for it to load.
