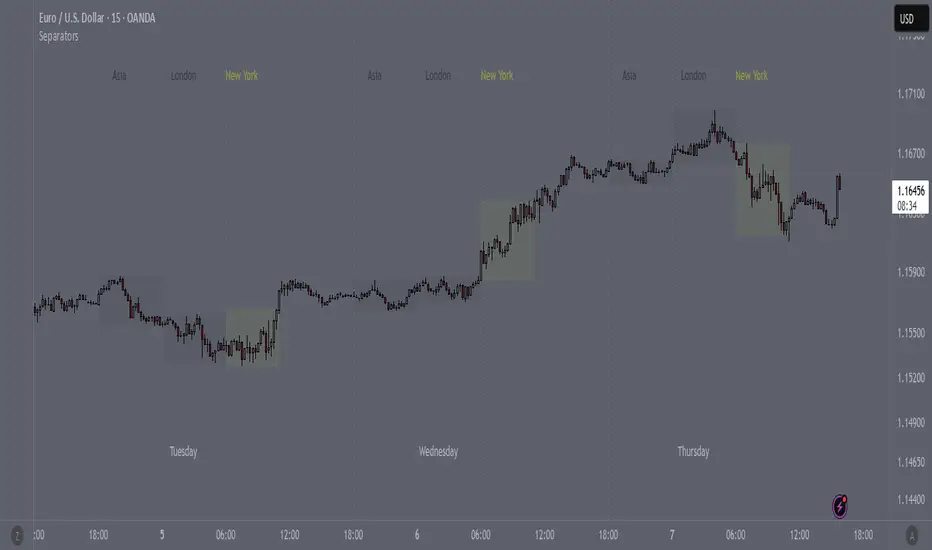
SeparatorsSession - H1 and below Time Frame
Day - H4 and below Time Frame
Month - D Time Frame
Quarter - W Time Frame
Поддержка и сопротивление
EMA ZONE MASTER [By TraderMan]🟢 EMA Zone Master Indicator Explanation 🚀
🌟 What is the EMA Zone Master?
The EMA Zone Master is a powerful TradingView Pine Script indicator designed to help traders identify trends, entry points, and manage trades with precision. It leverages a 200-period EMA (Exponential Moving Average) to create a dynamic zone for spotting bullish 📈 and bearish 📉 trends. The indicator provides clear buy/sell signals, take-profit (TP) levels, and stop-loss (SL) levels, making it ideal for both novice and experienced traders! 💪
🔍 How Does It Work?
The indicator uses the 200-period EMA as its core, surrounded by a zone defined by a percentage offset (default 0.3%). Here's how it operates:
Trend Detection 🧠:
The price's position relative to the EMA zone determines the trend:
Above the zone (with tolerance and minimum distance) signals a bullish trend (BUY 📈).
Below the zone signals a bearish trend (SELL 📉).
A neutral trend occurs when the price is within the zone or lacks momentum.
A trend is confirmed after a set number of bars (default 3) to filter out noise. 🔎
Trade Signals 🚦:
Buy Signal: Triggered when the price breaks above the EMA zone with confirmation.
Sell Signal: Triggered when the price breaks below the EMA zone with confirmation.
Signals are visualized with labels ("BUY" or "SELL") on the chart for clarity. ✅
Position Management 🎯:
Entry Price: Set at the closing price when a signal is triggered.
Take-Profit Levels: Three TP levels (TP1, TP2, TP3) are calculated based on a Risk/Reward Ratio (default 0.7).
Stop-Loss: Calculated using the ATR (Average True Range) with a multiplier (default 6.0) for volatility-based protection. 🛡️
Lines and labels for entry, TP, and SL are drawn on the chart for easy tracking.
Trend Strength 💪:
The indicator calculates trend strength (0-100%) and categorizes it as Very Strong, Strong, Moderate, Weak, or Very Weak. This helps gauge the reliability of the trend. 🌡
Analysis Comment 📝:
A dynamic comment provides professional insights based on trend strength, guiding traders on whether to act or wait. 🧑💼
Visuals & Alerts 🔔:
The EMA, zone boundaries, and candlestick colors change based on the trend (green for bullish, red for bearish, gray for neutral).
A table in the top-right corner summarizes key data: trend direction, strength, entry price, TP/SL levels, and success rate.
Alerts are generated with detailed trade information when a new signal appears.
🛠 How to Use It?
Setup on TradingView ⚙️:
Add the EMA Zone Master to your chart via the TradingView Pine Script editor.
Customize settings like EMA Length (default 200), Zone Width (0.3%), ATR Period (50), and Risk/Reward Ratio (0.7) to suit your trading style. 🛠
Interpreting Signals 📊:
Buy Signal (AL): Look for a "BUY" label and green candlesticks when the price breaks above the EMA zone. 📈
Sell Signal (SAT): Look for a "SELL" label and red candlesticks when the price breaks below the EMA zone. 📉
Check the table for trend strength and analysis comments to confirm the signal's reliability.
Opening a Position 💸:
Long Position: Enter a buy trade when a "BUY" signal appears. Set your take-profit at TP1, TP2, or TP3 and stop-loss at the SL level shown on the chart.
Short Position: Enter a sell trade when a "SELL" signal appears. Use the TP and SL levels provided.
The indicator automatically plots these levels as lines and labels for easy reference. 🎯
Managing Trades 🕒:
Monitor the trade's progress via the table and labels.
The indicator tracks if TP1, TP2, or TP3 is hit or if the trade stops out, updating the Last Result in the table (e.g., "✅ TP1 SUCCESS" or "❌ STOPPED OUT").
Use the Success Rate (displayed in the table) to gauge historical performance (75% for BUY, 65% for SELL, 50% for NEUTRAL).
Using Alerts 🔔:
Set up alerts in TradingView to receive notifications when a buy or sell signal is triggered.
The alert message includes the trend, strength, entry price, TP/SL levels, success rate, and analysis comment for quick decision-making.
📈 How to Open a Position?
Wait for a Signal: Ensure a "BUY" or "SELL" label appears, and the trend strength is at least Moderate (40%+) for higher confidence. ✅
Check the Table: Review the trend direction, strength, and analysis comment to confirm the trade setup. 📊
Enter the Trade:
For a Buy: Enter at the entry price shown, set TP1/TP2/TP3 and SL as indicated by the lines/labels.
For a Sell: Same process, but for a short position.
Monitor: Watch for TP or SL hits. The indicator will update the table with the result (e.g., "✅ TP3 SUCCESS"). 🕒
Risk Management: Always adhere to the stop-loss level to limit losses, and consider partial profit-taking at TP1 or TP2 for safer trading. 🛡️
🎉 Why Use EMA Zone Master?
Clear Signals: Easy-to-read buy/sell signals with visual cues. 🚦
Automated Levels: Pre-calculated TP and SL levels save time and reduce errors. 🧮
Trend Strength Insight: Helps avoid weak trends and focus on high-probability setups. 💪
Professional Analysis: Dynamic comments guide your trading decisions. 🧑💼
Customizable: Adjust settings to match your trading style or market conditions. ⚙️
Alert System: Stay informed with detailed alerts for timely action. 🔔
⚠️ Tips for Success
Confirm with Other Tools: Use additional indicators (e.g., RSI, MACD) to validate signals. 🔍
Test First: Backtest the indicator on your preferred market/timeframe to understand its performance. 📉
Risk Management: Always use proper position sizing and respect stop-loss levels. 🛑
Higher Timeframes: The indicator works best on higher timeframes (e.g.,15MİN, 1H, 4H, Daily) for stronger signals. ⏰
Happy trading with EMA Zone Master! 🚀 Let it guide you to smarter, more confident trades. 💰 Feel free to tweak settings and share your results! 😊

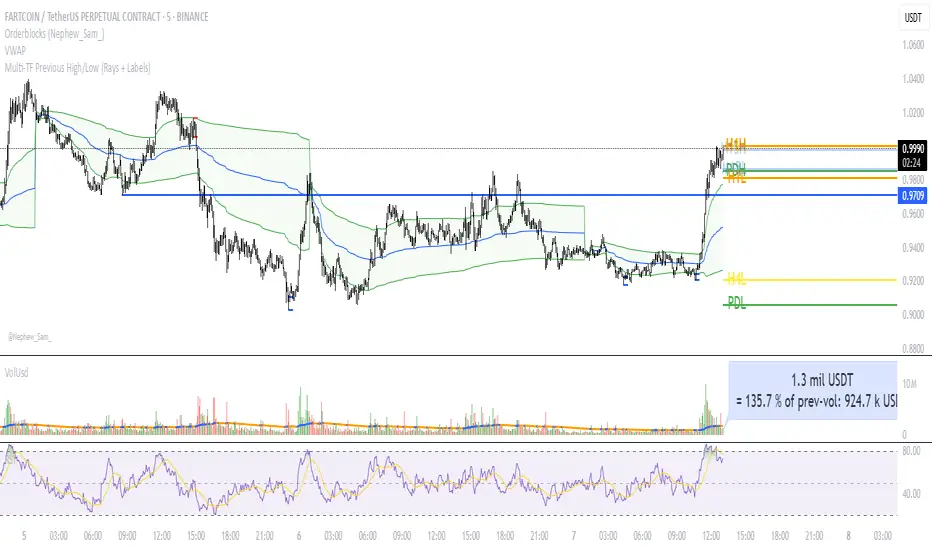
Multi‑TF Previous High/Low (Rays + Labels)Use this indicator if you want to automate Support and Resistance levels.
Previous Day High and Low - Green Lines
Previous 4 Hour High and Low - Yellow Lines
Previous 1 Hour High and Low - Orange Lines
Previous 15 Minute High and Low - Light Blue Lines
Follow me on X-
ADHDTRDR
TrendSync TP Engine [By TraderMan]📘 TrendSync TP Engine – Overview & User Guide
TrendSync TP Engine is a trend-following indicator that automatically detects trend direction based on how long the price stays above or below a defined EMA (Exponential Moving Average). Once a trend is confirmed, it plots entry, take-profit (TP), and stop-loss (SL) levels directly on the chart.
Its purpose is to offer a clear roadmap for manual traders and act as a “TP engine” in trend-based trading.
🔧 How It Works
Trend Detection:
If the price closes consistently above or below the EMA for a minimum number of bars, a LONG or SHORT trend is triggered.
EMA-Based Trade Plan:
When a new trend is detected, the script automatically plots:
Entry level
TP1, TP2, TP3
SL level
based on dynamic ATR offsets.
TP / SL Labels:
As the price hits TP or SL targets, real-time labels appear on the chart showing trade progress.
Built-in Alert System:
Alerts are triggered when:
A new position opens
TP1, TP2, TP3 levels are reached
Stop loss is hit
🚀 How to Use
Add to Chart:
Apply the indicator to your chart on any timeframe (1H, 4H, 1D, etc.).
Configure Settings:
Adjust parameters like:
EMA length
Minimum trend duration
TP/SL distances (in ATR multiples)
to fit your strategy.
Follow the Plan:
Once a trend begins, you'll see:
Blue line for entry
Green dashed lines for TP1/TP2/TP3
Red dashed line for SL
Let the engine guide your trades.
🎯 Who Is It For?
Trend-following traders
Manual traders who want structured trade plans
Users who prefer automated visual signals & alerts
Developers looking to build strategy logic on top
✅ Key Features
Automatic levels: Entry, TP1-3, SL lines
Alert-ready: Real-time push/email/webhook notifications
Clear visuals: All levels labeled with real-time status
Flexible & modular: Can be extended into a full strategy
Disclaimer: This tool is for educational and informational purposes only. It does not constitute financial advice. Use at your own discretion with proper risk management.

Smart support and Resistancehelps you find out where smart money has done bulk buying/selling.
the levels can give you confidence on your existing views and find high reward low risk setups.

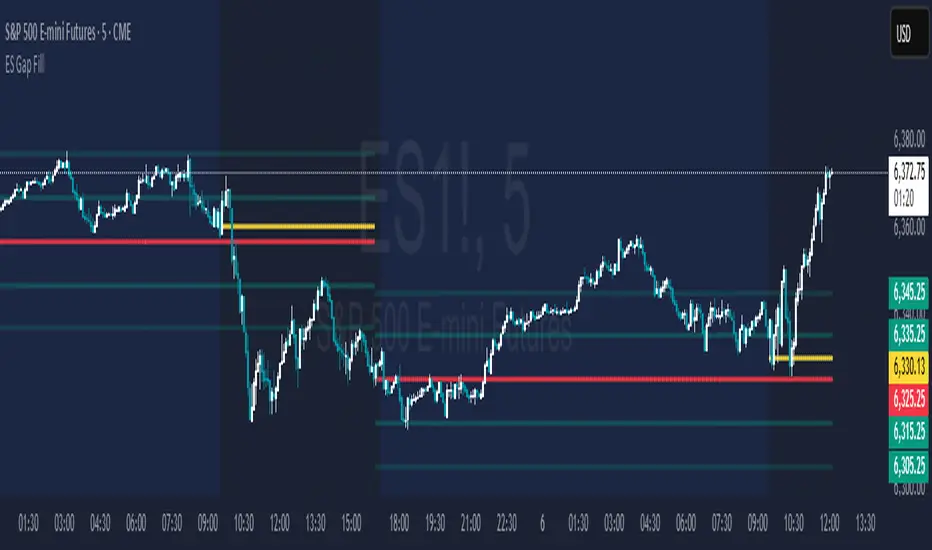
ES Gap FillAutomatically plots:
The gap fill level (previous day RTH close) - RED
The 1/2 gap (halfway between current RTH open and prior RTH close) - YELLOW
10 & 20 points to either side of the gap level - GREEN
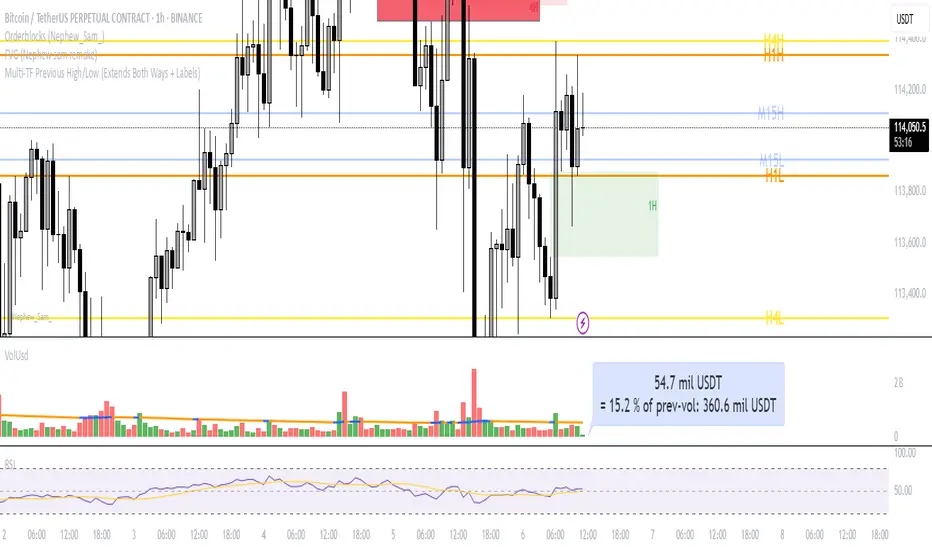
Multi‑TF Previous High/Low (Extends Both Ways + Labels)Use this indicator if you want to automate Support and Resistance levels.
Previous Day High and Low - Green Lines
Previous 4 Hour High and Low - Yellow Lines
Previous 1 Hour High and Low - Orange Lines
Previous 15 Minute High and Low - Light Blue Lines
Follow me on X-
@ADHDTRDR
Session High/Low indicator Session High/Low – London & Asia” is a TradingView indicator that automatically identifies and marks the single highest high and lowest low of each London and Asia trading session. At the close of each session, it draws clean horizontal rays extending to the right—one at the exact bar where the session’s peak price occurred and one where the trough occurred—so you can instantly spot key support and resistance levels without cluttering your chart.

BTC CME Futures Gaps (BTCGapHunt_CME)BTC CME Futures Gaps Indicator
Overview
This indicator visualises price gaps between the daily close and open of Bitcoin CME futures (CME:BTC1!). These gaps are often revisited ("filled") by market price action and may serve as technical targets.
Thanks
... to Maven and the Blockchain Masons (x.com/Masons_DAO) to push me on this topic.
What Is a CME Gap?
CME Bitcoin Futures do not trade 24/7. Gaps form when the market reopens at a different price than where it last closed.
Gaps are often used as support/resistance or liquidity targets.
This indicator tracks, visualises, and alerts on these gaps.
Key Features
Automatic gap detection using daily open/close on CME:BTC1!
Dynamic gap size threshold based on ATR (Average True Range)
Highlight unfilled gaps and track partial fills visually
Alerts for gap formation and fill events
Parameter overlay showing real-time settings
Supported and Overrideable Parameters
ATR Length: Defines the lookback period for ATR calculation (default: 14)
Gap Size Multiplier: Multiplies the ATR to set the dynamic gap threshold (default: 1.0)
Proximity Threshold: Price distance from gap edge to consider it filled (default: 100 USD)
Max Gaps Tracked: Maximum number of concurrent gaps shown (default: 50)
Alerts Enabled: Toggle alerts for gap formation and gap fill events
How the Gap Size Is Calculated
Minimum Gap Size = ATR(14) * Gap Size Multiplier
ATR Length and Gap Size Multiplier are configurable.
Gap threshold adjusts dynamically with market volatility.
Visual Guide
Red Box: Fully unfilled gap
Lemon Yellow Box: Partially filled gap
Right Margin Boxes: Snapshot of unfilled gaps for quick access
Top-Right Panel: Current ATR, Gap Size, Thresholds, etc.
Alerts
Gap Formed: A new gap is detected.
Gap Filled: The gap is either partially or fully filled.
Recommended Timeframes
1H, 4H, 1D (best resolution)
Designed for BTC spot/perpetual charts (e.g., BTCUSD, BTCUSDT)
How To Use
Add the script to your BTC chart.
Monitor red/yellow boxes for unfilled gaps.
Check config panel for current threshold and settings.
Enable alerts via TradingView for real-time updates.
Notes
Up to 50 gaps are tracked (adjustable).
Data source: CME futures via request.security.
All visuals and alerts are time-synced with your chart.
Disclaimer
This script is for educational purposes only. Trade at your own risk.

Current Day High/Low and Mid- Made by IshaanThis TradingView indicator plots the current day's high, low, and mid (50%) levels, based on the daily timeframe, and displays them on any intraday chart (e.g., 15m, 1h, etc.).
Lines begin at the official market open time (default: 9:30 AM exchange time).
Lines extend right indefinitely so they’re visible throughout the day.
Values are updated live during the trading session using daily high and low data.
The mid line is calculated as the average of the current day’s high and low.
You can customize:
Line colors (high, low, mid)
Line thickness
Market open time
This tool is helpful for traders looking to monitor intraday interaction with key daily levels.


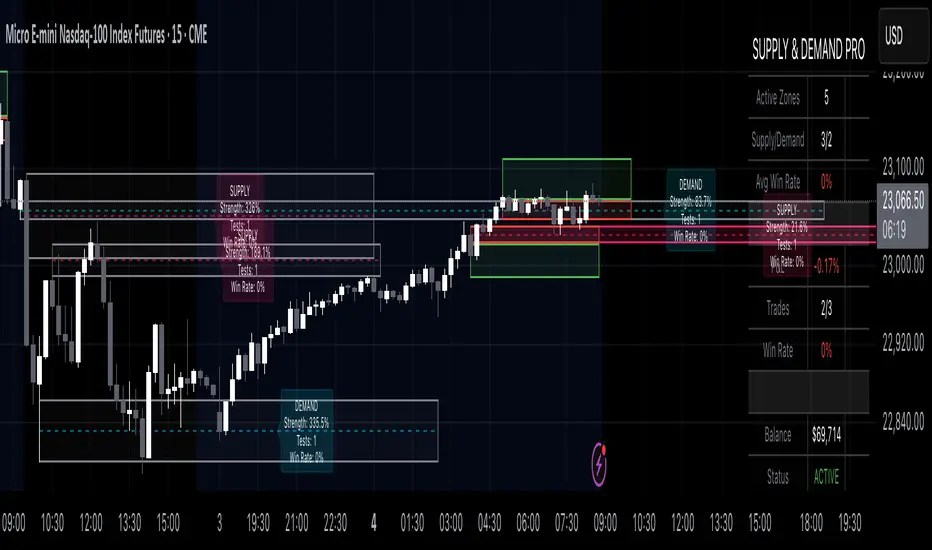
Supply & Demand Pro [Institutional]🎯 Overview
The most comprehensive Supply & Demand indicator on TradingView, designed for serious traders and prop firm professionals. Unlike traditional S&D indicators that just draw pretty zones, this system tracks actual performance metrics, provides entry/exit signals, and includes professional risk management tools.
❓ Why This Indicator?
After extensive research into what traders actually need (not just want), this indicator addresses the TOP complaints about Supply & Demand trading:
- ❌ "I don't know which zones to trust" → ✅ Each zone shows historical win rate
- ❌ "No clear entry/exit rules" → ✅ Multiple entry methods with visual R:R
- ❌ "Can't backtest effectiveness" → ✅ Full performance tracking
- ❌ "Too many false signals" → ✅ Quality filters and volume validation
🚀 Key Features
🎯 Professional Zone Detection
- Volume Profile Analysis (finds institutional accumulation/distribution)
- Swing Point Detection (classic pivot-based zones)
- Order Flow Analysis (coming in v2)
- Hybrid Mode (combines multiple methods)
📊 Performance Analytics
- Individual zone win rates
- Daily P&L tracking
- Account balance simulation
- Success/failure ratio for each zone
- Historical performance data
💼 Prop Firm Tools
- Daily loss limits (auto-stops trading)
- Position sizing controls
- Maximum concurrent positions
- Daily profit targets
- Clean reporting for evaluations
🎨 Entry & Risk Management
- Zone Edge entry (immediate)
- 50% Retracement entry (patient)
- Momentum Confirmation entry
- Visual Risk:Reward boxes
- Multiple stop loss methods (ATR, Fixed %, Zone-based)
📈 Advanced Features
- Auto-removes failed zones
- Volume confirmation requirements
- Strength-based zone ranking
- Smart alerts for high-probability setups
- Multi-timeframe compatibility
📋 How It Works
1. Zone Creation: Continuously scans for high-quality supply/demand zones using your selected method
2. Quality Filtering: Each zone must pass strength, volume, and historical performance filters
3. Visual Feedback: Zones display strength %, test count, and win rate directly on chart
4. Trade Signals: When price touches a zone, the system calculates entry, stop, and target
5. Performance Tracking: Every zone touch is tracked to build historical win rates
⚙️ Quick Settings Guide
For Beginners:
- Detection Method: "Swing Points"
- Min Zone Strength: 15%
- Risk:Reward: 2:1
- Entry Method: "Zone Edge"
For Advanced Traders:
- Detection Method: "Volume Profile"
- Min Zone Strength: 20%
- Min Win Rate: 50%
- Entry Method: "Momentum Confirm"
For Prop Firm Traders:
- Enable all Prop Firm Tools
- Set Daily Loss Limit to your drawdown rules
- Max Positions: 2-3
- Use "Professional" theme for screenshots
📊 What Makes This Different?
Traditional S&D Indicators:
- Draw zones based on one method
- No performance tracking
- No entry/exit rules
- Can't verify effectiveness
Supply & Demand Pro:
- Multiple detection methods
- Tracks win rate for EVERY zone
- Clear entry/exit signals
- Full backtesting capability
- Risk management built-in
🎓 Best Practices
1. Start Conservative: Use higher strength requirements (20%+) until familiar
2. Trust the Data: Zones with 3+ tests and 60%+ win rate are golden
3. Respect Risk Limits: The daily loss limit feature will save your account
4. Volume Matters: Zones with volume confirmation are significantly stronger
5. Be Patient: Wait for high-probability setups (check the win rate!)
🔔 Alert Options
- Zone Touch Alerts (with strength & win rate)
- High Probability Setups (60%+ win rate zones)
- Daily Limit Warnings
- Risk Management Alerts
💡 Pro Tips
- Combine with market structure for best results
- Higher timeframe zones are more reliable
- Watch for zones that align with round numbers
- Use partial profits feature to lock in gains
- Review daily performance to improve
🐛 Troubleshooting
- No zones appearing? → Lower Min Zone Strength to 10%
- Too many zones? → Increase strength requirement or enable filters
- Win rates not updating? → Zones need multiple tests to calculate
⚡ Performance Note
This indicator uses advanced calculations and may take a moment to load on lower-end devices. The comprehensive analytics are worth the wait!
🎁 Bonus Features
- 4 Professional themes
- Customizable dashboard
- R:R visualization
- Zone strength ranking
- Session-based filtering (coming soon)
📧 Support & Updates
This is an actively maintained indicator. Updates include:
- New detection methods
- Enhanced analytics
- Community-requested features
- Performance optimizations
⭐ If you find this indicator helpful, please leave a rating and comment with your results!
📌 Remember: No indicator is perfect. Always use proper risk management and never risk more than you can afford to lose.
ZigZag Volume Profile [ChartPrime]⯁ OVERVIEW
ZigZag Volume Profile combines swing structure with volume analytics by plotting a ZigZag of major price swings and overlaying a detailed volume profile around each swing. At the end of each swing, it highlights the Point of Control (POC) — the price level with the highest traded volume — and extends it forward to identify key areas of potential support or resistance.
⯁ KEY FEATURES
ZigZag Swing Detection:
Automatically detects swing highs and lows based on a user-defined length, creating clean visual segments of market structure.
These segments act as boundaries for volume profile calculations.
swingHigh = ta.highest(swingLength)
swingLow = ta.lowest(swingLength)
ZigZag Channel Visualization:
The ZigZag structure is connected with sloped lines, forming a visual “channel” of the price movement.
The ZigZag can optionally, scaled by ATR.
Volume Profile Around Each Swing:
For every completed swing (high to low or low to high), the indicator constructs a full volume profile using user-defined bin counts.
It scans volume across price levels in the swing and plots histogram-style bins using a gradient color to indicate volume magnitude.
Dynamic Bin Width and Slope Adjustment:
Bins are distributed across a vertical ATR-based range, and their width is adjusted based on the percentage of total swing volume.
The volume fill direction is adapted to the swing’s slope for visually aligned plotting.
POC Detection and Extension:
The highest volume bin in each swing is identified as the Point of Control (POC).
This level is plotted with a thicker line and extended horizontally into the future as a key reaction level.
Automatic POC Expiry on Price Interaction:
POC lines are continuously extended unless breached by price.
When price crosses the POC level, the extension is terminated — signaling that the level may have been absorbed.
Clean Volume Bin Visualization:
Bin colors range from green (low volume) to blue (higher volume), with the POC always marked in red by default for easy identification.
Volume percentages are optionally labeled at each bin level.
Flexible Swing Profile Parameters:
Users can control:
Number of volume bins
Bin width
Channel width (ATR factor)
Visibility of the swing channel or POC lines
Efficient Memory Handling:
Old POC lines and volume profiles are automatically removed from memory after a threshold to keep charts clean and performant.
⯁ USAGE
Use ZigZag swings to define market structure visually.
Analyze volume profile around each swing to understand where most trading activity occurred.
Use POC extensions as dynamic support/resistance zones for entries, stops, or take-profits.
Watch for price interaction with extended POC lines — breaks may suggest absorbed liquidity or breakout potential.
Use the ATR-based channel width to adapt profiles based on market volatility.
⯁ CONCLUSION
ZigZag Volume Profile offers a powerful fusion of structure and volume. By plotting detailed volume profiles over each price swing and extending the POC as actionable S/R levels, this tool provides deep insight into market participation zones — giving traders a tactical edge in both ranging and trending environments.

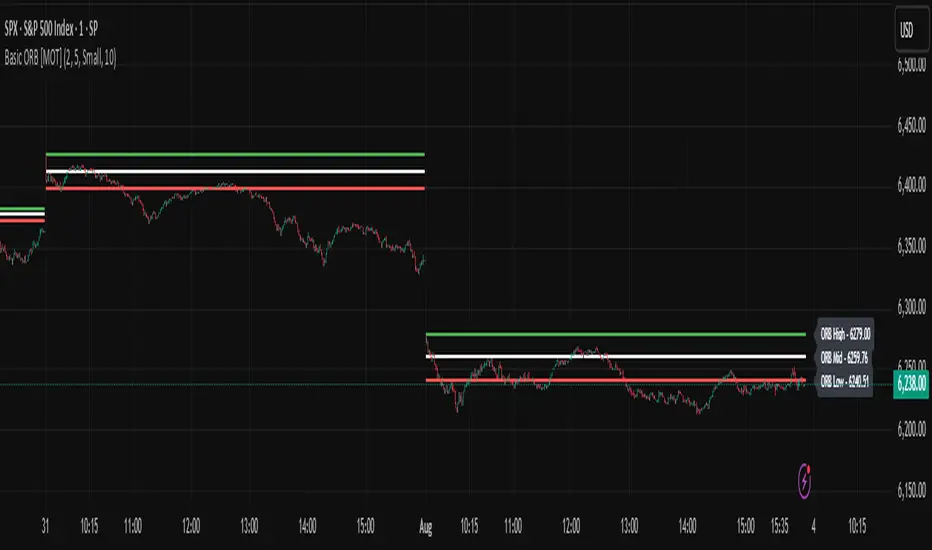
Basic ORB [MOT]Basic ORB – Opening Range Breakout Tool
The Basic ORB is a visual tool designed to assist intraday traders by identifying the opening range from 9:30–9:45 AM ET. It automatically plots the high, low, and midpoint of this range to help traders analyze potential areas of interest.
This script provides a simple and customizable way to frame market structure during the early trading session. It is intended to support various intraday strategies across multiple asset classes including futures, stocks, ETFs, indexes, and crypto.
🔹 Key Features
1. Opening Range Levels
- Automatically plots the High, Low, and Midline of the 9:30–9:45 AM ET session.
- Midline helps visualize the midpoint of the range.
- Customizable colors and line thickness.
2. Previous ORB Ranges
- Option to display previous days’ ORB levels for visual pattern recognition.
- Useful for spotting recurring reactions to prior day levels.
3. Dynamic Price Labels
- Adds price labels to each ORB line for quick reference.
- Fully customizable: adjust text size, background color, label position, and offset.
4. Clean Settings Panel
- Customize all visual elements to match your charting style.
- Control how many previous ORBs to display.
- Toggle features on or off for a simplified interface.
🧠 How to Use
- Best viewed on 1m, 5m, or 15m charts.
- Combine with your existing entry/exit criteria to monitor how price interacts with the opening range.
- Common use cases include breakout confirmation, rejection trades, and support/resistance analysis based on prior ORBs.
⚠️ Disclaimer
This script is for educational and informational purposes only. It does not constitute financial advice. Trading carries risk, and users should test any tools in a demo environment before live use. Always implement proper risk management.
Real-Time Swing High/Low Detector with liquidity sweepThis script identifies the most important market structure points (swing highs/lows) and liquidity sweeps in a configurable and timeframe-adaptive manner.
By default:
It shows 5 recent swing highs and lows to keep your charts readable.
It detects and illustrates up to 3 Liquidity Sweeps (very close new highs/lows to earlier extremes).
It automatically adjusts how tight the sweep detection is based on your chart’s timeframe to balance precision and noise.
You can tweak all these numbers via the input settings panel to customize the indicator to your personal trading style and chart preferences
Configurable Parameters
Pivot Length (pivot_length)
What it does: Determines how many bars to the left and right the script looks at when identifying swing highs and lows.
Effect: Increasing this value results in fewer, more significant swings; decreasing it makes the indicator more sensitive and detects more swings.
Default: 5
Suggested: Adjust based on your trading timeframe and style to balance sensitivity and noise.
Show Labels (show_labels)
What it does: Toggles the display of swing labels such as HH, HL, LH, LL on the chart.
Effect: If enabled, the script marks swing points with their corresponding label for easier visual reference.
Default: true
Use: Turn off if you prefer a cleaner chart without textual swing indicators.
Show Current Levels (show_current_levels)
What it does: Toggles horizontal lines extending from the latest swing highs and lows.
Effect: Provides visual support/resistance zones on the chart.
Default: true
Use: Helpful for visualizing major price levels based on recent swings.
Max Swing Points (max_swings)
What it does: Limits the number of swing points stored and displayed.
Effect: Prevents chart clutter and performance issues by controlling history length.
Default: 20
Use: Increase for longer history; decrease for lighter charts.
Liquidity Sweep Threshold (liq_sweep_threshold_pc)
What it does: Defines the maximum percentage price difference allowed to consider a new high/low "very close" to the previous one, detecting a Liquidity Sweep.
Effect: Controls how sensitively the script detects these sweep points.
Default: Automatically set based on chart timeframe:
For timeframes below 1 hour: 0.05% (stricter, less tolerant)
For 1 hour and above: 0.1% (more tolerant)
Use: This dynamic setting ensures relevance of Liquidity Sweeps across different timeframes.
Liquidity Sweep Label Transparency (liq_sweep_alpha)
What it does: Controls the opacity of "Liquidity Sweep" labels, with 0 being fully opaque and 255 fully transparent.
Default: 10 (mostly opaque but slightly transparent)
Use: You can increase this value if you want the labels to be more subtle.

CPR by myBiniyogCPR by myBiniyog
Purpose:
Clearly plots the Central Pivot Range (CPR), Support, and Resistance levels daily, weekly, and monthly (optional). CPR levels help intraday traders identify potential market direction, trends, and reversal points. CPR lines plotted clearly (blue), Support levels (green), and Resistance levels (red).
Calculation Method:
Pivot (P) = (High + Low + Close) / 3
Bottom Central (BC) = (High + Low) / 2
Top Central (TC) = Pivot + (Pivot - BC)
Support (S1-S3) and Resistance (R1-R3) levels calculated traditionally from pivot formulas.
Uniqueness & Originality:
Fully original script combining multi-timeframe (Daily/Weekly/Monthly) pivots.
Unique, clear visual representation designed for ease of use.
Closed-source to protect custom visual style and original logic.
Recommended Timeframes:
For optimal clarity and performance, use on 5-minute, 10-minute, or 15-minute intraday charts.
Compliance Statement:
Fully compliant with TradingView House Rules. Original work, not derived from publicly available scripts.

ICT Confirmed FVG Indicator ICT FVG Indicator (Confirmed by Swings)
Summary
This indicator is designed to identify high-probability Fair Value Gaps (FVGs) by confirming them with market structure. It filters out random imbalances and only highlights the FVGs that are created at the same time as a confirmed ICT Swing High or Swing Low.
The core principle is to connect price imbalances directly to significant shifts in market structure, providing a cleaner and more powerful signal.
What It Does
Identifies Swing Points: Automatically detects and draws confirmed swing highs (resistance) and swing lows (support) on your chart based on the settings you choose.
Finds Fair Value Gaps: It scans the chart for the classic 3-candle FVG pattern (also known as a BISI or SIBI).
Confirms FVGs with Swings: This is the most important feature. The indicator will only draw an FVG box if one of the three candles that created the FVG is also a confirmed swing point. This ensures you are only seeing imbalances that are directly related to a break in market structure.
Invalidates Old FVGs: To keep the chart clean, the indicator will automatically remove an FVG box after the price has fully passed through it a certain number of times (customizable in the settings).
Settings Explained
ICT Swings Settings
Left/Right Strength: Controls the sensitivity of the swing detection. Higher numbers require a more significant, obvious swing point to be confirmed. Lower numbers will identify more minor swings.
Max Swing Lines: Sets the maximum number of swing high and swing low lines to display on the chart at one time.
Swing High/Low Color: Customize the color of the swing point lines.
FVG Settings
Show Bullish/Bearish FVG: Use these checkboxes to turn the bullish (green) or bearish (red) FVG boxes on or off.
Bullish/Bearish FVG Color: Customize the color of the FVG boxes.
FVG Invalidation Threshold: This sets how many times the price can fully close on the other side of an FVG before the box is automatically removed.
Max Active FVGs to Show: Sets the maximum number of FVG boxes to keep on the chart to prevent clutter.
Key Features
High-Probability Signals: Filters out noise by focusing only on FVGs that are confirmed by a shift in market structure.
Clean Visuals: Automatically draws and removes swing lines and FVG boxes to keep your chart uncluttered.
Fully Customizable: Adjust the sensitivity of the swing detection and the appearance of the FVGs to fit your trading style.
Pure ICT Concepts: Built strictly on the principles of Inner Circle Trader for a method-consistent analysis.

Adam Mancini ES Game Plan LevelsThis script plots Support & Resistance levels from Adam Mancini's newsletter.
You can copy and paste levels from Adam's Newsletter to Indicator settings.
You can also add custom text after the support level. For e.g 6550 : Your custom text

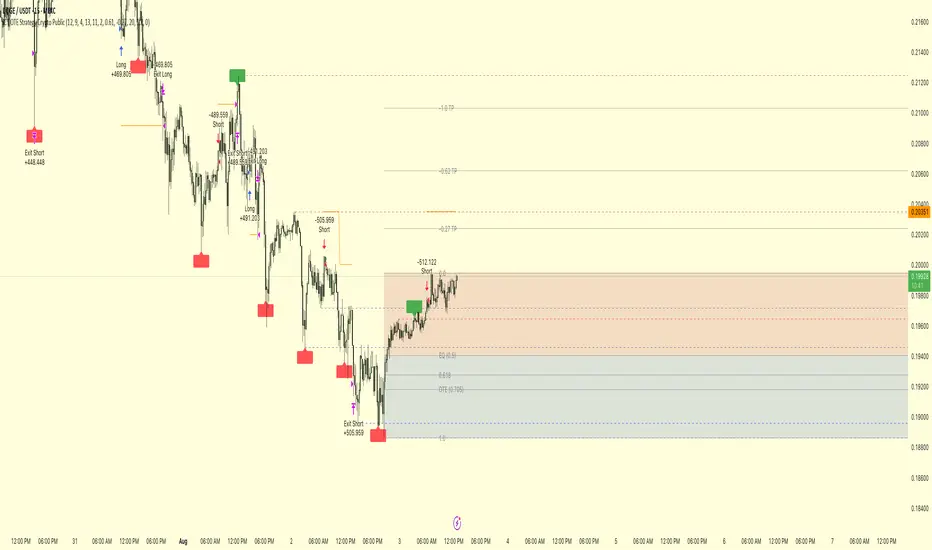
ICT OTE Strategy Crypto PublicICT OTE Strategy Crypto Public
This strategy automates a classic ICT (Inner Circle Trader) setup specifically tailored for the high-volatility nature of cryptocurrency markets. It aims to enter a trade on a retracement after a confirmed Break of Structure (BOS), using a dual-swing detection method to validate the market's direction before looking for an entry.
The entire process is automated, from identifying the market structure to managing the trade with advanced risk management options. This version uses a percentage of equity for its order sizing, which is ideal for crypto trading.
How It Works
Dual Swing Detection: The strategy uses two different sets of swing strengths to analyze market structure for higher accuracy:
Entry Swings: Weaker, more sensitive swings used to define the immediate dealing range for a potential trade.
Validator Swings: Stronger, more significant swings used to confirm a true Break of Structure.
Break of Structure (BOS): A trade setup is only considered valid after a strong "Validator" swing breaks through a previous "Entry" swing. This confirms the market's intended direction and filters out weak or false moves.
Identify Retracement Leg: After a confirmed BOS, the strategy identifies the most recent "Entry Swing" price leg that led to the break.
Auto-Fibonacci: It automatically draws a Fibonacci retracement over this leg, from the start of the move (1.0) to the end (0.0).
Trade Entry: A limit order is placed at a user-defined Fibonacci level (defaulting to 0.618), anticipating a price pullback into a discount or premium array.
After a bullish BOS, it looks to BUY the retracement.
After a bearish BOS, it looks to SELL the retracement.
Risk Management:
Stop Loss is placed at the start of the leg (the 1.0 level).
Take Profit is placed at a user-defined level (defaulting to the 0.0 level, with extension options).
Includes an option to move the stop loss to break-even after the trade has moved a certain distance in profit.
How to Use
Asset Selection: This strategy is designed for cryptocurrency markets. Its use of percentage-based order sizing is not suitable for tick-based markets like futures.
Swing Settings: Adjust the "Entry Swing" and "Validator" strengths to match the volatility and timeframe of the asset you are trading. Higher numbers will result in fewer, more significant setups.
Backtest: Use the Strategy Tester to optimize the "FIB Entry Level," "Take Profit Level," and "Swing Sensitivity" to find the best settings for your specific market and timeframe.
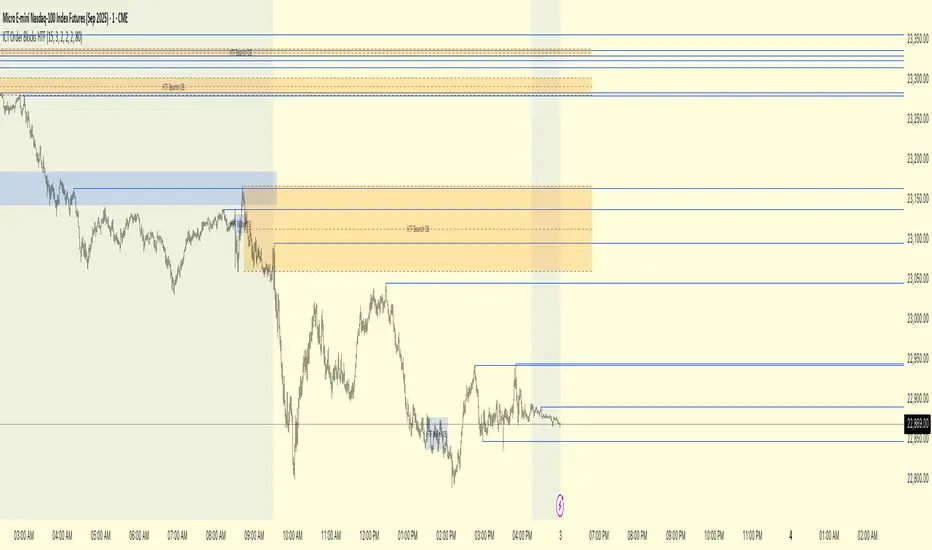
ICT Order Blocks HTFICT Order Blocks HTF (with Parent Swing Confirmation)
This indicator is a powerful tool designed to identify high-probability Higher-Timeframe (HTF) Order Blocks by confirming them with significant liquidity sweeps on your trading chart. It combines two core ICT (Inner Circle Trader) concepts to filter out noise and highlight only the most sensitive areas.
The Core Concept: A High-Probability Model
The most powerful trading setups often occur when a significant event on a lower timeframe happens at a key area on a higher timeframe. This indicator automates that analysis by looking for a specific confluence:
A Liquidity Sweep (LTF): First, it identifies a "Parent Swing" on your current chart. This is a significant swing high (BSL - Buy Side Liquidity) or swing low (SSL - Sell Side Liquidity) that has been validated by a market structure shift. These are the key liquidity pools the market targets.
An Order Block (HTF): Separately, it looks at a higher timeframe of your choice (e.g., 15m, 1H) to find institutional order blocks—the last up or down candle before a strong move.
The Confluence: The magic happens here. The indicator will only draw an HTF order block on your chart if it forms at the exact moment the price is interacting with one of the BSL or SSL liquidity pools from your current chart.
This dual confirmation provides a refined, high-probability signal, indicating that a major liquidity event is fueling a reaction from a significant HTF level.
What the Indicator Does
Identifies Parent Swings: In the background, it constantly tracks and identifies BSL (red lines) and SSL (green lines) on your chart.
Finds HTF Order Blocks: It looks for bullish (last down-candle) and bearish (last up-candle) order blocks on the higher timeframe you select.
Draws Confirmed Zones: It draws a Bullish OB (Blue Box) only when an HTF bullish order block forms at an SSL level. It draws a Bearish OB (Orange Box) only when an HTF bearish order block forms at a BSL level.
Marks Key Levels: Each order block is automatically drawn with dashed lines marking its high, low, and midpoint (50% level) for precise entry and risk management.
Real-Time Invalidation: The order blocks extend into the future and are tracked in real-time. If price closes through a block a specified number of times, the zone is considered invalid and will be dimmed, keeping your chart clean.
How to Use This Indicator
The primary use for this indicator is to identify high-probability entry zones.
When a Bullish Order Block (Blue) appears, it signals a potential area of demand where you might look for long entries.
When a Bearish Order Block (Orange) appears, it signals a potential area of supply where you might look for short entries.
The internal lines (high, low, midpoint) can be used for more precise entries or for setting stop-loss levels.
Settings
Higher Timeframe for Order Blocks: Choose the HTF you want the indicator to analyze for order blocks (e.g., 15m, 1H, 4H).
OB Invalidation Threshold: Set how many times price must close fully through an order block before it is considered invalid.
Parent Swing Settings: You can adjust the lookback periods and invalidation threshold for the BSL/SSL detection to match your trading style. A larger lookback will find more significant liquidity pools.
Disclaimer: This indicator is a tool to assist in technical analysis. It is not a standalone trading system and does not provide financial advice. Always use proper risk management and combine this tool with your own analysis and trading strategy.
Yuri Garcia Smart Money Strategy FULL (COMPLIANT)Yuri Garcia Smart Money Strategy FULL (Slope Divergence)
This script is not a mashup of random indicators. It is an original, coherent strategy that blends multiple institutional-grade tools to form a unified Smart Money trading system. Each component contributes to precise trade filtering, context, and confirmation — no element is decorative or redundant.
🔍 Strategy Logic: How It Works
This strategy integrates the following tools, each with a clearly defined role:
1. Volume Cluster Zones (Orange bands)
Identifies strong buy/sell areas using the highest volume nodes over a rolling window. These act as dynamic points of control where Smart Money is likely active.
2. HTF Zones (4H) (Purple band)
Defines institutional zones by using the 20-bar high/low on the 4-hour chart. These set the outer bounds for valid entries, ensuring alignment with larger market structure.
3. Wick Pullback Filter (Orange circle 🔶)
Detects exhaustion or absorption near zones. Used to confirm genuine rejection after liquidity sweeps or traps.
4. Cumulative Delta Confirmation (Red square 🟥)
Analyzes whether buyers or sellers are dominant using delta volume. Trades only trigger when volume confirms the intended direction.
5. Slope-Based Delta Divergence (Optional)
Detects hidden reversals between price and delta. This prevents late entries and provides early insight into potential trap reversals.
6. Liquidity Grab Detection (Blue diamond 🔷)
Marks smart money stop hunts — temporary price breaks beyond highs/lows, followed by reversal. Used as a confluence tool.
7. ATR-Based Dynamic Risk Control
The strategy uses ATR to calculate SL/TP dynamically. This allows position sizing to adjust to volatility, reducing overexposure in high-momentum conditions.
🎯 Entry Criteria
All the following conditions must be met:
✅ Price is inside a Volume Cluster Zone
✅ Price is within the HTF Institutional Zone
✅ Wick Pullback confirms reaction
✅ Delta confirms strength of buyers/sellers
✅ (Optional) Slope-based divergence signals hidden shift
✅ (Optional) Liquidity grab occurs
Only then will the strategy trigger an entry.
📈 Visual Legend (Symbols on Chart)
Symbol Description
🟣 Purple Zone HTF Support/Resistance zone (4H context)
🟠 Orange Zone Volume cluster from top 3 volume nodes
🔶 Orange Circle Wick Pullback confirmation
🟥 Red Square Delta Confirmation
🔷 Blue Diamond Liquidity Grab indicator
🔵 Blue X Price is inside HTF Zone
🔻 Red Triangle SHORT entry signal
🔺 Green Triangle LONG entry signal
These visuals make it easier to read the chart intuitively while understanding each condition’s role.
⚙️ Strategy Settings Justification
Default Qty: 2% of equity (sustainable risk)
RRR: 2.0 (adaptive to volatility)
ATR Multiplier: 2.0 for SL/TP
Commission: 0.1% used
Slippage: 2 points for realism
Minimum Trades for Testing: Designed to generate over 100 trades under normal backtest conditions
Dataset: Supports BTC, GOLD, Forex, Indices with realistic volatility and volume
These settings reflect a realistic use case for average retail traders and avoid overfitting or unrealistic returns.
📌 How to Use
Apply on 15-minute or 1-hour timeframe.
Wait for full alignment of all entry conditions.
Confirm visually or use included alerts for manual or bot execution.
SL and TP are automatically handled.
🚫 Important Notes
This script is original, not a remix or mashup of unrelated indicators.
Each component was designed to work in harmony, enhancing trade quality and confidence.
No external scripts are required to function.
Alert messages are pre-formatted for both manual and webhook use.

ICT OTE StrategyStrategy Overview
This strategy is designed to automate a specific trading setup based on the concepts of Inner Circle Trader (ICT). Its primary goal is to identify significant market structure swings, frame a Fibonacci retracement over the most recent price leg, and execute a trade when the price pulls back to a key user-defined level. It is a counter-trend entry strategy, meaning it looks to enter a trade during a pullback within an established trend.
How It Works: Step-by-Step
1. Swing Detection:
The strategy first identifies significant swing highs and swing lows.
A swing high is confirmed only if it's higher than a specific number of bars to its left and right (defined by "Left Strength" and "Right Strength" in the settings).
The same logic applies to swing lows, which must be lower than the bars around them. This filtering ensures only structurally important turning points are considered.
2. Defining the Trading Range:
Once a new swing is confirmed, the strategy defines the most recent dealing range.
If a new swing high forms, the range is drawn from the previous swing low up to this new high. This is considered a bullish leg.
If a new swing low forms, the range is drawn from the previous swing high down to this new low. This is considered a bearish leg.
3. Fibonacci Retracement & Trade Setup:
An automatic Fibonacci retracement tool is drawn over this newly defined dealing range. The 0.0 level is placed at the end of the move, and the 1.0 level is at the beginning.
The strategy then prepares to enter a trade based on this range.
4. Trade Execution:
Entry: A limit order is placed at a specific Fibonacci level within the range, waiting for the price to retrace. The default entry is the 0.618 level, but this can be changed in the settings.
For a bullish leg, it places a LONG (Buy) order, anticipating that the price will bounce from the retracement level.
For a bearish leg, it places a SHORT (Sell) order, anticipating that the price will be rejected from the retracement level.
Stop Loss: The Stop Loss is automatically placed at the 1.0 level of the Fibonacci range. This is the point where the original trade idea is invalidated.
Take Profit: The Take Profit is automatically placed at the 0.0 level of the Fibonacci range. This is the target at the end of the price leg.
Key Features & Customization
Automated Trade Logic: The entire process, from identifying the setup to placing the entry, stop loss, and take profit, is fully automated.
Visual Aid: The script draws the swing points and the Fibonacci retracement on the chart, so you can visually confirm the setups the strategy is taking.
Customizable Entry: You can change the "Entry Level" in the settings to test different Fibonacci levels, such as the Optimal Trade Entry (OTE) at 0.705.
Toggle Visuals: You can turn the Fibonacci drawing on or off to keep your chart clean while still allowing the strategy to run in the background.

THOT_GANNThis indicator is based on wd Gann square of 9 levels
i added 3 ema 50 100 and 200 to follow a right trend
also i added VWAP to understand buyer is aggressive or seller.
now study all together we can trade on breakout and reversal.
