Universal Breakout Strategy [KedArc Quant]Description:
A flexible breakout framework where you can test different logics (Prev Day, Bollinger, Volume, ATR, EMA Trend, RSI Confirm, Candle Confirm, Time Filter) under one system.
Choose your breakout mode, and the strategy will handle entries, exits, and optional risk management (ATR stops, take-profits, daily loss guard, cooldowns).
An on-chart info table shows live mode values (like Prev High/Low, Bollinger levels, RSI, etc.) plus P&L stats for quick analysis.
Use it to compare which breakout style works best on your instrument and timeframe, whether intraday, swing, or positional trading
🔑 Why it’s useful
* Flexibility: Switch between breakout strategies without loading different indicators.
* Clarity: On-chart info table displays current mode, relevant indicator levels, and live strategy P&L stats.
* Testing efficiency: Quickly A/B test different breakout styles under the same backtest environment.
* Transparency: Every trade is rule-based and displayed with entry/exit markers.
🚀 How it helps traders
* Lets you experiment with breakout strategies quickly without loading multiple scripts.
* Helps identify which breakout method fits your instrument & timeframe.
* Gives clear on-chart visual + statistical feedback for confident decision-making.
⚙️ Input Configuration
* Breakout Mode → choose which strategy to test:
* *Prev Day* → breakouts of yesterday’s High/Low.
* *Bollinger* → Upper/Lower BB pierce.
* *Volume* → Breakout confirmed with volume above average.
* *ATR Stop* → Wide range breakout using ATR filter.
* *Time Filter* → Breakouts inside defined session hours.
* *EMA Trend* → Breakouts only in EMA fast > slow alignment.
* *RSI Confirm* → Breakouts with RSI confirmation (e.g. >55 for longs).
* *Candle Confirm* → Breakouts validated by bullish/bearish candle.
* Lookback / ATR / Bollinger inputs → adjust sensitivity.
* Intrabar mode → option to evaluate breakouts using bar highs/lows instead of closes.
* Table options → show/hide info table, show/hide P&L stats, choose corner placement.
📈 Entry & Exit Logic
* Entry → occurs when breakout condition of chosen mode is met.
* Exit → default exits via opposite signals or optional stop/target if enabled.
* Session filter → optional auto-flat at session end.
* P&L management → optional daily loss guard, cooldown between trades, and ATR-based stop/take profit.
❓ FAQ — Choosing the best setup
Q: Which strategy should I use for which chart?
* *Prev Day Breakouts*: Best on indices, FX, and liquid futures with strong daily levels.
* *Bollinger*: Works well in range-bound environments, or crypto pairs with volatility compression.
* *Volume*: Good on equities where breakout strength is tied to volume spikes.
* *ATR Stop*: Suits volatile instruments (commodities, crypto).
* *EMA Trend*: Useful in trending markets (stocks, indices).
* *RSI Confirm*: Adds momentum filter, better for swing trades.
* *Candle Confirm*: Ideal for scalpers needing visual confirmation.
* *Time Filter*: For intraday traders who want signals only in high-liquidity sessions.
Q: What timeframe should I use?
* Intraday traders → 5m to 15m (Time Filter, Candle Confirm).
* Swing traders → 1H to 4H (EMA Trend, RSI Confirm, ATR Stop).
* Position traders → Daily (Prev Day, Bollinger).
* Breakout
A trade entry condition triggered when price crosses above a resistance level (for longs) or below a support level (for shorts).
* Prev Day High/Low
Formula:
Prev High = High of (Day )
Prev Low = Low of (Day )
* Bollinger Bands
Formula:
Basis = SMA(Close, Length)
Upper Band = Basis + (Multiplier × StdDev(Close, Length))
Lower Band = Basis – (Multiplier × StdDev(Close, Length))
* Volume Confirmation
A breakout is only valid if:
Volume > SMA(Volume, Length)
* ATR (Average True Range)
Measures volatility.
Formula:
ATR = SMA(True Range, Length)
where True Range = max(High–Low, |High–Close |, |Low–Close |)
* EMA (Exponential Moving Average)
Weighted moving average giving more weight to recent prices.
Formula:
EMA = (Price × α) + (EMA × (1–α))
with α = 2 / (Length + 1)
* RSI (Relative Strength Index)
Momentum oscillator scaled 0–100.
Formula:
RSI = 100 – (100 / (1 + RS))
where RS = Avg(Gain, Length) ÷ Avg(Loss, Length)
* Candle Confirmation
Bullish candle: Close > Open AND Close > Close
Bearish candle: Close < Open AND Close < Close
Win Rate (%)
Formula:
Win Rate = (Winning Trades ÷ Total Trades) × 100
* Average Trade P&L
Formula:
Avg Trade = Net Profit ÷ Total Trades
📊 Performance Notes
The Universal Breakout Strategy is designed as a framework rather than a single-asset optimized system. Results will vary depending on the chart, timeframe, and asset chosen.
On the current defaults (15-minute, INR-denominated example), the backtest produced 132 trades over the selected period. This provides a statistically sufficient sample size.
Win rate (~35%) is relatively low, but this is balanced by a positive reward-to-risk ratio (~1.8). In practice, a lower win rate with larger wins versus smaller losses is sustainable.
The average P&L per trade is close to breakeven under default settings. This is expected, as the strategy is not tuned for a single symbol but offered as a universal breakout framework.
Commissions (0.1%) and slippage (1 tick) are included in the simulation, ensuring realistic conditions.
Risk management is conservative, with order sizing set at 1 unit per trade. This avoids over-leveraging and keeps exposure well under the 5-10% equity risk guideline.
👉 Traders are encouraged to:
Experiment with inputs such as ATR period, breakout length, or Bollinger parameters.
Test across different timeframes and instruments (equities, futures, forex, crypto) to find optimal setups.
Combine with filters (trend direction, volatility regimes, or volume conditions) for further refinement.
⚠️ Disclaimer This script is provided for educational purposes only.
Past performance does not guarantee future results.
Trading involves risk, and users should exercise caution and use proper risk management when applying this strategy.
ВРЕМЯ

3CRGANG - SESSIONSOverview
The "3CRGANG - SESSIONS" indicator is a comprehensive tool for visualizing and monitoring major global trading sessions on TradingView charts. It highlights sessions for key exchanges—New York (NYSE), London (LSE), Frankfurt (FSE), Sydney (ASX), Tokyo (TSE), and Hong Kong (HKSE)—with customizable alerts, background coloring on low timeframes, and an interactive dashboard table. Designed for traders who operate across timezones or need session-based context, it accounts for holidays, half-days, and daylight saving time (DST) adjustments to provide accurate, real-time session status. On charts of 1-minute or lower, it overlays semi-transparent background colors to mark active sessions visually. Across all timeframes, a compact table at the bottom center displays session cells with dynamic coloring, and hovering over each reveals a tooltip with the weekly schedule, time until open/close, and holiday notes.
Built on Pine Script v6, this overlay indicator enhances situational awareness for forex, stocks, futures, and other assets by syncing with exchange-specific calendars. Its invite-only status ensures access to refined features that go beyond standard session tools, making it ideal for multi-market strategies.
How It's Built: Core Concepts and Calculations
The indicator leverages a modular approach to session detection, drawing from time-based logic for precision. Sessions are defined by fixed start/end times in their native timezones (e.g., NYSE: 0930-1600 America/New_York), adjusted dynamically for DST via timezone-aware functions. Key components include:
Session Activation Checks: Using helper functions like f_isSessionActive, it evaluates if the current bar or real-time timestamp falls within session hours, excluding weekends. Time is broken into minutes since midnight for comparisons, with special handling for overnight sessions (though none here cross midnight significantly).
Holiday and Half-Day Integration: Pre-loaded holiday maps for each exchange detect full closures or early closes (e.g., NYSE half-days end at custom times like 1300). If a half-day is identified, session end times are overridden, and pre-close periods recalculated (e.g., 30/5 minutes before adjusted close).
Pre-Open/Pre-Close Detection: Sub-sessions (e.g., 30 minutes before open) use similar logic to flag impending events, triggering only on the first bar of these windows via f_SessionOpen and f_SessionClose for efficiency.
Timestamp Calculations: Functions like f_SessionTimes and f_SessionTimesForTooltip compute open/close timestamps from timenow, adjusting for next trading day if after close or on weekends/holidays. This ensures forward-looking accuracy in tooltips.
Alert System: Configurable per-session, it fires notifications for pre-open (30/5 min), open, pre-close (30/5 min), close, and holidays. Alerts use alert.freq_once_per_bar to avoid spam, gated by market open status.
Visual Dashboard: A 6-column table is drawn with table.new, positioned via input (default bottom-center). Cells update colors based on state: active (session color at 75% opacity), pre-active (yellow), or inactive (gray). Tooltips via f_getSessionTooltip compile weekly schedules using f_formatScheduleEntry, which converts session times to user timezone, formats dates (DD/MM), weekdays (padded for alignment), and notes holidays/early closes. Time remaining uses f_formatTimeRemainingtooltip for human-readable countdowns (e.g., "1h:30m").
Background Coloring: On ≤1m timeframes, bgcolor applies session-specific hues (e.g., green for NYSE) at 90-95% transparency, configurable via light/dark themes.
User Customization: Inputs handle timezone (90+ options with DST), time format (standard/military, though not fully implemented in script), device (adjusts text padding/sizes), and theme (swaps colors for readability).
This setup combines timestamp arithmetic, conditional mapping, and array-based date iteration to create a robust, adaptive system that respects global market nuances without relying on simplistic built-in session strings.
Why It's Useful
Trading sessions drive liquidity, volatility, and price action—e.g., London open often sparks trends in forex, while NYSE influences equities. This indicator demystifies these by providing at-a-glance visuals and alerts, reducing the need for manual timezone conversions or external calendars. Background colors on low TFs help spot session overlaps (e.g., London/NY for high volume), while the table's tooltips offer quick weekly overviews, ideal for planning around holidays like Lunar New Year (HKSE-specific additions). Alerts prevent missing key events, and holiday detection avoids false expectations during closures.
For global traders, it minimizes errors in multi-asset setups; scalpers benefit from pre-open warnings, while swing traders use schedules for longer-term context. Its non-intrusive design (transparent on higher TFs) keeps charts clean, enhancing overall workflow efficiency.
How to Use It
Add to Chart: Access via invite-only on TradingView; apply to any timeframe, best on intraday for backgrounds or any for the dashboard.
Configure Inputs:
Time Settings: Select your timezone (e.g., UTC+3 Jerusalem) for accurate tooltip conversions; choose time format (standard preferred for readability).
Visualization Setup: Pick device (Desktop/Tablet/Mobile) for optimized text sizing/padding; select Light/Dark theme to match your chart.
Sessions Dashboard: Adjust table position if needed (default bottom-center).
Notifications Settings: Toggle alerts per exchange (e.g., enable NYSE for US focus).
Trading Application:
Visual Cues: On ≤1m charts, watch for color changes to enter/exit during active sessions. Hover table cells for schedules—current day highlighted, future/past separated, holidays marked (*).
Alerts: Set up in TradingView's alert manager for "alert() function calls only" to get notifications like "New York Session is about to Open in less than 5 minutes!"
Strategies: Use pre-open for setups (e.g., range breaks), closes for profit-taking. Combine with volume indicators during overlaps.
Best Practices: Test on demo; adjust alerts to avoid overload. For non-realtime, tooltips use current date for projections.
Why It's Unique and Worth Invite-Only Access
Unlike basic session highlighters that use rigid time strings or ignore holidays, this indicator integrates a custom holiday library with half-day adjustments and additional events (e.g., Buddha's Birthday for HKSE), ensuring precision across exchanges. Its tooltip system—generating timezone-converted weekly schedules with day adjustments, countdowns, and holiday notes—provides unmatched planning utility, while adaptive visuals (device/theme-aware) and granular alerts (pre-events included) elevate it beyond public tools. The logic for timestamp forward-projection, weekend skipping, and formatted entries builds on but significantly enhances built-in functions and educational examples.
This originality—protecting the proprietary blend of global calendar handling, alert gating, and interactive dashboards—justifies closed-source status. As invite-only, it delivers premium value through reliable, low-maintenance features that free traders from external apps, warranting access for those seeking an edge in session-based trading. Contact via TradingView for support.
Disclaimer
This indicator is a tool for analyzing market sessions and does not guarantee success. Trading involves risk, and past performance is not indicative of future results. Always use proper risk management.

Price Level HighlighterThis indicator is a minimalist and highly effective tool designed for traders who incorporate institutional concepts into their analysis. It automates the identification of key psychological price levels and adds a unique, dynamic layer of information to help you focus on the most relevant area of the market. Inspired by core principles of market structure and liquidity, it serves as a powerful visual guide for anticipating potential support and resistance.
The core idea is simple: specific price points, particularly those ending in round numbers or common increments, often act as magnets or barriers for price. While many indicators simply plot static lines, this tool goes further by intelligently highlighting the single most significant level in real-time. This dynamic feature allows you to quickly pinpoint where the market is currently engaged, offering a clear reference point for your trading decisions. It reduces chart clutter and enhances your focus on the immediate price action.
Features
Customizable Price Range: Easily define a specific Start Price and End Price to focus the indicator on the most relevant area of your chart, preventing unnecessary clutter.
Adjustable Increment: Change the interval of the lines to suit your trading style, from high-frequency increments (e.g., 10 points) for scalping to wider intervals (e.g., 50 or 100 points) for swing trading.
Intelligent Highlighting: A key feature that automatically identifies and highlights the single horizontal line closest to the current market price with a distinct color and thickness. This gives you an immediate visual cue for the most relevant price level.
Highly Customizabile: Adjust the line color, style, and width for both the main lines and the highlighted line to fit your personal chart aesthetic.
Usage
Apply the indicator to your chart.
In the settings, input your desired price range (Start Price and End Price) to match the market you are trading.
Set the Price Increment to your preferred density.
Monitor the chart for the highlighted line. This is your active price level and a key area of interest.
Combine this tool with other confirmation signals (e.g., order blocks, fair value gaps, liquidity pools) to build higher-probability trade setups.
Best Practices
Pairing: This tool is effective across all markets, including stocks, forex, indices, and crypto. It is particularly useful for volatile markets where price moves rapidly between psychological levels.
Mindful Analysis: Use the highlighted level as a reference point for your analysis, not as a standalone signal. A break above or below this level can signify a shift in market control.
Backtesting: Always backtest the indicator on your preferred market and timeframe to understand how it performs under different conditions.
Blitz Model
The Blitz indicator is a comprehensive market structure analysis tool designed specifically for the 4-hour timeframe. It identifies and visualizes key market movements including sweeps, fair value gaps (FVGs), and session-based liquidity levels.
1) Key Features :
A) Market Structure Analysis :
i) Sweep Detection: Identifies bullish and bearish sweeps of previous highs/lows.
ii) Double Purge Recognition: Detects when both bullish and bearish sweeps occur on the same candle.
iii) Fair Value Gap (FVG) Visualization: Displays imbalance zones with customizable box colors.
iV) Session-Based Analysis: Tracks Asian and London session highs/lows.
B) Multi-Timeframe Confirmations :
i) Layer 2 Validation System: Incorporates H1 and M15 timeframe confirmations.
ii) H1 Sweep Confirmations: Validates 4H signals with hourly sweep patterns.
iii) M15 Analysis: Includes both sweep and FVG confirmations from 15-minute timeframe.
C) Key Level Integration :
i) Daily 0.5 Level: Plots the midpoint of previous day's range with customizable styling.
ii) Session Liquidity: Identifies sweeps of Asian and London session extremes.
ii) FVG Interaction: Detects when sweeps occur near fair value gaps.
D) Customization Options :
i) Label Styling: Full control over label size, style, and colors for all signal types.
ii) Double Purge Customization: Separate styling options for double purge signals.
iii) Line Customization: Adjustable daily 0.5 line appearance (style, color, width).
iv) Display Controls: Toggle visibility for FVGs, labels, and confirmation history.
2) Technical Specifications
A) Timeframe Requirements :
i) Primary Timeframe: 4H only (indicator will show error on other timeframes).
ii) Multi-Timeframe Data: Analyzes H1 and M15 for confirmations.
iii) Session Times: Configurable start/end times.
B) Signal Validation Criteria :
Sweeps are validated when they occur at one or more of the following conditions:
i) FVG Zones: Price interaction with identified fair value gaps.
ii) Daily Midpoint: Proximity to the 50% level of previous day's range.
iii) Session Levels: Sweeps of Asian (19:00-01:00 NY) or London (02:00-05:00 NY) extremes.
C) Layer 2 Confirmation System :
i) H1 Confirmations (H1S): Sweep patterns on 1-hour charts within the 4H candle formation.
ii) M15 Sweep (M15S): 15-minute sweep confirmations.
iii) M15 FVG (M15F): 15-minute fair value gap formations.
3) Usage Guidelines :
A) Setup Instructions :
i) Apply to 4-hour charts only.
ii) Configure session times based on your analysis preferences.
iii) Customize label appearance and colors to match your chart theme.
iv) Enable/disable features based on your trading style.
B) Signal Interpretation :
i) Green Labels: Bullish sweeps with validation criteria met.
ii) Red Labels: Bearish sweeps with validation criteria met.
iii) Purple Labels: Double purge scenarios (both directions swept).
iv) Checkmark (✓): Indicates Layer 2 multi-timeframe confirmation present.
v) For double purge interpretations :
- Low & High means recent purge (just previous candle)
- Low & High means medium term purge (8H prior)
- Low & High means longer term purge (12H + prior)
4) Compatibility :
Max Objects: Supports up to 500 boxes and labels simultaneously.
5) Support & Updates :
This indicator represents educational concepts in market structure analysis. Users should thoroughly test and understand all signals before considering any practical application.
Disclaimer :
Always practice proper risk management. This is for educational purposes only and is not a financial advice.

Simple TPODisplays price distribution over time using Time Price Opportunities (TPO). Shows Point of Control (POC), Value Area High/Low (VAH/VAL) levels to identify key support/resistance zones and fair value areas. Includes customizable timeframes and price breakout alerts.

FX Sessions (DTS)FX Sessions (DST-Safe)
This indicator highlights the four main Forex trading sessions — Sydney, Tokyo, London, and New York — using the local timezone of each market.
• DST handled automatically: Sessions shift correctly when London or New York move clocks forward/back.
• Clear visualization: Light background shading for each session, with the London–New York overlap emphasized for peak liquidity.
• Customizable: Toggle individual sessions, labels, and the on-chart legend table.
• Intraday focus: Works best on lower timeframes (1m–1h) for identifying active trading hours and volatility windows.
Use this tool to instantly spot when liquidity and volatility are likely to increase, so you know where to focus your trading.

Astro ToolBox - CEAstro ToolBox - Community Edition
Welcome to the Astro ToolBox - Community Edition, a meticulously designed tool that brings precise planetary ephemeris data to the TradingView community. Inspired by W.D. Gann’s astrological principles, this feature-complete indicator empowers traders to integrate celestial data into their market analysis across equities, forex, commodities, and cryptocurrencies.
Overview
The Astro ToolBox - Community Edition delivers accurate ephemeris data, calculating the ecliptic longitude and latitude of celestial bodies for any selected date. Supporting the Sun, Moon, Mercury, Venus, Mars, Jupiter, Saturn, Uranus, Neptune, and Pluto, this script offers both heliocentric and geocentric perspectives with high precision (within 1-2 arc seconds), it provides traders with a robust dataset for time-based analysis, enhancing Gann-inspired trading strategies.
Key Features
Comprehensive Planetary Data : Displays longitude and optional latitude for ten celestial bodies (Sun, Moon, Mercury, Venus, Mars, Jupiter, Saturn, Uranus, Neptune, Pluto) on user-specified dates.
Heliocentric and Geocentric Modes : Toggle between heliocentric and geocentric calculations (Pluto is heliocentric-only; Moon is geocentric-only).
Zodiac Sign Integration : Optionally display the astrological sign and degree for the selected planet’s longitude, enhancing astrological analysis.
Customizable Display Options : Enable/disable exact time display, longitude rounding, and latitude visibility for tailored data presentation.
Flexible Table Positioning : Choose from nine screen positions (e.g., Top Right, Bottom Center) to place the ephemeris table, with customizable colors for seamless chart integration.
High-Precision Calculations : Utilizes optimized algorithms to deliver near-real-time planetary positions without relying on external APIs.
How It Works
Select a Date : Choose the date for which you want to view planetary data using the input field.
Choose a Planet : Select from the Sun, Moon, Mercury, Venus, Mars, Jupiter, Saturn, Uranus, Neptune, or Pluto.
Set Planetary Mode : Toggle between heliocentric or geocentric modes to align with your analysis approach.
Customize Output : Enable options like zodiac signs, sign degrees, latitude, or exact time, and adjust the table’s position and color.
View Results : The ephemeris data appears in a clear, customizable table on your chart, providing longitude, latitude (optional), and astrological sign details.
Analyze and Trade : Leverage the data to identify time-based turning points or correlations with price action, integrating Gann’s astrological principles into your strategy.
Get Started
As a gift to the TradingView community and Gann traders, the Astro ToolBox - Community Edition is offered free of charge. With no features locked, this tool provides full access to precise ephemeris data for astrological market analysis. Trade wisely and harness the power of celestial insights!

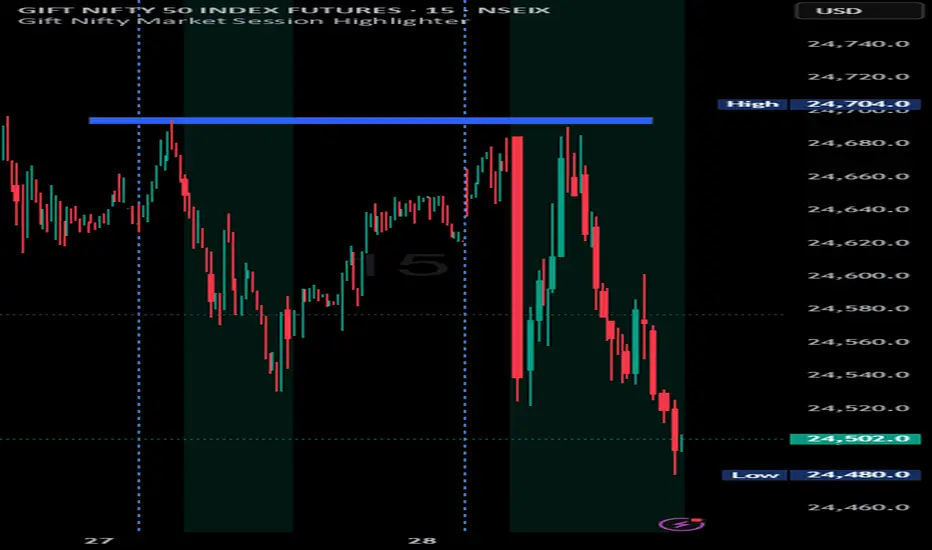
Indian market session on Gift Nifty chartsGift Nifty Market Session Highlighter
This indicator highlights the official Indian market session on Gift Nifty charts — from 9:15 AM to 3:30 PM IST. It shades the background during this time window so traders can instantly identify when the local market is open.
Features:
Marks 9:15 AM to 3:30 PM (IST) session on intraday charts.
Adjustable highlight color and transparency.
Works seamlessly across lower timeframes (1m, 5m, 15m, etc.).
Helps traders align Gift Nifty activity with NSE market hours.
Use Cases:
Quickly distinguish active market hours from overnight or global sessions.
Backtest trading strategies specific to Indian session volatility.
Improv
e focus on expiry-day setups and intraday opportunities.
Disclaimer:
This tool is provided for educational and informational purposes only. It is not financial advice, nor does it guarantee trading success. Always do your own research and consult a licensed financial professional before making investment decisions.
20/40/60Displays three consecutive, connected range boxes showing high/low price ranges for customizable periods. Boxes are positioned seamlessly with shared boundaries for continuous price action visualization.
Features
Three Connected Boxes: Red (most recent), Orange (middle), Green (earliest) periods
Customizable Positioning: Set range length and starting offset from current bar
Individual Styling: Custom colors, transparency, and border width for each box
Display Controls: Toggle borders, fills, and line visibility
Use Cases
Range Analysis: Compare volatility across time periods, spot breakouts
Support/Resistance: Use box boundaries as potential S/R levels
Market Structure: Visualize recent price development and trend patterns
Key Settings
Range Length: Bars per box (default: 20)
Starting Offset: Bars back from current to position boxes (default: 0)
Style Options: Colors, borders, and visibility controls for each box
Perfect for traders analyzing consecutive price ranges and comparing current conditions to recent historical periods.

Sessions [New_ProfitEfex]This script is use for displaying session in a very attractive an clarity way
You can give it a try for free

Time-Decaying Percentile Oscillator [BackQuant]Time-Decaying Percentile Oscillator
1. Big-picture idea
Traditional percentile or stochastic oscillators treat every bar in the look-back window as equally important. That is fine when markets are slow, but if volatility regime changes quickly yesterday’s print should matter more than last month’s. The Time-Decaying Percentile Oscillator attempts to fix that blind spot by assigning an adjustable weight to every past price before it is ranked. The result is a percentile score that “breathes” with market tempo much faster to flag new extremes yet still smooth enough to ignore random noise.
2. What the script actually does
Build a weight curve
• You pick a look-back length (default 28 bars).
• You decide whether weights fall Linearly , Exponentially , by Power-law or Logarithmically .
• A decay factor (lower = faster fade) shapes how quickly the oldest price loses influence.
• The array is normalised so all weights still sum to 1.
Rank prices by weighted mass
• Every close in the window is paired with its weight.
• The pairs are sorted from low to high.
• The cumulative weight is walked until it equals your chosen percentile level (default 50 = median).
• That price becomes the Time-Decayed Percentile .
Find dispersion with robust statistics
• Instead of a fragile standard deviation the script measures weighted Median-Absolute-Deviation about the new percentile.
• You multiply that deviation by the Deviation Multiplier slider (default 1.0) to get a non-parametric volatility band.
Build an adaptive channel
• Upper band = percentile + (multiplier × deviation)
• Lower band = percentile – (multiplier × deviation)
Normalise into a 0-100 oscillator
• The current close is mapped inside that band:
0 = lower band, 50 = centre, 100 = upper band.
• If the channel squeezes, tiny moves still travel the full scale; if volatility explodes, it automatically widens.
Optional smoothing
• A second-stage moving average (EMA, SMA, DEMA, TEMA, etc.) tames the jitter.
• Length 22 EMA by default—change it to tune reaction speed.
Threshold logic
• Upper Threshold 70 and Lower Threshold 30 separate standard overbought/oversold states.
• Extreme bands 85 and 15 paint background heat when aggressive fade or breakout trades might trigger.
Divergence engine
• Looks back twenty bars.
• Flags Bullish divergence when price makes a lower low but oscillator refuses to confirm (value < 40).
• Flags Bearish divergence when price prints a higher high but oscillator stalls (value > 60).
3. Component walk-through
• Source – Any price series. Close by default, switch to typical price or custom OHLC4 for futures spreads.
• Look-back Period – How many bars to rank. Short = faster, long = slower.
• Base Percentile Level – 50 shows relative position around the median; set to 25 / 75 for quartile tracking or 90 / 10 for extreme tails.
• Deviation Multiplier – Higher values widen the dynamic channel, lowering whipsaw but delaying signals.
• Decay Settings
– Type decides the curve shape. Exponential (default 1.16) mimics EMA logic.
– Factor < 1 shrinks influence faster; > 1 spreads influence flatter.
– Toggle Enable Time Decay off to compare with classic equal-weight stochastic.
• Smoothing Block – Choose one of seven MA flavours plus length.
• Thresholds – Overbought / Oversold / Extreme levels. Push them out when working on very mean-reverting assets like FX; pull them in for trend monsters like crypto.
• Display toggles – Show or hide threshold lines, extreme filler zones, bar colouring, divergence labels.
• Colours – Bullish green, bearish red, neutral grey. Every gradient step is automatically blended to generate a heat map across the 0-100 range.
4. How to read the chart
• Oscillator creeping above 70 = market auctioning near the top of its adaptive range.
• Fast poke above 85 with no follow-through = exhaustion fade candidate.
• Slow grind that lives above 70 for many bars = valid bullish trend, not a fade.
• Cross back through 50 shows balance has shifted; treat it like a micro trend change.
• Divergence arrows add extra confidence when you already see two-bar reversal candles at range extremes.
• Background shading (semi-transparent red / green) warns of extreme states and throttles your position size.
5. Practical trading playbook
Mean-reversion scalps
1. Wait for oscillator to reach your desired OB/ OS levels
2. Check the slope of the smoothing MA—if it is flattening the squeeze is mature.
3. Look for a one- or two-bar reversal pattern.
4. Enter against the move; first target = midline 50, second target = opposite threshold.
5. Stop loss just beyond the extreme band.
Trend continuation pullbacks
1. Identify a clean directional trend on the price chart.
2. During the trend, TDP will oscillate between midline and extreme of that side.
3. Buy dips when oscillator hits OS levels, and the same for OB levels & shorting
4. Exit when oscillator re-tags the same-side extreme or prints divergence.
Volatility regime filter
• Use the Enable Time Decay switch as a regime test.
• If equal-weight oscillator and decayed oscillator diverge widely, market is entering a new volatility regime—tighten stops and trade smaller.
Divergence confirmation for other indicators
• Pair TDP divergence arrows with MACD histogram or RSI to filter false positives.
• The weighted nature means TDP often spots divergence a bar or two earlier than standard RSI.
Swing breakout strategy
1. During consolidation, band width compresses and oscillator oscillates around 50.
2. Watch for sudden expansion where oscillator blasts through extreme bands and stays pinned.
3. Enter with momentum in breakout direction; trail stop behind upper or lower band as it re-expands.
6. Customising decay mathematics
Linear – Each older bar loses the same fixed amount of influence. Intuitive and stable; good for slow swing charts.
Exponential – Influence halves every “decay factor” steps. Mirrors EMA thinking and is fastest to react.
Power-law – Mid-history bars keep more authority than exponential but oldest data still fades. Handy for commodities where seasonality matters.
Logarithmic – The gentlest curve; weight drops sharply at first then levels off. Mimics how traders remember dramatic moves for weeks but forget ordinary noise quickly.
Turn decay off to verify the tool’s added value; most users never switch back.
7. Alert catalogue
• TD Overbought / TD Oversold – Cross of regular thresholds.
• TD Extreme OB / OS – Breach of danger zones.
• TD Bullish / Bearish Divergence – High-probability reversal watch.
• TD Midline Cross – Momentum shift that often precedes a window where trend-following systems perform.
8. Visual hygiene tips
• If you already plot price on a dark background pick Bullish Color and Bearish Color default; change to pastel tones for light themes.
• Hide threshold lines after you memorise the zones to declutter scalping layouts.
• Overlay mode set to false so the oscillator lives in its own panel; keep height about 30 % of screen for best resolution.
9. Final notes
Time-Decaying Percentile Oscillator marries robust statistical ranking, adaptive dispersion and decay-aware weighting into a simple oscillator. It respects both recent order-flow shocks and historical context, offers granular control over responsiveness and ships with divergence and alert plumbing out of the box. Bolt it onto your price action framework, trend-following system or volatility mean-reversion playbook and see how much sooner it recognises genuine extremes compared to legacy oscillators.
Backtest thoroughly, experiment with decay curves on each asset class and remember: in trading, timing beats timidity but patience beats impulse. May this tool help you find that edge.

Time Intervals [signBTC]This script is designed to visualize 6 auxiliary time intervals on the chart near the time axis. Each of these intervals can be configured by the user with the following options:
Interval duration: Any duration can be set (for example, 1 hour, 2 hours, 4 hours, etc.).
Interval color: Each time block can have its own color for better visual distinction.
Label: Users can add a custom label for each of the 6 intervals to indicate its purpose or highlight important features.
In the default configuration, the script automatically draws 6 equal four-hour intervals for each trading day, dividing each daily trading session into six parts—two for each of the three standard market sessions, or three per each of two major sessions (if considering only regular daytime and extended overnight trading).
This tool is particularly useful for traders who want to quickly navigate different time areas of the trading day, monitor individual parts of a session, or highlight specific time windows for strategy analysis. All script parameters (interval, color, and label for each block) are easily adjustable in the indicator's settings.

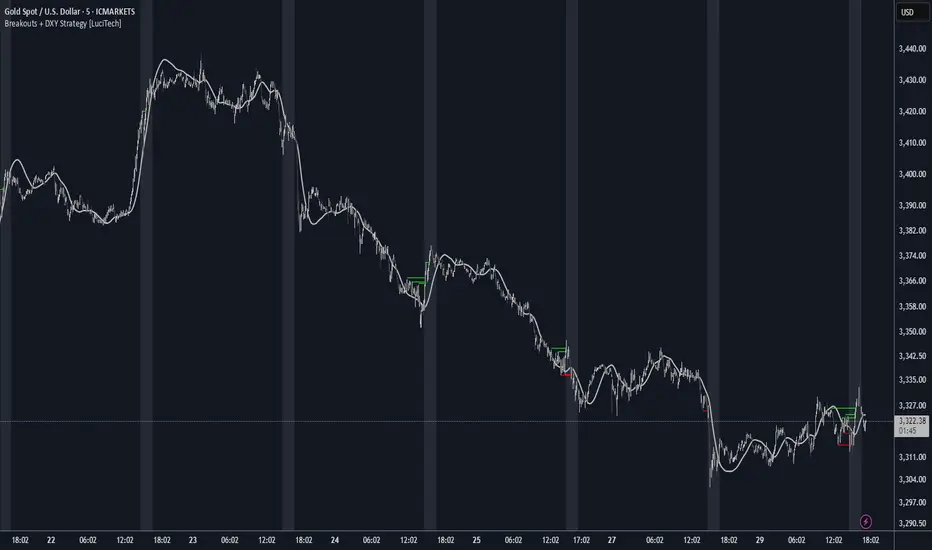
Breakouts With DXY Filter Strategy [LuciTech]This advanced breakout strategy combines pivot-based breakout detection with an innovative DXY (US Dollar Index) inverse correlation filter to enhance trade selection quality. The strategy identifies breakouts from recent pivot highs and lows while using DXY movements as a confirmation filter, based on the principle that USD strength/weakness often inversely correlates with other asset movements.
Key Features
Core Breakout Logic
- Pivot-Based Detection: Identifies breakouts above recent pivot highs (bullish) and below recent pivot lows (bearish)
- Customizable Lookback: Adjustable pivot length for different market conditions
- Visual Breakout Lines: Optional display of breakout levels with customizable colors
DXY Inverse Correlation Filter
- Smart USD Filter: Uses DXY movements to confirm breakout signals
- Inverse Logic: Long signals require DXY bearishness, short signals require DXY bullishness
- Threshold Control: Minimum DXY movement percentage required for signal confirmation
- Real-time DXY Data: Pulls live DXY data for accurate correlation analysis
Moving Average Filter
- Multiple MA Types: Support for SMA, EMA, WMA, VWMA, and HMA
- Trend Confirmation: Only takes trades in the direction of the selected moving average
- Customizable Parameters: Adjustable length and source for the moving average
Advanced Risk Management
- Multiple Stop Loss Types:
- ATR-based stops with customizable multiplier
- Candle-based stops using previous candle levels
- Fixed point-based stops
- Risk-Reward Optimization: Configurable risk-reward ratios (1:1 to 1:10)
- Breakeven Function: Automatic stop loss adjustment to breakeven after specified R-multiple
- Position Sizing: Percentage-based risk management with automatic position calculation
Time-Based Trading
- Session Filter: Trade only during specified time windows
- London Time Zone: Uses Europe/London timezone for consistency
- Visual Session Highlighting: Optional background fill for active trading hours
Alert System
- Webhook Integration: JSON-formatted alerts for automated trading
- Telegram Support: Pre-formatted messages for Telegram bot integration
- Multiple Formats: Standard, Telegram, and Concise Telegram alert options
- Real-time Notifications: Instant alerts on breakout signals
How It Works
1. Breakout Detection: The script continuously monitors for closes above recent pivot highs or below recent pivot lows
2. DXY Confirmation: When a breakout occurs, the script checks if DXY is moving in the opposite direction with sufficient momentum
3. MA Filter: If enabled, ensures the breakout aligns with the overall trend direction
4. Time Filter: Validates that the signal occurs within the specified trading hours
5. Risk Calculation: Automatically calculates position size based on the defined risk percentage and stop loss distance
6. Trade Execution: Places trades with predetermined stop loss and take profit levels
Unique Advantages
- Multi-Timeframe Approach: Combines asset-specific breakouts with broader USD market sentiment
- False Breakout Reduction: DXY filter helps eliminate breakouts that lack fundamental backing
- Comprehensive Risk Management: Multiple stop loss methods and automatic position sizing
- High Customization: Extensive parameters for different trading styles and market conditions
- Professional Alert System: Ready for automated trading integration
Vertical Time Marker Configurable (VTMC)# Vertical Time Marker Configurable (VTMC)
## Overview
The Vertical Time Marker Configurable (VTMC) is a powerful PineScript v6 indicator designed to help traders quickly identify key market times across their entire chart history. Instead of hovering over candles to check timestamps, VTMC draws clear vertical lines with customizable labels at your specified times, making it easy to spot important market sessions, news events, or personal trading windows at a glance.
## Key Features
### ⏰ Flexible Time Selection
- Set any time using an intuitive time picker (defaults to 8:30 AM Central Time)
- Automatically draws lines at your specified time across all historical data
- Perfect for marking market opens, closes, news releases, or personal trading times
### 🎨 Full Visual Customization
- **Line Color**: Choose any color (defaults to white for maximum visibility)
- **Line Style**: Solid, dashed, or dotted options
- **Line Width**: Adjustable from 1-10 pixels
- **Opacity Control**: Precise opacity slider (0-100%) for both line and text
### 🏷️ Smart Text Labels
- **Preset Options**: New York Open, New York Close, London Open, London Close, Asia Open, Asia Close
- **Custom Labels**: Enter any text for personalized marking (news events, trading windows, etc.)
- **Configurable Text**: Adjustable size (8-20px), color, and opacity
- **Smart Positioning**: Text appears just above the price action for clear visibility
### 📊 Professional Display
- Lines extend fully from top to bottom of chart
- Clean, non-intrusive design that doesn't clutter your analysis
- Works on any timeframe and market
- Historical lines persist across all chart data
## Perfect For
### Market Session Traders
- Mark key session opens and closes
- Identify overlap periods between major markets
- Track session-specific price behavior patterns
### News Traders
- Mark important economic releases (FOMC, NFP, etc.)
- Create visual reminders for scheduled events
- Track market reaction patterns around news times
### Institutional Flow Traders
- Identify key institutional activity times
- Mark order block formation periods
- Track smart money movement windows
### Personal Trading Systems
- Mark your optimal trading hours
- Create visual discipline for trading windows
- Track performance during specific time periods
## Why VTMC?
Unlike hardcoded session indicators that only work for specific markets, VTMC gives you complete flexibility to mark ANY time that matters to your trading strategy. Whether you're tracking "MY Trading Window" from 9:30-10:30 AM or marking custom news events, VTMC adapts to your specific needs.
The indicator eliminates the constant need to hover over candles to check times, instead providing instant visual reference points across your entire chart. This makes pattern recognition, backtesting, and trade timing significantly more efficient.
## Usage Tips
- Use multiple instances for different time zones or events
- Combine with other indicators for comprehensive market timing
- Customize colors to match your chart theme
- Use custom labels for personalized trading reminders
*Built with precision in PineScript v6 for reliable performance and modern TradingView compatibility.*
Custom Opening TimesThis indicator displays custom opening levels on your chart. Define multiple opening times, each with its own customizable style. Display these levels as horizontal lines at the opening price, or as vertical lines to mark the opening time.
Custom Opening Times
4 Independent Groups with 4 custom opening levels each
Set any custom opening time (displayed in New York Local Time)
Choose between Opening Price lines, Vertical time markers, or Both
Cutoff Times: Stop extending lines after specified times
Higher Timeframe Levels
5 Configurable HTF levels supporting any timeframe
Display opening prices from Daily, Weekly, Monthly, Quarterly, and custom timeframes
Show Previous High/Low levels from higher timeframes

Gann Single Square Swing Trading System with Gann AnglesGann Single Square Swing Trading System
This script automatically detects "squares" - geometric patterns where price movement equals time movement. When price moves the same distance as the number of bars (time), it creates powerful support/resistance levels based on Gann theory.
Key Visual Elements
• Box: The detected square pattern
• Dark Blue Line (50%): Most important trading level
• Green Lines: Profit target levels (125%, 150%)
• Red Lines: Stop loss levels (-25%, -50%)
• Colored Angle Lines: Gann angles for trend direction
• Quality Score: Blue label showing setup strength (aim for 70%+)
Simple Trading Rules
LONG Trades (Green 🟢 Square)
1. Entry: Buy when price touches the dark blue 50% line from above
2. Stop Loss: Place below the red -25% line
3. Take Profit: Exit at green 125% line (first target) or 150% line (second target)
SHORT Trades (Red 🔴 Square)
1. Entry: Sell when price touches the dark blue 50% line from below
2. Stop Loss: Place above the red -25% line
3. Take Profit: Exit at green 125% line (first target) or 150% line (second target)
Entry Checklist
✅ Square quality score > 70%
✅ Price touches 50% level (dark blue line)
✅ Volume above average (if volume filter enabled)
✅ Clear square formation visible
Alerts
The script generates automatic alerts when price reaches the 50% trading level. Enable alerts in TradingView to get notified of setups.
Bottom Line: Wait for the alert → Check quality score → Enter at 50% level → Set stop at red line → Take profit at green line.

Angled Gann Time-Price Squares with S/RThis is a Pine Script indicator that implements Angled Gann Time-Price Squares based on W.D. Gann's trading theory. Here's what it does:
Core Functionality
Detects pivot highs and lows using a configurable lookback period
Creates angled squares by connecting pivot points to current price action when specific geometric conditions are met
Validates square formation by checking if the price movement follows proper Gann angles (typically 45°, 135°, etc.) within a tolerance range
Key Features
Real-time square tracking: Shows both completed squares and forming squares in progress
Support/Resistance levels: Automatically generates S/R lines from:
Square edge extensions
Diagonal extensions (pivot centers)
Quarter/half levels within squares (25%, 50%, 75%)
Visual feedback: Color-coded squares (green for up, red for down, orange for forming)
Projection lines: Predicts where squares might complete based on Gann angle theory
Gann Theory Application
The indicator follows Gann's principle that time and price move in geometric harmony. It looks for price movements that form perfect squares when plotted on a chart, where the diagonal of the square represents the natural flow of price and time at specific angles.
The generated support/resistance levels are particularly valuable because they're based on completed geometric patterns rather than just horizontal price levels, making them potentially more significant according to Gann methodology.

Non-Lagging Longevity Zones [BigBeluga]🔵 OVERVIEW
A clean, non-lagging system for identifying price zones that persist over time—ranking them visually based on how long they survive without being invalidated.
Non-Lagging Longevity Zones uses non-lagging pivots to automatically build upper and lower zones that reflect key resistance and support. These zones are kept alive as long as price respects them and are instantly removed when invalidated. The indicator assigns a unique lifespan label to each zone in Days (D), Months (M), or Years (Y), providing instant context for historical relevance.
🔵 CONCEPTS
Non-Lag Pivot Detection: Detects upper and lower pivots using non-lagging swing identification (highest/lowest over length period).
h = ta.highest(len)
l = ta.lowest(len)
high_pivot = high == h and high < h
low_pivot = low == l and low > l
Longevity Ranking: Zones are preserved as long as price doesn't breach them. Levels that remain intact grow in visual intensity.
Time-Based Weighting: Each zone is labeled with its lifespan in days , emphasizing how long it has survived.
duration = last_bar_index - start
days_ = int(duration*(timeframe.in_seconds("")/60/60/24))
days = days_ >= 365 ? int(days_ / 365) : days_ >= 30 ? int(days_ / 30) : days_
marker = days_ >= 365 ? " Y" : days_ >= 30 ? " M" : " D"
Dynamic Coloring: Older zones are drawn with stronger fill, while newer ones appear fainter—making it easy to assess significance.
Self-Cleaning Logic: If price invalidates a zone, it’s instantly removed, keeping the chart clean and focused.
🔵 FEATURES
Upper and Lower Zones: Auto-detects valid high/low pivots and plots horizontal zones with ATR-based thickness.
Real-Time Validation: Zones are extended only if price stays outside them—giving precise control zones.
Gradient Fill Intensity: The longer a level survives, the more opaque the fill becomes.
Duration-Based Labeling: Time alive is shown at the root of each zone:
• D – short-term zones
• M – medium-term structure
• Y – long-term legacy levels
Smart Zone Clearing: Zones are deleted automatically once invalidated by price, keeping the display accurate.
Efficient Memory Handling: Keeps only the 10 most recent valid levels per side for optimal performance.
🔵 HOW TO USE
Track durable S/R zones that survived price tests without being breached.
Use longer-lived zones as high-confidence confluence areas for entries or targets.
Observe fill intensity to judge structural importance at a glance .
Layer with volume or momentum tools to confirm bounce or breakout probability.
Ideal for swing traders, structure-based traders, or macro analysis.
🔵 CONCLUSION
Non-Lagging Longevity Zones lets the market speak for itself—by spotlighting levels with proven survival over time. Whether you're trading trend continuation, mean reversion, or structure-based reversals, this tool equips you with an immediate read on what price zones truly matter—and how long they've stood the test of time.

Gann Octave 8 - Professional V 1.0Gann Octave 8 Indicator:
Core Concept: This indicator divides the price range between highest high and lowest low into 8 equal parts (octaves), creating support/resistance levels based on W.D. Gann's trading principles.
Key Components:
1. Price Range Calculation:
o Finds highest high and lowest low over a lookback period (default 50 bars)
o Divides this range into 8 equal segments (12.5% each)
2. 8 Octave Levels:
o 0% (Low Support) - Strongest support
o 12.5%, 25%, 37.5% - Minor levels
o 50% (CRITICAL) - Most important level
o 62.5%, 75%, 87.5% - Minor levels
o 100% (High Resistance) - Strongest resistance
3. Gann Angles: Projects trend lines from high/low points at various angles (1x1, 2x1, 1x2, etc.)
4. Visual Features:
o Color-coded levels
o Information table showing current position
o Background highlighting when near critical levels
o Trend analysis (bullish/bearish zones)
Trading Strategy
Entry Signals:
BULLISH TRADES:
• Price crosses above 50% level → Strong buy signal
• Price bounces from 25% or 37.5% levels → Support bounce
• Price in upper zone (above 50%) → Bullish bias
BEARISH TRADES:
• Price crosses below 50% level → Strong sell signal
• Price rejects at 75% or 87.5% levels → Resistance rejection
• Price in lower zone (below 50%) → Bearish bias
Key Trading Rules:
1. 50% Level is Critical: Most important for trend direction
2. Zone Trading:
o Above 50% = Bullish zone (look for longs)
o Below 50% = Bearish zone (look for shorts)
3. Strength Levels:
o Above 75% or below 25% = Strong moves
o Near 100% (high) or 0% (low) = Extreme levels
Risk Management:
• Stop Loss: Place below previous octave level
• Take Profit: Target next octave level
• Position Size: Reduce size near extreme levels (0%, 100%)
Example Trade:
If price breaks above 50% level:
• Entry: Long position
• Stop: Below 37.5% level
• Target: 75% level
• Risk: Monitor for rejection at resistance levels
The indicator works best in trending markets and helps identify high-probability reversal zones.
Works for both Stocks & Derivatives. Experiment with code and share your feedback in comments..

Gann Ultimate Time-Price Squares Method V 1.0This Script is an outcome of my Passion towards Gann Theory and his Methodology towards Trading.
The Script is still Evolving.So wait for more updates....
# Complete Trading Guide: Gann Time-Price Squares Indicator
## 🎯 Core Trading Philosophy
**Gann's Key Principle**: "When time and price come together, a change in trend occurs."
Your indicator identifies these critical moments where **Time = Price**, creating high-probability trading opportunities.
---
## 📊 Setup & Configuration
### Recommended Settings by Timeframe
| Timeframe | Pivot Lookback | Min Price Move | Tolerance | Use Case |
|-----------|---------------|----------------|-----------|----------|
| **1-5 min** | 5-8 bars | 0.5-1.0 | 1.0-2.0 | Scalping |
| **15-30 min** | 8-12 bars | 1.0-3.0 | 1.5-2.5 | Day Trading |
| **1-4 hour** | 10-15 bars | 2.0-5.0 | 2.0-3.0 | Swing Trading |
| **Daily** | 15-25 bars | 5.0-20.0 | 3.0-5.0 | Position Trading |
### Initial Setup Steps
1. **Add indicator** to your chart
2. **Set lookback period** based on your timeframe
3. **Adjust tolerance** - start with 2.0 and fine-tune
4. **Enable all visualizations** initially
5. **Position info table** where it doesn't block price action
---
## 🚀 Trading Strategies
### Strategy 1: Square Completion Reversal Trading
#### **Long Entry Setup**
```
CONDITIONS:
✅ Bullish square completes (green box appears)
✅ Info table shows "✅ COMPLETED" status
✅ Price bounces off square's bottom edge
✅ Volume increases on bounce
✅ RSI < 30 (oversold confirmation)
ENTRY: Market buy when price breaks above square's top edge
STOP: Below square's bottom edge (-2 ATR)
TARGET: Next resistance level or 1:2 Risk/Reward
```
#### **Short Entry Setup**
```
CONDITIONS:
✅ Bearish square completes (red box appears)
✅ Info table shows "✅ COMPLETED" status
✅ Price rejects square's top edge
✅ Volume increases on rejection
✅ RSI > 70 (overbought confirmation)
ENTRY: Market sell when price breaks below square's bottom edge
STOP: Above square's top edge (+2 ATR)
TARGET: Next support level or 1:2 Risk/Reward
```
### Strategy 2: Gann Angle Trend Following
#### **1x1 Angle (45°) - The Master Angle**
- **Most Important**: This is Gann's primary trend line
- **Bullish**: Price above 1x1 = uptrend intact
- **Bearish**: Price below 1x1 = downtrend intact
- **Break**: 1x1 angle break = major trend change
#### **Multi-Angle Confluence Trading**
```
STRONG BULLISH SIGNAL:
✅ Price above 1x1 angle (45°)
✅ Bouncing off 2x1 angle (support)
✅ Volume increasing
✅ Multiple angles pointing up
ENTRY: Buy on 2x1 angle bounce
STOP: Below 1x2 angle
TARGET: Next angle resistance
```
### Strategy 3: Projection Trading (Forming Squares)
#### **Anticipation Strategy**
```
SETUP IDENTIFICATION:
👀 Info table shows "⚡ FORMING" status
👀 Progress bar > 70%
👀 P/T Ratio approaching 1.00
👀 Price approaching projected completion zone
ENTRY PREPARATION:
- Set alerts for projected completion levels
- Prepare for reversal at projection zone
- Watch for volume confirmation
- Monitor momentum indicators
```
## 📈 Step-by-Step Trading Process
### Phase 1: Market Analysis (Before Trading)
1. **Check Market Trend**: Look at info table trend indicator
2. **Identify Active Pivots**: Note last significant high/low
3. **Assess Volatility**: High volatility = larger stops needed
4. **Review Completed Squares**: These become support/resistance zones
### Phase 2: Trade Setup Identification
1. **Monitor Forming Squares**: Watch progress bars in info table
2. **Check Gann Angles**: Are they supporting or opposing your bias?
3. **Confirm with Volume**: Look for volume spikes at key levels
4. **Set Alerts**: Use TradingView alerts for completion zones
### Phase 3: Trade Execution
1. **Wait for Confirmation**: Don't trade on projections alone
2. **Enter on Breakout**: Price breaking square boundaries
3. **Set Stops Immediately**: Use square edges as stop levels
4. **Scale Out**: Take partial profits at angle intersections
### Phase 4: Trade Management
1. **Trail Stops**: Use Gann angles as trailing stop levels
2. **Monitor Progress**: Watch for new square formations
3. **Exit Signals**: New squares in opposite direction
4. **Review Performance**: Analyze win/loss against square accuracy
---
## 🎯 High-Probability Setups
### Setup A: Double Confirmation
```
BULLISH EXAMPLE:
1. Bullish square completes at major support
2. Price bounces off 1x1 Gann angle
3. Volume surge confirms reversal
4. RSI divergence present
PROBABILITY: 75-80%
RISK/REWARD: 1:3 typical
```
### Setup B: Angle Breakout
```
BEARISH EXAMPLE:
1. Price breaks below 1x1 angle
2. Bearish square forming below break
3. Multiple angles now resistance
4. Volume confirms breakdown
PROBABILITY: 70-75%
RISK/REWARD: 1:2.5 typical
```
### Setup C: Time Cycle Convergence
```
REVERSAL EXAMPLE:
1. Square completion at time cycle high/low
2. Multiple Gann angles converging
3. Momentum divergence
4. Volume climax
PROBABILITY: 80-85%
RISK/REWARD: 1:4 possible
```
---
## ⚠️ Risk Management Rules
### Position Sizing
- **Conservative**: 1-2% risk per trade
- **Aggressive**: 2-3% risk per trade
- **Never exceed**: 5% total portfolio risk
### Stop Loss Guidelines
- **Completed Squares**: Opposite edge + 1 ATR
- **Gann Angles**: Below/above angle + 0.5 ATR
- **Projections**: 50% of square height
### Take Profit Targets
- **Target 1**: Next Gann angle (1:1 R/R)
- **Target 2**: Next completed square (1:2 R/R)
- **Target 3**: Major S/R level (1:3 R/R)
---
## 📊 Reading the Info Table for Trading
### Market Trend Section
```
📈 BULLISH → Look for long setups
📉 BEARISH → Look for short setups
➡️ NEUTRAL → Wait for direction
```
### Volatility Status
```
🔥 HIGH → Larger stops needed
⚡ ELEVATED → Normal stops
😴 LOW → Tighter stops possible
📊 NORMAL → Standard approach
```
### Square Progress Monitoring
```
✅ COMPLETED → Ready to trade
⚡ FORMING → Prepare for setup
🔥 ACTIVE → Monitor closely
⏳ WAITING → No immediate action
```
### P/T Ratio Interpretation
```
🎯 Perfect (0.8-1.2) → High probability setup
⚡ Good (0.6-1.4) → Moderate probability
⚠️ Watch (outside range) → Lower probability
```
---
## 🔄 Common Trading Scenarios
### Scenario 1: Trend Continuation
**Setup**: Price pulls back to completed square in uptrend
**Action**: Buy at square support with 1x1 angle confirmation
**Management**: Trail stop below each new square formation
### Scenario 2: Reversal Trading
**Setup**: Multiple squares complete at major S/R
**Action**: Fade the move when price rejects square edges
**Management**: Quick profits, tight stops
### Scenario 3: Breakout Trading
**Setup**: Price consolidates in square, then breaks out
**Action**: Trade breakout direction with volume confirmation
**Management**: Use opposite square edge as stop
---
## 📱 Alert Setup Recommendations
### Critical Alerts
1. **Square Completion**: "Gann Square Completed - Check for reversal"
2. **1x1 Angle Break**: "Master angle broken - Trend change possible"
3. **Projection Reached**: "Forming square at 90% - Prepare for reversal"
4. **Multi-Angle Touch**: "Price at angle confluence - High probability setup"
---
Remember: **Gann analysis is both art and science**. The indicator provides the mathematical framework, but successful trading requires patience, discipline, and continuous learning. Start with small positions while you master the methodology!

Enhanced Gann Time-Price SquaresEnhanced Gann Time-Price Squares Indicator
A comprehensive Pine Script indicator that identifies and visualizes W.D. Gann's time-price square formations on your charts. This tool helps traders spot potential market turning points where time and price movements align according to Gann's legendary market theories.
Key Features:
Automatic Square Detection - Identifies completed squares where price movement equals time movement
Future Projections - Shows forming squares with projected completion points
Pivot Integration - Automatically detects pivot highs/lows as square starting points
Visual Clarity - Clean box outlines with customizable colors and styles
Smart Filtering - Prevents overlapping squares and includes minimum move thresholds
Real-time Status - Information table showing current square formations
How to Use:
The indicator draws boxes when price moves from pivot points equal the time elapsed (number of bars). Green squares indicate upward movements, red squares show downward movements. Dashed lines show forming squares, while dotted lines project where they might complete.
Settings:
Adjust pivot sensitivity and minimum price moves
Customize tolerance for time-price matching
Toggle projections, labels, and visual elements
Fine-tune colors and line styles
Perfect for Gann theory practitioners and traders looking for time-based market analysis. The squares often coincide with significant support/resistance levels and potential reversal points.
Compatible with all timeframes and instruments.
More updates to follow
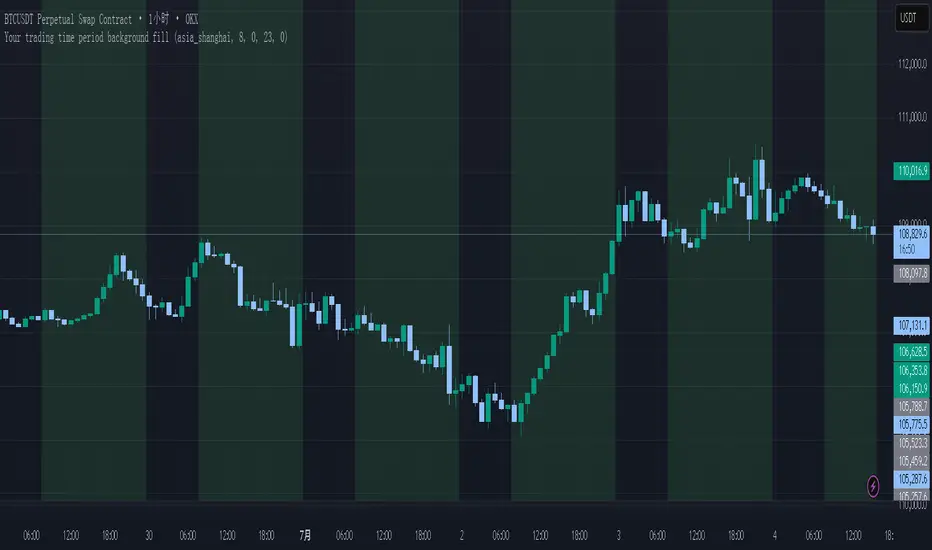
Your trading time period background fillThis script allows you to add background highlights to charts during any regional trading session, customize your own trading time, and is precise and customizable yet simple and easy to use, making it more convenient to review transactions.
Support global mainstream time zones: The drop-down list includes 30 commonly used IANA time zones (default is Asia/Shanghai) (such as Asia/Shanghai, America/New_York, Europe/London, etc.), one-click switching, no need to manually calculate the time difference.
Fully localized time input: "Start hour/minute" and "End hour/minute" are filled in with the local time of the selected time zone. The end hour defaults to 23:00 and can be adjusted to 0-23 at will.
Accurate time difference splitting: The script internally splits the time zone offset into whole hours and remainder minutes (supports half-hour zones, such as UTC+5:30), and ensures that all parameters are integers when calling timestamp to avoid errors.
Dynamic background rendering: Each K-line is judged according to the UTC timestamp whether it falls within the set range. If it meets the time period, it will be marked with a semi-transparent green background, and it will return to its original state after crossing the time period, helping you to identify the opening, closing or active period of any market at a glance.
Wide range of scenarios: It can be used for time-sharing highlighting of all-weather varieties of foreign exchange and cryptocurrency, and can also be used in conjunction with backtesting and timing strategies to only send signals during the active period of the target market, greatly improving trading efficiency and strategy accuracy.
Just select the region and set the time, and the script will automatically complete all complex time zone conversions and drawing, allowing you to focus on the transaction itself.
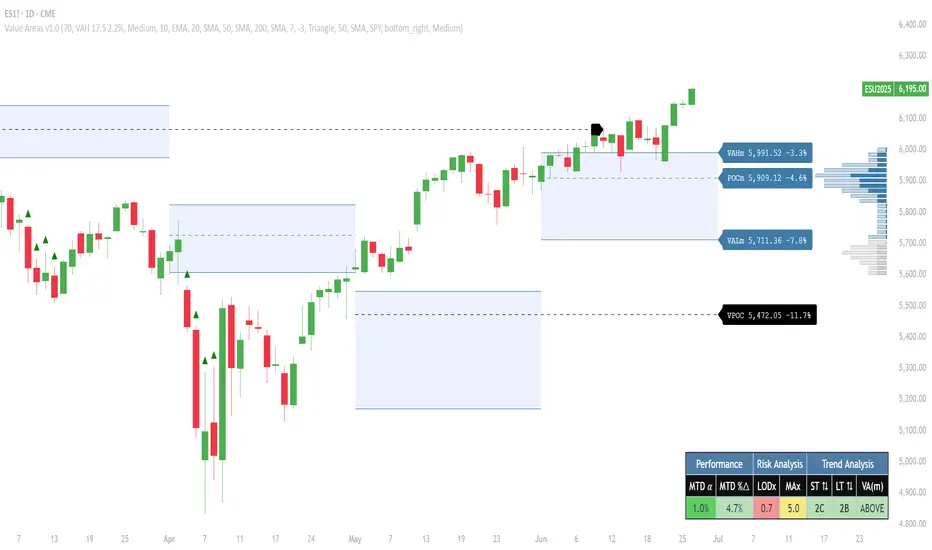
Pristine Value Areas & MGIThe Pristine Value Areas indicator enables users to perform comprehensive technical analysis through the lens of the market profile in a fraction of the time! 🏆
A Market Profile is a charting technique devised by J. Peter Steidlmayer, a trader at the Chicago Board of Trade (CBOT), in the 1980's. He created it to gain a deeper understanding of market behavior and to analyze the auction process in financial markets. A market profile is used to analyze an auction using price, volume, and time to create a distribution-based view of trading activity. It organizes market data into a bell-curve-like structure, which reveals areas of value, balance, and imbalance.
💠 How is a Value Area Calculated?
A value area is a distribution of 68%-70% of the trading volume over a specific time interval, which represents one standard deviation above and below the point of control, which is the most highly traded level over that period.
The key reference points are as follows:
Value area low (VAL) - The lower boundary of a value area
Value area high (VAH) - The upper boundary of a value area
Point of Control (POC) - The price level at which the highest amount of a trading period's volume occurred
If we take the probability distribution of trading activity and flip it 90 degrees, the result is our Pristine Value Area!
Market Profile is our preferred method of technical analysis at Pristine Capital because it provides an objective and repeatable assessment of whether an asset is being accumulated or distributed by institutional investors. Market Profile levels work remarkably well for identifying areas of interest, because so many institutional trading algorithms have been programmed to use these levels since the 1980's!
The benefits of using Market Profile include better trade location, improved risk management, and enhanced market context. It helps traders differentiate between trending and consolidating markets, identify high-probability trade setups, and adjust their strategies based on whether the market is in balance (consolidation) or imbalance (trending). Unlike traditional indicators that rely on past price movements, Market Profile provides real-time insights into trader behavior, giving an edge to those who can interpret its nuances effectively.
Virgin Point of Control (VPOC) - A point of control from a previous time period that has not yet been revisited in subsequent periods. VPOCs are great for identifying prior supply or demand zones.
Below is a great example of price reversing lower after taking out an upside VPOC
💠 Are all POCs Created Equal?
If POCs are used to gauge supply & demand zones at key levels, then a POC with higher volume should be viewed as more significant than a POC that traded lower volume, right? We created Golden POCs as a tool to identify high volume POCs on all timeframes.
Golden POC (GPOC) - A POC that traded the highest volume compared to prior POCs (proprietary to Pristine Capital)
We calculate value areas for the following time intervals based on the user selected timeframe:
5 Minute and 15 Minute Timeframes -> Daily Value Area
The daily value area paints the distribution of the PRIOR session's trading activity. The "d" in the label references for VAHd, POCd and VALd is a visual cue that value area shown is daily.
1 Hour Timeframe -> Weekly Value Area
The weekly value area paints the distribution of the PRIOR week's trading activity. The "w" in the label references for VAHw, POCw and VALw is a visual cue that value area shown is weekly.
1 Day Timeframe -> Monthly Value Area
The monthly value area paints the distribution of the PRIOR month's trading activity. The "m" in the label references for VAHm, POCm and VALm is a visual cue that value area shown is monthly.
1 Week Timeframe -> Yearly Value Area
The yearly value area paints the distribution of the PRIOR year's trading activity. The "y" in the label references for VAHy, POCy and VALy is a visual cue that value area shown is yearly.
💠 What is a developing value area?
The developing value area provides insight into the upcoming value area while it is still forming! It appears when 80% of the way through the current value area. As the end of a trading period approaches, it can make sense to start trading off the developing value area. When the time period flips, the developing value area becomes the active value area!
💠 Value Areas Trading Setups
Two popular market profile concepts are the bullish and bearish 80% rules. The concept is that there is an 80% probability that the market will traverse the entire relevant value area.
Bullish 80% Rule - If a security opens a period below the value area low , and subsequently closes above it, the bullish 80% rule triggers, turning the value area green. One can trade for a move to the top of the value area, using a close below the value area low as a potential stop!
In the below example, HOOD triggered the bullish 80% rule after it reclaimed the monthly value area!
HOOD proceeded to rally through the monthly value area and beyond in subsequent trading sessions. Finding the first stocks to trigger the bullish 80% rule after a market correction is key for spotting the next market leaders!
Bearish 80% Rule - If a security opens a period above the value area high , and subsequently closes below it, the bearish 80% rule triggers, turning the value area red. One can trade for a move to the bottom of the value area, using a close above the value area high as a potential stop!
ES proceeded to follow through and test the value area low before trending below the weekly value area
Value Area Breakouts - When a security is inside of value, the auction is in balance. When it breaks out from a value area, it could be entering a period of price discovery. One can trade these breaks out of value with tight risk control by setting a stop inside the value area! These breakouts can be traded on all chart timeframes depending on the timeframe of the individual trader. Combining multiple timeframes can result in even more effective trading setups.
RBLX broke out from the monthly value area on 4/22/25👇
RBLX proceeded to rally +62.78% in 39 trading sessions following the monthly VAH breakout!
💠 Market Generated Information to Improve Your Situational Awareness!
In addition to the value areas, we've also included stat tables with useful market generated information. The stats displayed vary based on the timeframe the user has up on their screen. This incentivizes traders to check the chart on multiple timeframes before taking a trade!
Metrics Grouped By Use Case
Performance
▪ YTD α - YTD Alpha (α) measures the risk-adjusted, excess return of a security over its user defined benchmark, on a year-to-date basis.
▪ MTD α - MTD Alpha (α) measures the risk-adjusted, excess return of a security over its user defined benchmark, on a month-to-date basis.
▪ WTD α - WTD Alpha (α) measures the risk-adjusted, excess return of a security over its user defined benchmark, on a week-to-date basis.
▪ YTD %Δ - Year-to-date percent change in price
▪ MTD %Δ - Month-to-date percent change in price
▪ WTD %Δ - Week-to-date percent change in price
Volatility
▪ ATR % - The Average True Range (ATR) expressed as a percentage of an asset's price.
▪ Beta - Measures the price volatility of a security compared to the S&P 500 over the prior 5 years (since inception if 5 years of data is not available)
Risk Analysis
▪ LODx - Low-of-day extension - ATR % multiple from the low of day (measures how extended a stock is from its low of day)
▪ MAx - Moving average extension - ATR % multiple from the user-defined moving average (measures how extended a security is from its moving average). Default moving average = 50D SMA
Why does MAx matter?
MAx measures the number of ATR % multiples a security is trading away from a key moving average. The default moving average length is 50 days.
MAx can be used to identify mean reversion trades . When a security trends strongly in one direction and moves significantly above or below its moving average, the price often tends to revert back toward the average.
Example, if the ATR % of the security is 5%, and the stock is trading 50% higher than the 50D SMA, the MAx would be 50%/5% = 10. A user might opt to take a countertrend trade when the MAx exceeds a predetermined level.
The MAx can also be useful when trading breakouts above or below the key moving average of your choosing. The lower the MAx, the tighter stop loss one can take if trading against that level.
Identifying an extreme price extension using MAx 👇
Price mean reverted immediately following the high MAx 👇
💠 Trend Analysis
The Trend Analysis section consists of short-term and long-term stage analysis data as well as the value area timeframe and price in relation to the value area.
Stage Analysis
▪ ST ⇅ - Short-term stage analysis indicator
▪ LT ⇅ - Long-term stage analysis indicator
Short-term and long-term stage analysis data is provided in the two rightmost columns of each table. The columns are labeled ST ⇅ and LT ⇅.
Why is Stage Analysis important? Popularized by Stan Weinstein, stage analysis is a trend following system that classifies assets into four stages based on price-trend analysis.
The problem? The interpretation of stage analysis is highly subjective. Based on the methodology provided in Stan Weinstein’s books, five different traders could look at the same chart, and come to different conclusions as to which stage the security is in!
We solved for this by creating our own methodology for classifying stocks into stages using moving averages. This indicator automates that analysis, and produces short-term and long-term trend signals based on user-defined key moving averages. You won’t find this in any textbook or course, because it’s completely unique to the Pristine trading methodology.
Our indicator calculates a short-term trend signal using two moving averages; a fast moving average, and a slow moving average. We default to the 10D EMA as the fast moving average & the 20D SMA as the slow moving average. A trend signal is generated based on where price is currently trading with respect to the fast moving average and the slow moving average. We use the signal to guide shorter-term swing trades.
In general, we want to take long trades in stocks with strengthening trends, and short trades in stocks with weakening trends. The user is free to change the moving averages based on their own short-term timeframe. Every trader is unique!
The same process is applied to calculate the long-term trend signal. We default to the 50D SMA as our fast moving average, and the 200D SMA as the slow moving average for the LT ⇅ signal calculation, but users can change these to fit their own unique trading style.
What is Stage 1?
Stage 1 identifies stocks that transitioned from downtrends, into bottoming bases.
Stage 1A - Bottom Signal: Marks the first day a security shows initial signs of recovery after a downtrend, with early indications of strength emerging.👇
Stage 1B - Bottoming Process: Identifies the ongoing phase where the security continues to stabilize and strengthen, confirming the base-building process after the initial signal.👇
Stage 1R - Failed Uptrend: Detects when a security that had entered an early uptrend loses momentum and slips back into a bottoming phase, signaling a failed breakout.👇
What is Stage 2?
Stage 2 identifies stocks that transitioned from bottoming bases to uptrends.
Stage 2A - Breakout: Marks the first day a security decisively breaks out, signaling the start of a new uptrend.👇
Stage 2B - Uptrend: Identifies when the security continues to trade in an established uptrend following the initial breakout, with momentum building but not yet showing full strength.👇
Stage 2C - Strong Uptrend: Detects when the uptrend strengthens further, with the security displaying clear signs of accelerating strength and buying pressure.👇
Stage 2R - Failed Breakdown: Detects when a security that had recently entered a corrective phase reverses course and reclaims its upward trajectory, moving back into an uptrend.👇
What is Stage 3?
Stage 3 identifies stocks that transitioned from uptrends to topping bases.
Stage 3A - Top Signal: Marks the first day a security shows initial signs of weakness after an uptrend, indicating the start of a potential topping phase.👇
Stage 3B - Topping Process: Identifies the period following the initial signal when the security continues to show signs of distribution and potential trend exhaustion.👇
Stage 3R - Failed Breakdown: Detects when a security that had entered a deeper corrective phase reverses upward, recovering enough strength to re-enter the topping phase.👇
What is Stage 4?
Stage 4 identifies stocks that transitioned from topping bases to downtrends.
Stage 4A - Breakdown: Marks the first day a security decisively breaks below key support levels, signaling the start of a new downward trend.👇
Stage 4B - Downtrend: Identifies when the security continues to trend lower following the initial breakdown, with sustained bearish momentum, though not yet fully entrenched.👇
Stage 4C - Strong Downtrend: Detects when the downtrend intensifies, with the security displaying clear signs of accelerating weakness and selling pressure.👇
Stage 4R - Failed Bottom: Detects when a security that had begun to show early signs of bottoming reverses course and resumes its decline, falling back into a downtrend.👇
Stage N/A - Recent IPO: Applies to stocks that recently IPO’ed and don’t have enough data to calculate all necessary moving averages.
Value Area
In Trend Analysis, the value area information is helpful to gauge price in relation to the value area.
▪ VA(y) - Categorizes the security based on the relation of price to the yearly value area
▪ VA(m) - Categorizes the security based on the relation of price to the monthly value area
▪ VA(w) - Categorizes the security based on the relation of price to the weekly value area
Value area states:
▪ ABOVE = Price above the value area high
▪ BELOW = Price below the value area low
▪ INSIDE = Price inside the value area
▪ Bull 80% = Bullish 80% rule in effect
▪ Bear 80% rule = Bearish 80% rule in effect
For example, in the chart above, VA(m) - ABOVE indicates a monthly value area and price is above the VAH.
💠 What Makes This Indicator Unique
There are many value area indicators, however...
Value Area
▪ Golden POC (GPOC) - This is a proprietary concept.
▪ Unique Label Customization
Pristine value areas often comprehensive and unique label customizations. Styles include options to display any combination of the following on your labels:
• Price levels associated with market profile levels
• % distance of market profile levels from security price
• ATR% extension of market profile levels from security price
Multi-Timeframe Analysis
Based on the chart timeframe, unique market generated information is shown to facilitate multi-timeframe analysis.
▪ Weekly Timeframe
On the weekly timeframe the focus is the bigger picture and the metrics reflect this perspective. Performance data includes YTD Alpha and YTD percent change in price. Volatility is measured using ATR % and the industry standard beta. Trend analysis for this higher timeframe include the 52-week range, which measures where a security is trading in relation to its 52wk high and 52wk low. Also included is the where price is in relation to yearly value area.
▪ Daily Timeframe
As one drills down to the daily timeframe, the performance metrics include MTD alpha and MTD percent change in price.
Risk analysis includes the low-of-day extension (LODx), which is the ATR % multiple from the low of the day, to measures how extended a stock is from its low of day. In addition, the moving average extension (MAx) is the ATR % multiple from the user-defined moving average, measures how extended a security is from its
moving average. The default moving average is the 50D SMA, however this can be customized in Settings.
Trend Analysis on the daily timeframe includes the Pristine Capital methodology for classifying stocks into stages using moving averages. Both short-term and long-term stage analysis data is included. Finally, price in relation to monthly value area is shown.
▪ Hourly Timeframe
An the hourly timeframe, performance metrics include WTD alpha and WTD percent change in price. Trend analysis includes the daily closing range (DCR) and price in relation to weekly value area.
💠 Settings and Preferences
💠 Acknowledgements
We'd like to thank @dgtrd, a TradingView Pine Wizard, for his insight on the finer details when working with volume profiles.