MA ExtensionThis indicator measures the vertical distance form the current close to the MA of your choice. I find that it does not work best as an oscillator, but it works well for providing early signals for taking profits when trend continuating. For example, if you go short due to a retracement to the MA (of your choice) take profits when a bearish trendline is broken (signalling the start of a bullish correction) that corresponds to the highs of the chart. The logic behind this indicator is that the breakouts of trendlines of an assets difference from an MA will precede corresponding breakouts of trendlines drawn on raw price. Kind of like Momentum, except it takes trend into account. Momentum has the same leading feature when it comes to drawing trendlines , but trendlines will be harder to draw due to the Momentum indicators oscillatory behavior.
Trendcontinuation

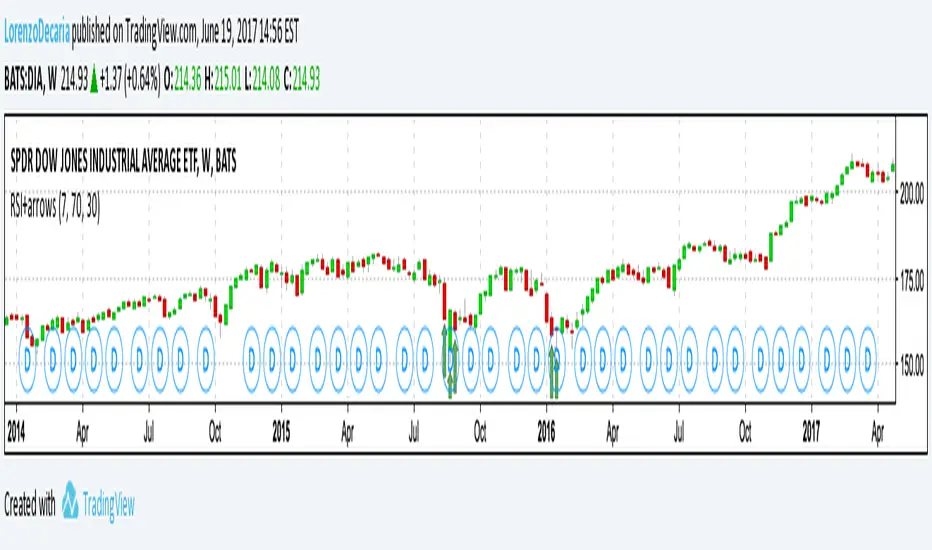
RSI based trend follower
I'm a fan of "less is more". This indicator doesn't mess up your chart with lines, symbols, moving averages or such; it doesn't even add another oscillator in a separate window, letting you focus only on what is most important: price action. It will silently do its job by plotting an arrow (upward arrow for long triggers and downward arrow for short triggers).
It works really great with strong trending markets on higher time frames, so it gives its best on Stocks on a daily/weekly frame; consider it a long term trading indicator.
Inline Institutional BiasTrend identification indicator. Estimates (higher-timeframe) market state using the "Institutional Bias" MA relationship (9ema - 18ema, 1D timeframe). A "reference" MA (30sma - TRI's preferred MA for Trade Location) is then plotted, and colour-coded according to higher-timeframe market state.
NOTE: All MA lengths, types, and the timeframe to use are configurable, but default as above. All MAs are calculated using the "IB timeframe", even when zoomed in.

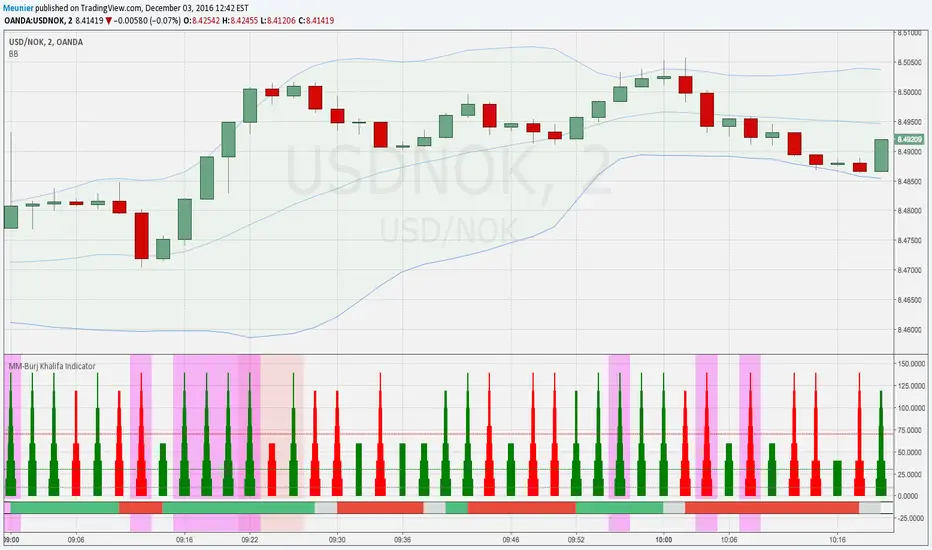
MM-Burj Khalifa Indicator
This indicator uses several signals to visualize a "perfect candle" to enter a trade.
It colors the background to identify the zones of interest (multiple configurable high or low RSI zones). Underlying is a trendbar with the current MACD direction. It's possible to tweak the indicator with a lot of options in the settings section (e.g. for which period you want a rising DM+-signal, etc.)
The indicator is using signals of:
--MACD
--RSI
--PVT
--ATR
--AD and DMI+/DMI-
When all 7 criterias are met it highlights the candle.
It also creates different colums with different height and width, so that you can see which signal is OK and which is maybe missing. When all signals are on GO you'll see a Burj-Khalifa-like figure. If not all signals are on GO you'see crippled versions.
To be clear:
it's not intended to detect trends or supertrends or reversals. It's purpose it's just to decide if this current candle is really going in the right direction. It doesn't prevent upcoming reversals in the opposite direction.
The Burj-Khalifa indicator could help to confirm the entry point of an trade which was already planned.
I'll come up with a more detailed documentation.
MM-Burj Khalifa IndicatorThis indicator uses several signals to visualize a "perfect candle" to enter a trade.
It colors the background to identify the zones of interest (multiple configurable high or low RSI zones). Underlying is a trendbar with the current MACD direction.
The indicator is using signals of:
--MACD
--RSI
--PVT
--ATR
--AD and DMI+/DMI-
When all 7 criterias are met it highlights the candle.
It also creates different colums with different height and width, so that you can see which signal is OK and which is maybe missing. When all signals are on GO you'll see a Burj-Khalifa-like figure. If not all signals are on GO you'see crippled versions.
To be clear:
it's not intended to detect trends or supertrends or reversals. It's purpose it's just to decide if this current candle is really going in the right direction.
The Burj-Khalifa indicator could help to confirm the entry point of an trade which was already planned.

SuperTrend Oscillator v3Version 3: Improved aesthetically, complete turnaround for the strategy with which to use this indicator.
Once again, thanks to BlindFreddy and ChrisMoody for the bits of code that were assembled into this indicator.
Make the chart yours using the share button for the indicator with barcolors functionality.
Changes from v2 and looking forward: Indicator now uses a 14 length SuperTrend with no ATR multiplier. This my preferred use and I'd be grateful to hear your case for a different length/multiplier. Removed the Bollinger Bands and retracement dots due to these being gimmicky and marginally useful. There may be a version 4 should a similar concept using a rate of change analysis turn out to be useful. I have also tried -in vain- to plot internal trend peaks as horizontal S/R levels. Please pm if you are willing to help in that respect.
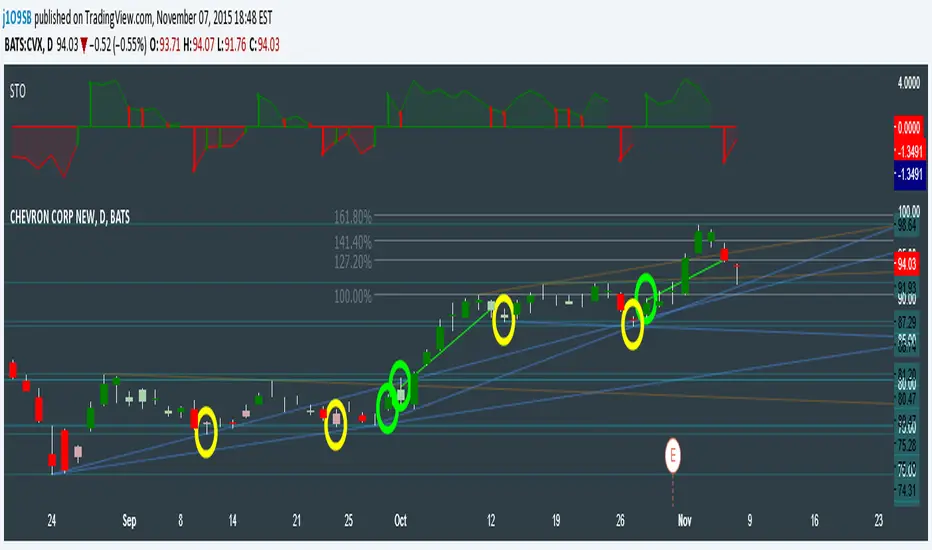
Strategy: The indicator will display the trend as a red/green area. It measures the spread between the closing price and the SuperTrend line, much like a CCI (close and ma). When the area contracts warning bars of the opposite trend color will warn of a reversal. When this happens, these areas will either be defended, reviving the trend, or will break, causing a trend flip. SuperTrend is unique in that breaks are typically large candles, and that its levels, especially on Weekly, Daily, Hourly, Minute timeframes, these levels will be defended (think similar to a 200sma or a 21ema). The STO making new highs within (internal) a trend is an overextension sign.
CVX Example: This is not a full analysis of CVX's stock , just an example potential trades. On the posted chart I used a weekly and a daily STO.
Long 1:The weekly showed warnings and then flipped. The daily made a double bottom, showed warnings and then flipped the daily STO at trendline support.
Long 2:The weekly still shows an uptrend, the daily made a weak break to downtrend and reversed back upwards at trendline support, forming a double bottom. Note the conservative exit when the STO made an internal new high.
Long 3: looking forward on CVX stock , the current downtrend made a weak break and is showing sings of reversal (pin bar) at horizontal support. Go long on flip of the daily (conservative) or flip of the hourly (aggressive).
SuperTrend OscillatorVersion 3: Improved aesthetically, complete turnaround for the strategy with which to use this indicator.
Once again, thanks to BlindFreddy and ChrisMoody for the bits of code that were assembled into this indicator.
Make the chart yours using the share button for the indicator with barcolors functionality.
Changes from v2 and looking forward: Indicator now uses a 14 length SuperTrend with no ATR multiplier. This my preferred use and I'd be grateful to hear your case for a different length/multiplier. Removed the Bollinger Bands and retracement dots due to these being gimmicky and marginally useful. There may be a version 4 should a similar concept using a rate of change analysis turn out to be useful. I have also tried -in vain- to plot internal trend peaks as horizontal S/R levels. Please pm if you are willing to help in that respect.
Strategy: The indicator will display the trend as a red/green area. It measures the spread between the closing price and the SuperTrend line, much like a CCI (close and ma). When the area contracts warning bars of the opposite trend color will warn of a reversal. When this happens, these areas will either be defended, reviving the trend, or will break, causing a trend flip. SuperTrend is unique in that breaks are typically large candles, and that its levels, especially on Weekly, Daily, Hourly, Minute timeframes, these levels will be defended (think similar to a 200sma or a 21ema). The STO making new highs within (internal) a trend is an overextension sign.
CVX Example: This is not a full analysis of CVX's stock, just an example potential trades. On the posted chart I used a weekly and a daily STO.
Long 1:The weekly showed warnings and then flipped. The daily made a double bottom, showed warnings and then flipped the daily STO at trendline support.
Long 2:The weekly still shows an uptrend, the daily made a weak break to downtrend and reversed back upwards at trendline support, forming a double bottom. Note the conservative exit when the STO made an internal new high.
Long 3: looking forward on CVX stock, the current downtrend made a weak break and is showing sings of reversal (pin bar) at horizontal support. Go long on flip of the daily (conservative) or flip of the hourly (aggressive).
