RSI Confirm Trend with Williams (W%R)RSI Confirm Trend with Williams (W%R)
This is the "RSI Confirm Trend with Williams (W%R)" indicator
This is a modification of the "RSI Trends" indicator by zzzcrypto123.
What Is the Relative Strength Index (RSI)?
The relative strength index (RSI) is a momentum indicator used in technical analysis. RSI measures the speed and magnitude of a security's recent price changes to evaluate overvalued or undervalued conditions in the price of that security.
What is Williams %R?
Williams %R, also known as the Williams Percent Range, is a type of momentum indicator that moves between 0 and -100 and measures overbought and oversold levels. The Williams %R may be used to find entry and exit points in the market. The indicator is very similar to the Stochastic oscillator and is used in the same way. It was developed by Larry Williams and it compares a stock’s closing price to the high-low range over a specific period, typically 14 days or periods.
How Does "RSI Confirm Trend with Williams (W%R)" work?
This indicator combines the momentum of both RSI and Williams %R by adding upper and lower thresholds. When the thresholds are broken, this indicator changes color from gray to either green or red.
What Are The Thresholds?
The default RSI thresholds are 55 and 45. These values are configurable.
The default Williams %R thresholds are 80 and 20. These values are configurable and made positive so it can be plotted against the RSI line.
How To Use?
When the RSI exceeded the upper/lower thresholds, the RSI line color will change from gray to lighter green/red color.
When the Williams %R exceeded the upper/lower thresholds, the RSI color will change to darker green/red color signifying a strong momentum in that direction.
When the RSI color is gray, this means the RSI and Williams %R thresholds are not broken which can also signify as no trend or consolidation.
The Williams %R line is not displayed by default but can be enabled using the checkbox provided in the Style tab.
This "RSI Confirm Trend with Williams (W%R)" indicator can be combined with other technical indicators to verify the idea behind this theory.
-----------------
Disclaimer
The information contained in this indicator does not constitute any financial advice or a solicitation to buy or sell any securities of any type.
My scripts/indicators/ideas are for educational purposes only!
Trendlineanalysis

TrendLine Toolkit w/ Breaks (Real-Time)The TrendLine Toolkit script introduces an innovating capability by extending the conventional use of trendlines beyond price action to include oscillators and other technical indicators. This tool allows traders to automatically detect and display trendlines on any TradingView built-in oscillator or community-built script, offering a versatile approach to trend analysis. With breakout detection and real-time alerts, this script enhances the way traders interpret trends in various indicators.
🔲 Methodology
Trendlines are a fundamental tool in technical analysis used to identify and visualize the direction and strength of a price trend. They are drawn by connecting two or more significant points on a price chart, typically the highs or lows of consecutive price movements (pivots).
Drawing Trendlines:
Uptrend Line - Connects a series of higher lows. It signals an upward price trend.
Downtrend Line - Connects a series of lower highs. It indicates a downward price trend.
Support and Resistance:
Support Line - A trendline drawn under rising prices, indicating a level where buying interest is historically strong.
Resistance Line - A trendline drawn above falling prices, showing a level where selling interest historically prevails.
Identification of Trends:
Uptrend - Prices making higher highs and higher lows.
Downtrend - Prices making lower highs and lower lows.
Sideways (or Range-bound) - Prices moving within a horizontal range.
A trendline helps confirm the existence and direction of a trend, providing guidance in aligning with the prevailing market sentiment. Additionally, they are usually paired with breakout analysis, a breakout occurs when the price breaches a trendline. This signals a potential change in trend direction or an acceleration of the existing trend.
The script adapts this methodology to oscillators and other indicators. Instead of relying on price pivots, which can only be detected in retrospect, the script utilizes a trailing stop on the oscillator to identify potential swings in real-time, you may find more info about it here (SuperTrend toolkit) . We detect swings or pivots simply by testing for crosses between the indicator and its trailing stop.
type oscillator
float o = Oscillator Value
float s = Trailing Stop Value
oscillator osc = oscillator.new()
bool l = ta.crossunder(osc.o, osc.s) => Utilized as a formed high
bool h = ta.crossover (osc.o, osc.s) => Utilized as a formed low
This approach enables the algorithm to detect trendlines between consecutive pivot highs or lows on the oscillator itself, providing a dynamic and immediate representation of trend dynamics.
🔲 Breakout Detection
The script goes beyond trendline creation by incorporating breakout detection directly within the oscillator. After identifying a trendline, the algorithm continuously monitors the oscillator for potential breakouts, signaling shifts in market sentiment.
🔲 Setup Guide
A simple example on one of my public scripts, Z-Score Heikin-Ashi Transformed
🔲 Settings
Source - Choose an oscillator source of which to base the Toolkit on.
Zeroing - The Mid-Line value of the oscillator, for example RSI & MFI use 50.
Sensitivity - Calibrates the Sensitivity of which TrendLines are detected, higher values result in more detections.
🔲 Alerts
Bearish TrendLine
Bullish TrendLine
Bearish Breakout
Bullish Breakout
As well as the option to trigger 'any alert' call.
By integrating trendline analysis into oscillators, this Toolkit enhances the capabilities of technical analysis, bringing a dynamic and comprehensive approach to identifying trends, support/resistance levels, and breakout signals across various indicators.

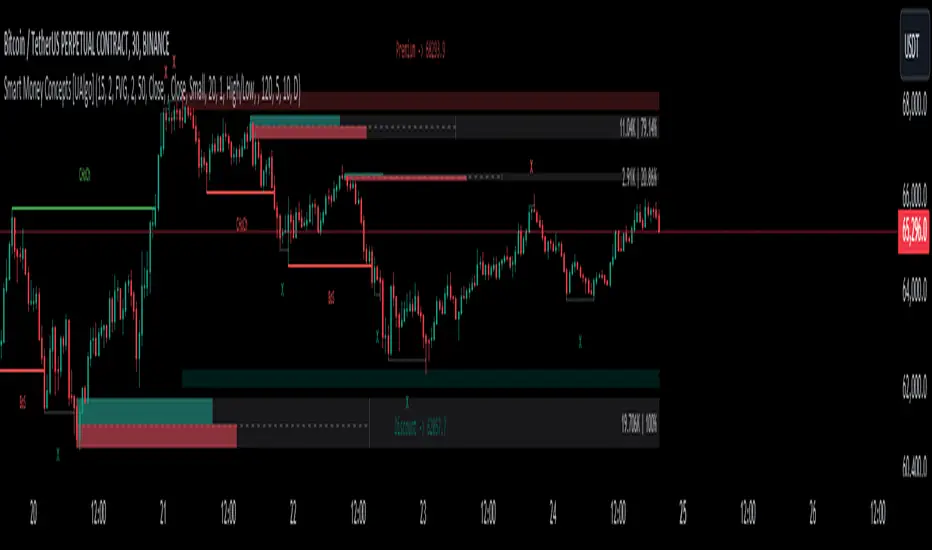
Smart Money Concepts [UAlgo]🔶 Description:
Smart Money Concepts (SMC) refer to a trading strategy that revolves around understanding and following the actions of institutional investors, such as banks and hedge funds, who are considered the “smart money” in the market. The concept is based on the idea that these institutions have more information and resources, and thus their market activities can indicate future market movements.
This script designed to be a tool that will automatically provide many features related to SMC concept for investors, offering a market structure analysis that includes the identification of order blocks, breaker blocks, and liquidity points. It also delineates premium and discount zones, highlights Fair Value Gaps (FVG), Volume Imbalance (VI) and Order Gap (OG) areas, providing users with a multifaceted view of market dynamics.
🔶 Key Features:
Market Structure Analysis : Simplifies the overview of market behavior, identifies market breakouts or trend continuation.
It detects the market structure as shown in the image below :
Order Blocks : Detects Order Blocks based on market structure analysis and volume characteristics. It draws these blocks and provides information such as volume.
Order Block Identification:
Breaker Blocks : Detects Breaker Blocks based on market structure analysis.
Breaker Block Identification:
When Order Block above is broken,
As you can see, it has now turned into a Bearish Breaker Block,
And it seems that the price is getting a reaction from this breaker block above.
Liquidity Sweeps : Tracks liquidity sweeps on both the buy and sell sides, offering traders a perspective on market momentum and potential shifts.
Multi-Timeframe Fair Value Gap (FVG), Volume Imbalance (VI), Order Gaps (OG) Detection : Detects Fair Value Gap (FVG), Volume Imbalance (VI) and Order Gaps (OG) based on different criteria such as price movements and volume characteristics. It marks these gaps/voids and provides visual cues for analysis.
Examle for FVG:
Premium & Discount Zone Analysis : Analyzes premium and discount zones, showing prices within these zones and highlighting equilibrium (0.5) levels.
Customizable Options : Provides various input parameters for customization, such as market structure length, sensitivity settings, display preferences, and mitigation methods.
Previous Key Levels : Identifies previous key levels include previous highs, lows, equilibrium points, and open prices across different timeframes such as daily, weekly, and monthly.
🔶 Disclaimer:
Use with Caution: This indicator is provided for educational and informational purposes only and should not be considered as financial advice. Users should exercise caution and perform their own analysis before making trading decisions based on the indicator's signals.
Not Financial Advice: The information provided by this indicator does not constitute financial advice, and the creator (UAlgo) shall not be held responsible for any trading losses incurred as a result of using this indicator.
Backtesting Recommended: Traders are encouraged to backtest the indicator thoroughly on historical data before using it in live trading to assess its performance and suitability for their trading strategies.
Risk Management: Trading involves inherent risks, and users should implement proper risk management strategies, including but not limited to stop-loss orders and position sizing, to mitigate potential losses.
No Guarantees: The accuracy and reliability of the indicator's signals cannot be guaranteed, as they are based on historical price data and past performance may not be indicative of future results.
ZigZag Library [TradingFinder]🔵 Introduction
The "Zig Zag" indicator is an analytical tool that emerges from pricing changes. Essentially, it connects consecutive high and low points in an oscillatory manner. This method helps decipher price changes and can also be useful in identifying traditional patterns.
By sifting through partial price changes, "Zig Zag" can effectively pinpoint price fluctuations within defined time intervals.
🔵 Key Features
1. Drawing the Zig Zag based on Pivot points :
The algorithm is based on pivots that operate consecutively and alternately (switch between high and low swing). In this way, zigzag lines are connected from a swing high to a swing low and from a swing low to a swing high.
Also, with a very low probability, it is possible to have both low pivots and high pivots in one candle. In these cases, the algorithm tries to make the best decision to make the most suitable choice.
You can control what period these decisions are based on through the "PiPe" parameter.
2.Naming and labeling each pivot based on its position as "Higher High" (HH), "Lower Low" (LL), "Higher Low" (HL), and "Lower High" (LH).
Additionally, classic patterns such as HH, LH, LL, and HL can be recognized. All traders analyzing financial markets using classic patterns and Elliot Waves can benefit from the "zigzag" indicator to facilitate their analysis.
" HH ": When the price is higher than the previous peak (Higher High).
" HL ": When the price is higher than the previous low (Higher Low).
" LH ": When the price is lower than the previous peak (Lower High).
" LL ": When the price is lower than the previous low (Lower Low).
🔵 How to Use
First, you can add the library to your code as shown in the example below.
import TFlab/ZigZagLibrary_TradingFinder/1 as ZZ
Function "ZigZag" Parameters :
🟣 Logical Parameters
1. HIGH : You should place the "high" value here. High is a float variable.
2. LOW : You should place the "low" value here. Low is a float variable.
3. BAR_INDEX : You should place the "bar_index" value here. Bar_index is an integer variable.
4. PiPe : The desired pivot period for plotting Zig Zag is placed in this parameter. For example, if you intend to draw a Zig Zag with a Swing Period of 5, you should input 5.
PiPe is an integer variable.
Important :
Apart from the "PiPe" indicator, which is part of the customization capabilities of this indicator, you can create a multi-time frame mode for the indicator using 3 parameters "High", "Low" and "BAR_INDEX". In this way, instead of the data of the current time frame, use the data of other time frames.
Note that it is better to use the current time frame data, because using the multi-time frame mode is associated with challenges that may cause bugs in your code.
🟣 Setting Parameters
5. SHOW_LINE : It's a boolean variable. When true, the Zig Zag line is displayed, and when false, the Zig Zag line display is disabled.
6. STYLE_LINE : In this variable, you can determine the style of the Zig Zag line. You can input one of the 3 options: line.style_solid, line.style_dotted, line.style_dashed. STYLE_LINE is a constant string variable.
7. COLOR_LINE : This variable takes the input of the line color.
8. WIDTH_LINE : The input for this variable is a number from 1 to 3, which is used to adjust the thickness of the line that draws the Zig Zag. WIDTH_LINE is an integer variable.
9. SHOW_LABEL : It's a boolean variable. When true, labels are displayed, and when false, label display is disabled.
10. COLOR_LABEL : The color of the labels is set in this variable.
11. SIZE_LABEL : The size of the labels is set in this variable. You should input one of the following options: size.auto, size.tiny, size.small, size.normal, size.large, size.huge.
12. Show_Support : It's a boolean variable that, when true, plots the last support line, and when false, disables its plotting.
13. Show_Resistance : It's a boolean variable that, when true, plots the last resistance line, and when false, disables its plotting.
Suggestion :
You can use the following code snippet to import Zig Zag into your code for time efficiency.
//import Library
import TFlab/ZigZagLibrary_TradingFinder/1 as ZZ
// Input and Setting
// Zig Zag Line
ShZ = input.bool(true , 'Show Zig Zag Line', group = 'Zig Zag') //Show Zig Zag
PPZ = input.int(5 ,'Pivot Period Zig Zag Line' , group = 'Zig Zag') //Pivot Period Zig Zag
ZLS = input.string(line.style_dashed , 'Zig Zag Line Style' , options = , group = 'Zig Zag' )
//Zig Zag Line Style
ZLC = input.color(color.rgb(0, 0, 0) , 'Zig Zag Line Color' , group = 'Zig Zag') //Zig Zag Line Color
ZLW = input.int(1 , 'Zig Zag Line Width' , group = 'Zig Zag')//Zig Zag Line Width
// Label
ShL = input.bool(true , 'Label', group = 'Label') //Show Label
LC = input.color(color.rgb(0, 0, 0) , 'Label Color' , group = 'Label')//Label Color
LS = input.string(size.tiny , 'Label size' , options = , group = 'Label' )//Label size
Show_Support= input.bool(false, 'Show Last Support',
tooltip = 'Last Support' , group = 'Support and Resistance')
Show_Resistance = input.bool(false, 'Show Last Resistance',
tooltip = 'Last Resistance' , group = 'Support and Resistance')
//Call Function
ZZ.ZigZag(high ,low ,bar_index ,PPZ , ShZ ,ZLS , ZLC, ZLW ,ShL , LC , LS , Show_Support , Show_Resistance )

Percent Rank HistogramThis Pine script indicator is designed to create a visual representation of the percent rank for multiple financial instruments. Here's a breakdown of its key features:
Percent Rank Calculation:
The core functionality of this Pine script indicator revolves around the calculation of the percent rank for each selected financial instrument.
The percent rank is a statistical measure that indicates the percentage of historical data points that are less than or equal to the current value in a given series.
Symbol Selection:
The script allows the user to select up to 10 financial instruments (tickers) for analysis. The default symbols include various cryptocurrencies such as BTCUSD, ETHUSD etc., and TOTAL market cap at ticker 1, to show overal trend of crypto market.
(Top 9 Coins by market cap).
Columns and Colors:
The script visually represents the percent rank using columns based on lines.
The color of each column is determined by a gradient from red to green based on the calculated percent rank, providing a quick visual indication of the instrument's relative performance.
BTC Trending Up while other coins are underperformance:
Labels:
Labels are displayed on the chart, indicating the symbol name and the corresponding percent rank percentage.
The labels include directional arrows (▲ or ▼) to denote whether the percent rank is increasing or decreasing.
Customization:
Users can customize parameters such as the percent rank length and column width to adapt the indicator to their specific preferences, or select needed assets to compare them to each other.
Chart Desk and Scales:
The script includes the visualization of a chart desk with scale lines to provide additional context to the chart. When Percent Rank above middle scale line (50) usually it signaling about asset trending up and below 50 asset trending down.
Mozilla Public License:
The script is subject to the terms of the Mozilla Public License 2.0.
This indicator is useful for traders and analysts interested in visually assessing the percent rank of multiple financial instruments simultaneously, helping them identify potential opportunities or trends in the market.

Price SextantThe provided Pine Script™ code is for a technical analysis indicator called "Price Sextant." This indicator helps visualize the price position relative to its linear regression and standard deviation levels. Here's a brief description:
Price Sextant Indicator:
Purpose:
The Price Sextant indicator aims to show the current price's deviation from the linear regression line by dividing the price chart into different zones or sextants.
Components:
Linear Regression: The script calculates a linear regression line based on the closing prices over a specified length (default is 50 bars).
Standard Deviation Sections: It then computes standard deviation levels from the linear regression, creating upper and lower sections around the regression line.
Scoring: Each section is assigned a numerical score, and labels with corresponding scores are displayed on the chart.
Arrow and Midline: An arrow is drawn to indicate the current price's position in relation to the regression line and standard deviation bands. It changes color based in what section it is:
orange section shows a ranging price, below orange section -1 arrow turns red and show down trend and if arrow above +1 section it turns green and show strong up trend of price.
A midline is plotted to mark the position of the linear regression line.
Sextant Description:
In navigation, a sextant is an instrument used to measure the angle between two visible objects.
In the context of this indicator, the term "Sextant" is likely used metaphorically to describe the division of the price chart into six sections or zones based on the linear regression and standard deviation bands.
This indicator can help traders identify potential overbought or oversold conditions, as well as assess the strength and direction of the trend.
Please note that the effectiveness of the indicator depends on various factors, and it's advisable to use it in conjunction with other analysis tools for a comprehensive trading strategy.

TrendLine ScythesTrendline Scythes is a script designed to automatically detect and draw special curved trendlines, resembling scythes or blades, based on pivotal points in price action. These trendlines adapt to the volatility of the market, providing a unique perspective on trend dynamics.
🔲 Methodology
Traditional trendlines connect consecutive pivot points on a price chart, providing a linear representation of trend direction. However, this script employs a distinctive methodology by automatically detecting price pivots and then calculating special curved trendlines based on the Average True Range (ATR) of the price. This introduces a curvature to the trendlines, resembling scythes, offering a unique way to interpret market trends.
🔲 Auto Breakout and Target Detection
Trendline Scythes includes features for automatic breakout detection, signaling potential trend changes. Additionally, the script assists in target detection, helping traders set realistic and data-driven profit-taking levels based on market volatility and user adjustment.
🔲 Utility
Trend Confirmation - Use Trendline Scythes to confirm existing trends by observing how price interacts with the curved trendlines.
Breakout Signals - Auto-detection of breakouts adds a proactive element to your trading strategy, helping you stay ahead of potential trend reversals.
Target Setting - Utilize the script to set profit-taking targets based on volatility, aligning with the current market conditions.
🔲 Settings
Pivot Length - Swing detection length
Scythe Length - Adjusts the length of the scythes blade
Sensitivity - Controls how restrained the target calculation is, higher values will result in tighter targets.
🔲 Alerts
Breakout
Breakdown
Target Reached
Target Invalidated
As well as the option to trigger 'any alert' call.
Trendline Scythes is a versatile tool combining the benefits of traditional trendlines with the dynamic adaptability of curved lines for a unique approach to trend analysis.

maRSI - Moving Averages for RSI with Outer BandsWhat distinguishes this indicator?
This indicator can help to identify a trend at an early stage or as a confirmation - based on a RSI and its Moving Average. It should invite you to experiment and thereby be adapted to your own way of trading.
The type of moving average could be defined: "SMA", "EMA", "DEMA", "TEMA", "SMMA", "LSMA", "HMA", "WMA"
A suggestion for interpretation of “maRSI”:
A cross over the middle line (Signal Line) can be interpreted as a trend change. Is often used for more aggressive trading styles.
Everything above the middle line (Signal Line) could be interpreted as Uptrend. Vice versa.
Depending on how the outer bands were configured, these could be interpreted as earlier signals of a trend change. Is often used for slightly less aggressive trading styles.
Depending on the selected moving average, more or less conservative signals can be output.
The plot "RSI" shows the RSI based on the settings you have made.
The plot "Signal Line" is colored and shows whether the Signal Line is up- or downtrending.
The plot "Direction: RSI to Signal Line" provides clear information about the direction in which the "Signal Line" intersects the RSI and where the RSI is to the "Signal Line". "1" means RSI above "Signal Line" and "-1" means RSI below "Signal Line"
The plot "Direction: Signal Line” provides clear information about the direction of the Signal Line. "1" means uptrending while "-1" means downtrending.
What do I need to consider?
By definition this indicator can be classified as lagging - since it based on historical prices/values. It may be advisable to add further indicators and an analysis of the market structure in order to confirm the signals issued by the indicator. Please note that when you make adjustments to any strategy, you always carry out particularly detailed tests.
Details concerning the crosses of maRSI with its Signal Line and Outer Bands:
#revision: lv07

YinYang TrendTrend Analysis has always been an important aspect of Trading. There are so many important types of Trend Analysis and many times it may be difficult to identify what to use; let alone if an Indicator can/should be used in conjunction with another. For these exact reasons, we decided to make YinYang Trend. It is a Trend Analysis Toolkit which features many New and many Well Known Trend Analysis Indicators. However, everything in there is added specifically for the reason that it may work well in conjunction with the other Indicators prevalent within. You may be wondering, why bother including common Trend Analysis, why not make everything unique? Ideally, we would, however, you need to remember Trend Analysis may be one of the most common forms of charting. Therefore, many other traders may be using similar Trend Analysis either through plotting manually or within other Indicators. This all boils down to Psychology; you are trading against other traders, who may be seeing some of the similar information you are, and therefore, you may likewise want to see this information. What affects their trading decisions may affect yours as well.
Now enough about Trend Analysis, what is within this Indicator, and what does it do? Well, first let’s quickly mention all of its components, then we will, through a Tutorial, discuss each individually and finally how each comes together as a cohesive whole. This Indicator features many aspects:
Bull and Bear Signals
Take Profit Signals
Bull and Bear Zones
Information Tables displaying: (Boom Meter, Bull/Bear Strength, Yin/Yang State)
16 Cipher Signals
Extremes
Pivots
Trend Lines
Custom Bollinger Bands
Boom Meter Bar Colors
True Value Zones
Bar Strength Indexes
Volume Profile
There are many things to cover within our Tutorial so let's get started, chronologically from the list above.
Tutorial:
Bull and Bear Signals:
We’ve zoomed out quite a bit for this example to help give you a broader aspect of how these Bull and Bear signals work. When a signal appears, it is displaying that there may be a large amount of Bullish or Bearish Trend Analysis occurring. These signals will remain in their state of Bull or Bear until there is enough momentum change that they change over. There are a couple Options within the Settings that dictate when/where/why these signals appear, and this example is using their default Settings of ‘Medium’. They are, Purchase Speed and Purchase Strength. Purchase Speed refers to how much Price Movement is needed for a signal to occur and Purchase Strength refers to how many verifications are required for a signal to occur. For instance:
'High' uses 15 verifications to ensure signal strength.
'Medium' uses 10 verifications to ensure signal strength.
'Low' uses 5 verifications to ensure signal strength.
'Very Low' uses 3 verifications to ensure signal strength.
By default it is set to Medium (10 verifications). This means each verification is worth 10%. The verifications used are also relevant to the Purchase Speed; meaning they will be verified faster or slower depending on its speed setting. You may find that Faster Speeds and Lower Verifications may work better on Higher Time Frames; and Slower Speeds and Higher Verifications may work better on Lower Time Frames.
We will demonstrate a few examples as to how the Speed and Strength Settings work, and why it may be beneficial to adjust based on the Time Frame you’re on:
In this example above, we’ve kept the same Time Frame (1 Day), and scope; but we’ve changed Purchase Speed from Medium->Fast and Purchase Strength from Medium-Very Low. As you can see, it now generates quite a few more signals. The Speed and Strength settings that you use will likely be based on your trading style / strategy. Are you someone who likes to stay in trades longer or do you like to swing trade daily? Likewise, how do you go about identifying your Entry / Exit locations; do you start on the 1 Day for confirmation, then move to the 15/5 minute for your entry / exit? How you trade may determine which Speed and Strength settings work right for you. Let's jump to a lower Time Frame now so you can see how it works on the 15/5 minute.
Above is what BTC/USDT looks like on the 15 Minute Time Frame with Purchase Speed and Strength set to Medium. You may note that the signals require a certain amount of movement before they get started. This is normal with Medium and the amount of movement is generally dictated by the Time Frame. You may choose to use Medium on a Lower Time Frame as it may work well, but it may also be best to change it to a little slower.
We are still on the 15 Minute Time Frame here, however we simply changed Purchase Speed from Medium->Slow. As you can see, lots of the signals have been removed. Now signals may ‘hold their ground’ for much longer. It is important to adjust your Purchase Speed and Strength Settings to your Time Frame and personalized trading style accordingly.
Above we have now jumped down to the 5 Minute Time Frame. Our Purchase Speed is Slow and our Purchase Strength is Medium. We can see it looks pretty good, although there is some signal clustering going on in the middle there. If we change our Settings, we may be able to get rid of that.
We have changed our Purchase Speed from Slow->Snail (Slowest it can go) and Purchase Strength from Medium->Very Low (Lowest it can go). Changing it from Slow-Snail helped get rid of the signal clustering. You may be wondering why we lowered the Strength from Medium->Very Low, rather than going from Medium->High. This is a use case scenario and one you’ll need to decide for yourself, but we noticed when we changed the Speed from Slow->Snail that the signal clustering was gone, so then we checked both High and Very Low for Strengths to see which produced the best looking signal locations.
Please remember, you don’t have to use it the exact way we’ve displayed in this Tutorial. It is meant to be used to suit your Trading Style and Strategy. This is why we allow you to modify these settings, rather than just automating the change based on Time Frames. You’ll likely need to play around with it, as you’ll notice different settings may work better on certain pairs and Time Frames than others.
Take Profit Signals:
We’ve reset our Purchase Settings, everything is on defaults right now at Medium. We’ve enabled Take Profit signals. As you can see there are both Take Profit signals for the Bulls and the Bears. These signals are not meant to be used within automation. In fact, none of this indicator is. These signals are meant to show there has been a strong change in momentum, to such an extent that the signal may switch from its current (Bull or Bear) and now may be a good time to Take Profit. Your Take Profit Settings likewise has a Speed and Strength, and you can set them differently than your Purchase Settings. This is in case you want to Take Profit in a different manner than your Purchase Signals. For instance:
In the example above we’ve kept Purchase Strength and Speed at Medium but we changed our Take Profit Speed from Medium->Snail and our Take Profit Strength from medium->Very Low. This greatly reduces the amount of Take Profit signals, and in some cases, none are even produced. This form of Take Profit may act more as a Trailing Take Profit that if it’s not hit, nothing appears.
In this example we have changed our Purchase Speed from Medium->Fast, our Purchase Strength from Medium->Very Low. We’ve also changed our Take Profit Speed from Snail->Medium and kept our Take Profit Strength on Very Low. Now we may get our signals quicker and likewise our Take Profit may be more rare. There are many different ways you can set up your Purchase and Take Profit Settings to fit your Trading Style / Strategy.
Bull and Bear Zones:
We have disabled our Take Profit locations so that you can see the Bull and Bear Zones. These zones change color when the Signals switch. They may represent some strong Support and Resistance locations, but more importantly may be useful for visualizing changes in momentum and consolidation. These zones allow you to see various Moving Averages; and when they start to ‘fold’ (cross) each other you may see changes in momentum. Whereas, when they’re fully stretched out and moving all in the same direction, it can provide insight that the current rally may be strong. There is also the case where they look like they’re ‘twisted’ together. This happens when all of the Moving Averages are very close together and may be a sign of Consolidation. We will go over a few examples of each of these scenarios so you can understand what we’re referring to.
In this example above, there are a few different things happening. First we have the yellow circle, where the final and slowest Moving Average (MA) crossed over and now all of the MA’s that form the zone are Bullish. You can see this in the white circle where there are no MA’s that are crossing each other. Lastly, within the blue circle, we can see how some of the faster MA’s are crossing under each other. This is a bullish momentum change. The Faster moving MA’s will always be the first ones to cross before the Slower ones do. There is a color scheme in place here to represent the Speed of the MA within the Zone. Light blue is the fastest moving Bull color -> Light Green and finally -> Dark Green. Yellow is the fastest moving Bear color -> Orange and finally -> Red / Dark Red within the Zone.
Next we will review a couple different examples of what Consolidation looks like and why it is very important to look out for. Consolidation is when Most, if not All of the MA’s are very tightly ‘twisted’ together. There is very little spacing between almost all of the MA’s in the example above; highlighted by the white circle. Consolidation is important as it may indicate a strong price movement in either direction will occur soon. When the price is consolidating it means it has had very little upwards or downwards movement recently. When this happens for long enough, MA’s may all get very similar in value. This may cause high volatility as the price tries to break out of Consolidation. Let's look at another example.
Above we have two more examples of what Consolidation looks like and how high Volatility may occur after the Consolidation is broken. Please note, not all Consolidation will create high Volatility but it is something you may want to look out for.
Information Tables displaying: (Boom Meter, Bull/Bear Strength, Yin/Yang State):
Information tables are a very important way of displaying information. It contains 3 crucial pieces of information:
Boom Meter
Bull/Bear Strength
Yin/Yang State
Boom Meter is a meter that goes from 0-100% and displays whether the current price is Dumping (0 - 29%), Consolidating (30 - 70%) or Pumping (71 - 100%). The Boom Meter is meant to be a Gauge to how the price is currently fairing. It is composed of ~50 different calculations that all vary different weights to calculate its %. Many of the calculations it uses are likewise used in other things, such as the Bull/Bear Strength, Bull/Bear Zone MA cross’, Yin/Yang State, Market Cipher Signals, RSI, Volume and a few others. The Boom Meter, although not meant to be used solely to make purchase decisions, may give you a good idea of current market conditions considering how many different things it evaluates.
Bull/Bear Strength is relevant to your Purchase Speed and Strength. It displays which state it is currently in, and the % it is within that state. When a % hits 0, is when the state changes. When states change, they always start at 100% initially and will go down at the rate of Purchase Strength (how many verifications are needed). For instance, if your Purchase Strength is set to ‘Medium’ it will move 10% per verification +/-, if it is set to High, it will move 6.67% per verification +/-. Bull/Bear Strength is a good indicator of how well that current state is fairing. For instance if you started a Long when the state changed to Bull and now it is currently at Bull with 20% left, that may be a good indication it is time to get out (obviously refer to other data as well, but it may be a good way to know that the state is 20% away from transitioning to Bear).
Yin/Yang State is the strongest MA cross within our Indicator. It is unique in the sense that it is slow to change, but not so much that it moves slowly. It isn’t as simple as say a Golden/Death Cross (50/200), but it crosses more often and may hold similar weight as it. Yin stands for Negative (Bearish) and Yang stands for Positive (Bullish). The price will always be in either a state of Yin or Yang, and just because it is in one, doesn’t mean the price can’t/won’t move in the opposite direction; it simply means the price may be favoring the state it is in.
16 Cipher Signals:
Cipher Signals are key visuals of MA cross’ that may represent price movement and momentum. It would be too confusing and hard to decipher these MA’s as lines on a chart, and therefore we decided to use signals in the form of symbols instead. There are 12 Standard and 4 Predictive/Confirming Cipher signals. The Standard Cipher signals are composed of 6 Bullish and 6 Bearish (they all have opposites that balance each other out). There can never be 2 of the same signal in a row, as the Bull and Bear cancel each other out and it's always in a state of one or the other. When all 6 Bullish or Bearish signals appear in a row, very closely together, without any of the opposing signals it may represent a strong momentum movement is about to occur.
If you refer to the example above, you’ll see that the 6 Bullish Cipher signals appeared exactly as mentioned above. Shortly after the Green Circle appeared, there was a large spike in price movement in favor of the Bulls. Cipher signals don’t need to appear in a cluster exactly like the white circle in this photo for momentum to occur, but when it does, it may represent volatility more than if it is broken up with opposing signals or spaced out over a longer time span.
Above is an example of the opposite, where all 6 Bearish Cipher signals appeared together without being broken by a Bullish Cipher signal or being too far spaced out. As you can see, even though past it there was a few Bullish signals, they were quickly reversed back to Bearish before a large price movement occurred in favor of the Bears.
In the example above we’ve changed Cipher signals to Predictive and Confirming. Support Crosses (Green +) and Blood Diamonds (Red ♦) are the normal Cipher Signals that appear within the Standard Set. They are the first Cipher Signal that appears and are the most common ones as well. However, just because they are the first, that doesn’t mean they aren’t a powerful Cipher signal. For this reason, there are Predictive and Confirming Cipher signals for these. The Predictive do just that, they appear slightly sooner (if not the same bar) as the regular and the Confirming appear later (1+ bars usually). There will be times that the Predictive appears, but it doesn’t resort to the Regular appearing, or the Regular appears and the Confirming doesn’t. This is normal behavior and also the purpose of them. They are meant to be an indication of IF they may appear soon and IF the regular was indeed a valid signal.
Extremes:
Extremes are MA’s that have a very large length. They are useful for seeing Cross’ and Support and Resistance over a long period of time. However, because they are so long and slow moving, they might not always be relevant. It’s usually advised to turn them on, see if any are close to the current price point, and if they aren’t to turn them off. The main reason being is they stretch out the chart too much if they’re too far away and they also may not be relevant at that point.
When they are close to the price however, they may act as strong Support and Resistance locations as circled in the example above.
Pivots:
Pivots are used to help identify key Support and Resistance locations. They adjust on their own in an attempt to keep their locations as relevant as possible and likewise will adjust when the price pushes their current bounds. They may be useful for seeing when the Price is currently testing their level as this may represent Overbought or Oversold. Keep in mind, just because the price is testing their levels doesn’t mean it will correct; sometimes with high volatility or geopolitical news, movement may continue even if it is exhibiting Overbought or Oversold traits. Pivots may also be useful for seeing how far the price may correct to, giving you a benchmark for potential Take Profit and Stop Loss locations.
Trend Lines:
Trend Lines may be useful for identifying Support and Resistance locations on the Vertical. Trend Lines may form many different patterns, such as Pennants, Channels, Flags and Wedges. These formations may help predict and drive the price in specific directions. Many traders draw or use Indicators to help create Trend Lines to visualize where these formations will be and they may be very useful alone even for identifying possible Support and Resistance locations.
If you refer to the previous example, and now to this example, you’ll notice that the Trend Line that supported it in 2023 was actually created in June 2020 (yellow circle). Trend Lines may be crucial for identifying Support and Resistance locations on the Vertical that may withhold over time.
Custom Bollinger Bands:
Bollinger Bands are used to help see Movement vs Consolidation Zones (When it's wide vs narrow). It's also very useful for seeing where the correction areas may be. Price may bounce between top and bottom of the Bollinger Bands, unless in a pump or dump. The Boom Meter will show you whether it is currently: Dumping, Consolidation or Pumping. If combined with Boom Meter Bar Colors it may be a good indication if it will break the Bollinger Band (go outside of it). The Middle Line of the Bollinger Band (White Line) may be a very strong support / resistance location. If the price closes above or below it, it may be a good indication of the trend changing (it may indicate one of the first stages to a pump or dump). The color of the Bollinger Bands change based on if it is within a Bull or Bear Zone.
What makes this Bollinger Band special is not only that it uses a custom multiplier, but it also incorporates volume to help add weight to the calculation.
Boom Meter Bar Colors:
Boom Meter Bar Colors are a way to see potential Overbought and Oversold locations on a per bar basis. There are 6 different colors within the Boom Meter bar colors. You have:
Overbought and Very Bullish = Dark Green
Overbought and Slightly Bullish = Light Green
Overbought and Slight Bearish = Light Red
Oversold and Very Bearish = Dark Red
Oversold and Slightly Bearish = Orange
Oversold and Slightly Bullish = Light Purple
When there is no Boom Meter Bar Color prevalent there won’t be a color change within the bar at all.
Just because there is a Boom Meter Bar Color change doesn’t mean you should act on it purchase or sell wise, but it may be an indication as to how that bar is fairing in an Overbought / Oversold perspective. Boom Meter Bar Colors are mainly based on RSI but do take in other factors like price movement to determine if it is Overbought or Oversold. When it comes to Boom Meter Bar Color, you should take it as it is, in the sense that it may be useful for seeing how Individual bars are fairing, but also note that there may be things such as:
When there is Very Overbought (Dark Green) or Very Oversold (Dark Red), during massive pump or dumps, it will maintain this color. However, once it has lost ‘some’ momentum it will likely lose this color.
When there has been a massive Pump or Dump, and there is likewise a light purple or light red, this may mean there is a correction or consolidation incoming.
True Value Zones:
True Value zones are our custom way of displaying something that is similar to a Bollinger Band that can likewise twist like an MA cross. The main purpose of it is to display where the price may reside within. Much like a Bollinger Band it has its High and Low within its zone to specify this location. Since it has the ability to cross over and under, it has the ability to specify what it thinks may be a Bullish or Bearish zone. This zone uses its upper level to display what may be a Resistance location and its lower level to display what may be a Support location. These Support and Resistance locations are based on Momentum and will move with the price in an attempt to stay relevant.
You may use these True Values zones as a gauge of if the price is Overbought or Oversold. When the price faces high volatility and moves outside of the True Value Zones, it may face consolidation or likewise a correction to bring it back within these zones. These zones may act as a guideline towards where the price is currently valued at and may belong within.
Bar Strength Indexes:
Bar Strength Indexes are our way of ranking each bar in correlation to the last few. It is based on a few things but is highly influenced on Open/Close/High/Low, Volume and how the price has moved recently. They may attempt to ‘rate’ each bar and how Bullish/Bearish each of these bars are. The Green number under the bar is its Bullish % and the Red number above the bar is its Bearish %. These %’s will always equal 100% when combined together. Bar Strength Indexes may be useful for seeing when either Bullish or Bearish momentum is picking up or when there may be a reversal / consolidation.
These Bar Strength Indexes may allow you to decipher different states. If you refer to the example above, you may notice how based on how the numbers are changing, you may see when it has entered / exited Bullish, Bearish and Consolidation. Likewise, if you refer to the current bar (yellow circle), you can see that the Bullish % has dropped from 93 to 49; this may be signifying that the Bullish movement is losing momentum. You may use these changes in Bar Indexes as a guide to when to enter / end trades.
Volume Profile:
Volume Profile has been something that has been within TradingView for quite some time. It is a very useful way of seeing at what Horizontal Price there has been the most volume. This may be very useful for seeing not only Support and Resistance locations based on Volume, but also seeing where the majority of Limit Orders are placed. Limit Orders are where traders decide they want to either Buy / Sell but have the order placed so the trade won’t happen until the price reaches a certain amount. Either through many orders from many traders, or a single order from a ‘Whale’ (trader with a lot of capital); you may see Support and Resistance at specific Price Points that have large Volume.
Many Volume Profile Indicators feature a breakdown of all the different locations of volume, along with a Point Of Control (POC) line to designate where the most Volume has been. To try and reduce clutter within our already very saturated Toolkit Indicator, we’ve decided to strip our Volume Profile to only display this POC line. This may allow you to see where the crucial Volume Support and Resistance is without all of the clutter.
You may be wondering, well how important is this Volume Profile POC line and how do I go about using it? Aside from it being a gauge towards where Support and Resistance may be within Volume, it may also be useful for identifying good Long/Short locations. If you think of the line as a ‘Battle’ between the Bulls and Bears, they’re both fighting over that line. The Bears are wanting to break through it downwards, and the Bulls are wanting to break through it upwards. When one side has temporarily won this battle, this means they may have more Capital to push the price in their direction. For instance, if both the Bulls and the Bears are fighting over this POC price, that means the Bears think that price is a good spot to sell; however, the Bulls also deem that price to be a good point to buy. If the Bulls were to win this battle, that means the Bears either canceled their orders to reevaluate, or all of their orders have been completed from the Bulls buying them all. What may happen after that is, if the Bulls were able to purchase all of these Limit Sell Orders, then they may still have more Capital left to continue to pressure the price upwards. The same may be true for if the Bears were to win this ‘Battle’.
How to use YinYang Trend as a cohesive whole:
Hopefully you’ve read and understand how each aspect of this Indicator works on its own, as knowing how/what they each do is important to understanding how it is used as a cohesive whole. Due to the fact that this Toolkit of an Indicator displays so much data, you may find it easier to use and understand when you’re zoomed in a little, somewhat like we are in this example above.
If we refer to the example above, you may like us, deduce a few things:
1. The current price may be VERY Overbought. This may be seen by a few different things:
The Boom Meter Bar Colors have been exhibiting a Dark Green color for 6 bars in a row.
The price has continuously been moving the High (red) Pivot Upwards.
Our Boom Meter displays ‘Pumping’ at 100%.
The price broke through a Downward Trend Line that was created in February of 2022 at 45,000 like it was nothing.
The Bar Strength Index hit a Bullish value of 93%.
The Price broke out of the Bollinger Bands and continues to test its upper levels.
The Low is much greater than our fastest moving MA that creates the Purchase Zones.
The Price is vastly outside of the True Value Zone.
The Bar Strength Index of our current bar is 50% bullish, which is a massive decrease from the previous bar of 93%. This may indicate that a correction is coming soon.
2. Since we’ve identified the current price may be VERY Overbought, next we need to identify if/when/to where it may correct to:
We’ve created a new example here to display potential correction areas. There are a few places it has the ability to correct to / within:
The downward Trend Line (red) below the current bar sitting currently at 32,750. This downward Trend Line is at the same price point as the Fastest MA of our Purchase Zone which may provide some decent Support there.
Between two crucial Pivot heights, within a zone of 30,000 to 31,815. This zone has the second fastest MA from the Purchase Zone right near the middle of it at 31,200 which may act as a Support within the Zone. Likewise there is the Bollinger Band Basis which is also resting at 30,000 which may provide a strong Support location here.
If 30,000 fails there may be a correction all the way to the bottom of our True Value Zone and the top of one of our Extremes at 27,850.
If 27,850 fails it may correct all the way to the bottom of our Purchase Zone / lowest of our Extremes at 27,350.
If all of the above fails, it may test our Volume Profile POC of 26,430. If this POC fails, the trend may switch to Bearish and continue further down to lower levels of Support.
The price can always correct more than the prices mentioned above, but considering overall this Indicator is favoring the Bulls, we will tailor this analysis in Favor of the Bullish Momentum maintaining even during this correction. For these reasons, we think the price may correct between the 30,000 and 31,815 zone before continuing upwards and maintaining this Bullish Momentum.
Please note, these correction estimates are just that, they’re estimates. Aside from the fact that the price is very overbought right now and our Bar Strength Index may be declining (bar hasn’t closed yet); the Boom Meter Strength remains at 100%, meaning there may not be much Bearish momentum changes happening yet. We just want to show you how an Preemptive analysis may be done before there are even Bearish Cipher Signals appearing.
Using this Indicator, you may be able to decipher Entry and Exits. In the previous example, we went over how you may use it to see where a correction (Exit / Take Profit) may be and how far this correction may go. In this example above we will be discussing how to identify Entry locations. We will be discussing a Bullish Buy entry but the same rules apply for a Bearish Sell Entry just the opposite with the Cipher Signals.
If you refer to where we circled in white, this is where the Purchase Zones faced Consolidation. When the Purchase Zones all get tight and close together like that, this may represent Volatility and Momentum in either direction may occur soon.
This was then followed by all 6 of the Standard Cipher Signals closely in succession to each other. This means the Momentum may be favoring the Bulls. If this was likewise all 6 of the Bearish Cipher Signals closely in succession, than the momentum change would favor the Bears.
If you were looking for an entry, and you saw Consolidation with the Purchase Zones and then shortly after you saw the Green Circle and Blue Flag (they can swap order); this may now be a good Entry location.
We will conclude this Tutorial here. Hopefully this has taught you how this Trend Analysis Toolkit may help you locate multiple different types of important Support and Resistance locations; as well as possible Entry and Exit locations.
Settings:
1. Bull/Bear Zones:
1.1. Purchase Speed (Bull/Bear Signals and Take Profit Signals):
Speed determines how much price movement is needed for a signal to occur.
'Sonic' uses the extremities to try and get you the best entry and exit points, but is so quick, its speed may reduce accuracy.
'Fast' may attempt to capitalize on price movements to help you get SOME or attempt to lose LITTLE quickly.
'Medium' may attempt to get you the most optimal entry and exit locations, but may miss extremities.
'Slow' may stay in trades until it is clear that momentum has changed.
'Snail' may stay in trades even if momentum has changed. Snail may only change when the price has moved significantly (This may result in BIG gains, but potentially also BIG losses).
1.2. Purchase Strength (Bull/Bear Signals and Take Profit Signals):
Strength ensures a certain amount of verifications required for signals to happen. The more verifications the more accurate that signal is, but it may also change entry and exit points, and you may miss out on some of the extremities. It is highly advised to find the best combination between Speed and Strength for the TimeFrame and Pair you are trading in, as all pairs and TimeFrames move differently.
'High' uses 15 verifications to ensure signal strength.
'Medium' uses 10 verifications to ensure signal strength.
'Low' uses 5 verifications to ensure signal strength.
'Very Low' uses 3 verifications to ensure signal strength.
2. Cipher Signals:
Cipher Signals are very strong EMA and SMA crosses, which may drastically help visualize movement and help you to predict where the price will go. All Symbols have counter opposites that cancel each other out (YinYang). Here is a list, in order of general appearance and strength:
White Cross / Diamond (Predictive): The initial indicator showing trend movement.
Green Cross / Diamond (Regular): Confirms the Predictive and may add a fair bit of strength to trend movement.
Blue Cross / Diamond (Confirming): Confirms the Regular, showing the trend might have some decent momentum now.
Green / Red X: Gives momentum to the current trend direction, possibly confirming the Confirming Cross/Diamond.
Blue / Orange Triangle: may confirm the X, Possible pump / dump of decent size may be coming soon.
Green / Red Circle: EITHER confirms the Triangle and may mean big pump / dump is potentially coming, OR it just hit its peak and signifies a potential reversal correction. PAY ATTENTION!
Green / Red Flag: Oddball that helps confirm trend movements on the short term.
Blue / Yellow Flag: Oddball that helps confirm trend movements on the medium term (Yin / Yang is the long term Oddball).
3. Bull/Bear Signals:
Bear and Bull signals are where the momentum has changed enough based on your Purchase Speed and Strength. They generally represent strong price movement in the direction of the signal, and may be more reliable on higher TimeFrames. Please don’t use JUST these signals for analysis, they are only meant to be a fraction of the important data you are using to make your technical analysis.
4. Take Profit Signals:
Take Profit signals are guidelines that momentum has started to change back and now may be a good time to take profit. Your Take Profit signals are based on your Take Profit Speed and Strength and may be adjusted to fit your trading style.
5. Information Tables:
Information tables display very important data and help to declutter the screen as they are much less intrusive compared to labels. Our Information tables display: Boom Meter, Purchase Strength of Bull/Bear Zones and Yin/Yang State.
Boom Meter: Uses over 50 different calculations to determine if the pair is currently 'Dumping' (0-29%), 'Consolidating' (30-70%), or 'Pumping' (71-100%).
Bull / Bear Strength: Shows the strength of the current Bull / Bear signal from 0-100% (Signals start at 100% and change when they hit 0%). The % it moves up or down is based on your 'Purchase Strength'.
Yin / Yang state: Is one of the strongest EMA/SMA crosses (long term Oddball) within this Indicator and may be a great indication of which way the price is moving. Do keep in mind if the price is consolidating when changing state, it may have the highest chance of switching back also. Once momentum kicks in and there is price movement the state may be confirmed. Refer to other Cipher Symbols, Extremes, Trend, BOLL, Boom %, Bull / Bear % and Bar colors when Bull / Bear Zones are consolidating and Yin / Yang State changes as this is a very strong indecision zone.
6. Bull / Bear Zones:
Our Bull / Bear zones are composed of 8 very important EMA lengths that may act as not only Support and Resistance, but they help to potentially display consolidation and momentum change. You can tell when they are getting tight and close together it may represent consolidation and when they start to flip over on each other it may represent a change in momentum.
7. MA Extremes:
Our MA Extremes may be 3 of the most important long term moving averages. They don’t always play a role in trades as sometimes they’re way off from the price (cause they’re extreme lengths), but when they are around price or they cross under or over each other, it may represent large changes in price are about to occur. They may be very useful for seeing strong resistance / support locations based on price averages. Extremes may transition from a Support to a Resistance based on its position above or below them and how many times the price has either bounced up off them (Supporting) or Bounced back down after hitting them (Resistance).
8. Pivots:
Pivots may be a very important indicator of support and resistance for horizontal price movement. Pivots may represent the current strongest Support and Resistance. When the Pivot changes, it means a new strong Support or Resistance has been created. Sometimes you'll notice the price constantly pushes the pivot during a massive Pump or Dump. This is normal, and may indicate high levels of volatility. This generally also happens when the price is outside of the Bollinger Bands and is also Over or Undervalued. The price usually consolidates for a while after something like this happens before more drastic movement may occur.
9. Trend Lines:
Trend lines may be one of the best indicators of support and resistance for diagonal price movement. When a Trend Line fails to hold it may be a strong indication of a dump. Keep a close eye to where Upward and Downward Trend Lines meet. Trend lines can create different trading formations known as Pennants, Flags and Wedges. Please familiarize yourself with these formations So you know what to look for.
10. Bollinger Bands (BOLL):
Bollinger Bands may be very useful, and ours have been customized so they may be even more accurate by using a modified calculation that also incorporates volume.
Bollinger Bands may be used to see Movement vs Consolidation Zones (When it’s wide vs narrow). It also may be very useful for seeing where the correction areas are likely to be. Price may bounce between top and bottom of the BOLL, unless perhaps in a pump or dump. The Boom Meter may show you whether it is currently: Dumping, Consolidation or Pumping, along with Boom Meter Bar Colors, may be a good indication if it will break the BOLL. The Middle Line of the BOLL (White Line) may be a very strong support / resistance line. If the price closes above or below it, it may be a good indication of the trend changing (it may be one of the first stages to a pump or dump).
11. Boom Meter Bar Colors:
Boom Meter bar colors may be very useful for seeing when the bar is Overbought or Underbought. There are 6 different types of boom meter bar colors, they are:
Dark Green: RSI may be very Overbought and price going UP (May be in a big pump. NOTICE, chance of small dump correction if Cherry Red bar appears).
Light Green: RSI may be slightly Overbought and price going UP (chance of small pump).
Light Purple: RSI may be very Underbought and price going UP (May have chance of small correction).
Dark Red: RSI may be very Underbought and price going DOWN (May be in a big dump. NOTICE, chance of small pump correction if Light Purple bar appears).
Light Orange: RSI may be slightly Underbought and price going DOWN (chance of small dump).
Cherry Red: RSI may be very Overbought and price going DOWN (Chance of small correction).
12. True Value Zone:
True Value Zones display zones that represent ranges to show what the price may truly belong within. They may be very useful for knowing if the Price is currently not valued correctly, which generally means a correction may happen soon. True Value Zones can swap from Bullish to Bearish and are represented by Red for Bearish and Green for Bullish. For example, if the price is ABOVE and OUTSIDE of the True Value Zone, this means it may be very overvalued and might correct to go back inside the True Value Zone. This correction may be done by either dumping in price back into the zone, or consolidating horizontally back into it over a longer period of time. Vice Versa is also true if it is BELOW and OUTSIDE of the True Value Zone.
13. Bar Strength Index:
Bar Strength Index may display how Bullish/Bearish the current bar is. The strength is important to help see if a pump may be losing momentum or vice versa if a dump may correct. Keep in mind, the Bar Strength Index does a small 'refresh' to account for new bars. It may help to keep the Index more accurate.
14. Volume Profile:
Volume Profiles may be important to know where the Horizontal Support/Resistance is in Price base on Volume. Our Volume Profile may identify the point where the most volume has occurred within the most relevant timeframe. Volume Profiles are helpful at identifying where Whales have their orders placed. The reason why they are so helpful at identifying whales is when the volume is profiled to a specific area, there may likely be lots of Limit Buy and/or Sells around there. Limit Buys may act as Support and Limit Sells may act as Resistance. It may be very useful to know where these lie within the price, similar to looking at Order Book Data for Whale locations.
If you have any questions, comments, ideas or concerns please don't hesitate to contact us.
HAPPY TRADING!

Trend Lines [LuxAlgo]Our new "Trend Lines" indicator detects and highlights relevant trendlines on the user chart while keeping it free of as much clutter as possible.
The indicator is thought for real-time usage and includes several filters as well as the ability to estimate trendline angles.
🔶 USAGE
Trendlines can act as support/resistance, with a higher number of tests indicating a more significant support/resistance role.
A broken TrendLine can be indicative of a potential trend reversal. The script highlights breaks with a label.
Users can additionally filter trendlines, only showing trendlines whose angles fall within a user set range:
This allows for the removal of potential clutter from the chart but also helps keep steeper or more horizontal trendlines.
🔶 DETAILS
When a swing (pivot point) is found, a Trendline is drawn when certain conditions are fulfilled.
An essential condition is that a Bearish Trendline (red) always occurs on a lower high, while a Bullish Trendline (blue) occurs on a higher low.
Our implementation will first show an initial dotted-styled TrendLine on confirmation, after which a solid-styled secondary TrendLine will develop. The latter will be used for the real-time detection of breaks at that line:
Furthermore, the script allows you to add more conditions:
🔹 Length (Swings)
A swing develops when a high/low is the highest/lowest against x highs/lows on the left AND right of that bar. x can be set by "Length" in settings.
The following images clarify this. The script confirms a swing where the yellow flag is shown; the high (here visualized with a purple label) is the highest point against x bars left and right of that point.
At that moment, this swing is checked against the previous swing. If all conditions are fulfilled, an initial TrendLine is drawn on confirmation.
After that point, a secondary thicker solid line is seen which keeps progressing bar after bar, until:
• a new TrendLine is formed
• the TrendLine is broken
🔹 Breaks between Swings
Once there is confirmation that a TrendLine can be drawn, the script allows you to filter for breakthroughs on that line. This can be set with "Check breaks between"
Disabled : the initial TrendLine is allowed to be pierced:
Check breaks between point A - point B : no breaks are allowed between both Swing points:
Point A - Current bar : no breaks are allowed between the first Swing point and the point of confirmation ('current' bar):
🔹 TrendLine breaks
As mentioned, the secondary TrendLine (solid line) progresses bar after bar until a new TrendLine is formed or the TrendLine is broken. When a TrendLine is broken, the TrendLine stops progressing, but if there isn't a new TrendLine and price return back, the TrendLine will re-appear, potentially giving several signals when the TrendLine is broken again.
Minimal bars allow you to regulate the amount of signals when the TrendLine is broken.
-> The secondary TrendLine must be uninterrupted for at least x bars before a potential break can be considered.
The following example shows 1 signal against 3 by adjusting this setting from 2 to 5:
🔹 Angles
Angles should normally be calculated when the units of the X and Y axis are the same. However, on our charts, the unit of the X-axis is bar_index (bars), and on the Y-axis the unit is price (¥, €, £, $,...).
It is not easy to normalize and create reasonably valid angles. Often certain angle calculations can differ through price changes or volatility.
Our calculate_slope() function tries to make corresponding angles through all bars.
We do this by calculating the difference between the highest/lowest price values in a certain bar range. The bar range is our X-axis, and the price difference is our Y-axis.
Zooming in/out will not change the amount of bars or the price. Since it does change our view on the chart, and thereby how we see the angles, we have included a setting where you can personalize the ratio between X and Y-axis (Angles -> Ratio X-Y axis).
Settings: Angles - Ratio X-Y axis:
🔶 SETTINGS
🔹 Swings
Length: Lookback period for the detection of swing points.
🔹 Trendline validation
Check breaks between :
Disabled : the initial TrendLine is allowed to be pierced
Check breaks between point A - point B : no breaks are allowed between both Swing points
Point A - Current bar : no breaks are allowed between the first Swing point and the point of confirmation ('current' bar)
Source (breaks) : Source which invalidates TrendLine, default: close
🔹 TrendLine breaks
Minimal bars : The secondary TrendLine must be uninterrupted for at least x bars before a potential break can be considered.
🔹 Angles
Show : Toggle labels.
Ratio X-Y axis : Every user has his preferences regarding zoom, chart layout,...
If the shown angles are not according to your expectations, you can adjust this number.
Only TrendLine between : Only allow TrendLines between the minimum and maximum degrees. Set only the minimal and maximum values above 0.

MAutoFloorCeiling* MAutoFloorCeiling Indicator *
The MAutoFloorCeiling indicator is a powerful algorithm utilizing Wyckoffian concepts of Supply, Demand, and Volume Climaxes to determine and draw Support / Resistance levels automatically. It is the culmination of over 2 years of research. Drawing Support / Resistance lines automatically is a tremendous benefit to the trader as this provides structure to price and exposes market movement as well as which areas price is likely to respect or break out of.
* WHAT THE SCRIPT DOES *
The MAutoFloorCeiling algorithm draws Floor and Ceiling lines automatically. The price points at which these lines are drawn at are areas of increasing Supply, Demand, or Volume Climax respective to their Price Levels. Areas of Volume Climaxes are often respected by price, since price tends to return to them or break out of them, and hence form powerful Support / Resistance levels.
* HOW TO USE IT *
Floor and Ceiling lines correspond to Support and Resistance lines. When a line is draw consider the following questions
Is it a top / bottom?
Is it support / resistance?
Is it a breakout / breakdown?
Is it a pullback?
* HOW IT WORKS *
1. There are 2 types of lines: Floors and Ceilings
2. A Floor Line is drawn when there is a "Selling Volume Bias" (Volume Climaxes on downward price movement)
More Floor Lines get drawn if market continues to go lower combined with a "Selling Volume Bias"
3. A ceiling line is drawn when there is a "Buying Volume Bias" (Volume Climaxes on upward price movement)
More ceiling lines get drawn if market continues to go higher combined with a "Buying Volume Bias"
4. There is a 1 bar delay to confirm the creation of a new floor / ceiling line.
Once the new floor / ceiling is created, it draws forward with no delay.
* EXAMPLE AND USE CASES *
MAutoFloorCeiling draws lines that can be used as effective Support / Resistance Levels, Breakout Lines, and Pullback areas. Studying the Volume at these levels can provide insight as to where price is likely to go.
You can scan for Trend Like behavior such as
More Demand on Higher High = Increase in Volume on a Higher Ceiling
More Supply on Lower Low = Increase in Volume on a Lower Floor
You can scan for divergences such as
Less Demand on Higher High = Lower volume on a Higher Ceiling
Less Supply on on Lower Low = Lower volume on a Lower Floor
Pullbacks
A lower ceiling is representative of a pullback when price is going down.
A higher floor is representative of a pullback when price is going up.
You can inspect instances where the thrust of price is shortened, which means the distance between Ceiling or Floor lines becomes less as price struggles to continue in the direction it was moving. Or conversely the thrust of price as shown by the Floor / Ceiling lines can expand, which is indicative of a trend forming.
* AUTHOR *
This script is published by MBoxWave LLC

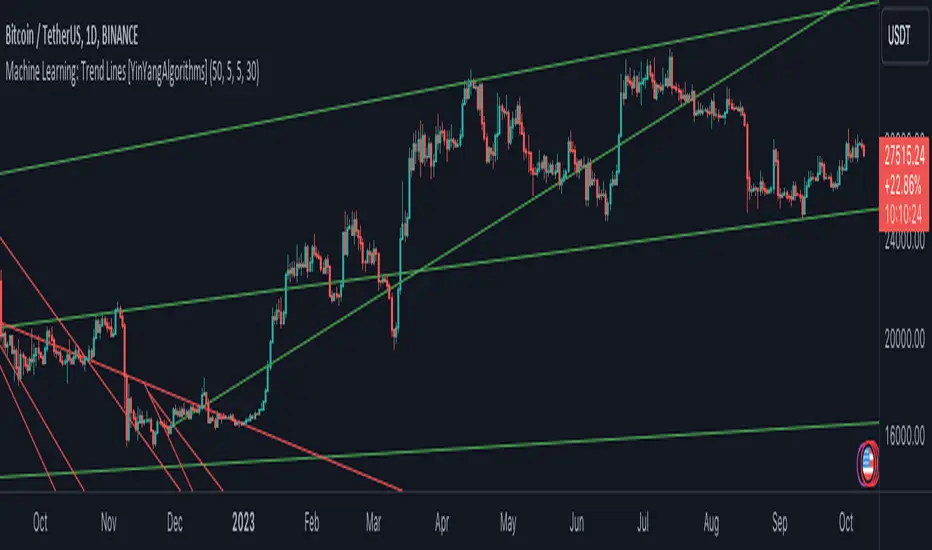
Machine Learning: Trend Lines [YinYangAlgorithms]Trend lines have always been a key indicator that may help predict many different types of price movements. They have been well known to create different types of formations such as: Pennants, Channels, Flags and Wedges. The type of formation they create is based on how the formation was created and the angle it was created. For instance, if there was a strong price increase and then there is a Wedge where both end points meet, this is considered a Bull Pennant. The formations Trend Lines create may be powerful tools that can help predict current Support and Resistance and also Future Momentum changes. However, not all Trend Lines will create formations, and alone they may stand as strong Support and Resistance locations on the Vertical.
The purpose of this Indicator is to apply Machine Learning logic to a Traditional Trend Line Calculation, and therefore allowing a new approach to a modern indicator of high usage. The results of such are quite interesting and goes to show the impacts a simple KNN Machine Learning model can have on Traditional Indicators.
Tutorial:
There are a few different settings within this Indicator. Many will greatly impact the results and if any are changed, lots will need ‘Fine Tuning’. So let's discuss the main toggles that have great effects and what they do before discussing the lengths. Currently in this example above we have the Indicator at its Default Settings. In this example, you can see how the Trend Lines act as key Support and Resistance locations. Due note, Support and Resistance are a relative term, as is their color. What starts off as Support or Resistance may change when the price crosses over / under them.
In the example above we have zoomed in and circled locations that exhibited markers of Support and Resistance along the Trend Lines. These Trend Lines are all created using the Default Settings. As you can see from the example above; just because it is a Green Upwards Trend Line, doesn’t mean it’s a Support Line. Support and Resistance is always shifting on Trend Lines based on the prices location relative to them.
We won’t go through all the Formations Trend Lines make, but the example above, we can see the Trend Lines formed a Downward Channel. Channels are when there are two parallel downwards Trend Lines that are at a relatively similar angle. This means that they won’t ever meet. What may happen when the price is within these channels, is it may bounce between the upper and lower bounds. These Channels may drive the price upwards or downwards, depending on if it is in an Upwards or Downwards Channel.
If you refer to the example above, you’ll notice that the Trend Lines are formed like traditional Trend Lines. They don’t stem from current Highs and Lows but rather Machine Learning Highs and Lows. More often than not, the Machine Learning approach to Trend Lines cause their start point and angle to be quite different than a Traditional Trend Line. Due to this, it may help predict Support and Resistance locations at are more uncommon and therefore can be quite useful.
In the example above we have turned off the toggle in Settings ‘Use Exponential Data Average’. This Settings uses a custom Exponential Data Average of the KNN rather than simply averaging the KNN. By Default it is enabled, but as you can see when it is disabled it may create some pretty strong lasting Trend Lines. This is why we advise you ZOOM OUT AS FAR AS YOU CAN. Trend Lines are only displayed when you’ve zoomed out far enough that their Start Point is visible.
As you can see in this example above, there were 3 major Upward Trend Lines created in 2020 that have had a major impact on Support and Resistance Locations within the last year. Lets zoom in and get a closer look.
We have zoomed in for this example above, and circled some of the major Support and Resistance locations that these Upward Trend Lines may have had a major impact on.
Please note, these Machine Learning Trend Lines aren’t a ‘One Size Fits All’ kind of thing. They are completely customizable within the Settings, so that you can get a tailored experience based on what Pair and Time Frame you are trading on.
When any values are changed within the Settings, you’ll likely need to ‘Fine Tune’ the rest of the settings until your desired result is met. By default the modifiable lengths within the Settings are:
Machine Learning Length: 50
KNN Length:5
Fast ML Data Length: 5
Slow ML Data Length: 30
For example, let's toggle ‘Use Exponential Data Averages’ back on and change ‘Fast ML Data Length’ from 5 to 20 and ‘Slow ML Data Length’ from 30 to 50.
As you can in the example above, all of the lines have changed. Although there are still some strong Support Locations created by the Upwards Trend Lines.
We will conclude our Tutorial here. Hopefully you’ve learned how to use Machine Learning Trend Lines and will be able to now see some more unorthodox Support and Resistance locations on the Vertical.
Settings:
Use Machine Learning Sources: If disabled Traditional Trend line sources (High and Low) will be used rather than Rational Quadratics.
Use KNN Distance Sorting: You can disable this if you wish to not have the Machine Learning Data sorted using KNN. If disabled trend line logic will be Traditional.
Use Exponential Data Average: This Settings uses a custom Exponential Data Average of the KNN rather than simply averaging the KNN.
Machine Learning Length: How strong is our Machine Learning Memory? Please note, when this value is too high the data is almost 'too' much and can lead to poor results.
K-Nearest Neighbour (KNN) Length: How many K-Nearest Neighbours are allowed with our Distance Clustering? Please note, too high or too low may lead to poor results.
Fast ML Data Length: Fast and Slow speed needs to be adjusted properly to see results. 3/5/7 all seem to work well for Fast.
Slow ML Data Length: Fast and Slow speed needs to be adjusted properly to see results. 20 - 50 all seem to work well for Slow.
If you have any questions, comments, ideas or concerns please don't hesitate to contact us.
HAPPY TRADING!
TrendLine CrossThis indicator "TrendLine Cross", is designed to plot trend lines so you can spot potential trend reversal points on the charts. The main function is to draw several lines on the chart and identify the crossings between these lines, which can be significant indicators for trading. The lines are based on different periods which can be changed in the settings tabs.
Let's see the characteristics of the trend lines:
_Low Line Color(Green Line): This line connects the lowest point of low prices in the "low_time" period with the lowest point of low prices in the "high_time" period. Indicates a possible short-term support level on the chart.
_Liquidity Up Line Color (Golden Line): This line connects the lowest point of low prices in the "low_time" period with the highest point of low prices in the same period. It represents a liquidity zone and an important resistance in the chart.
_Lower Line Color (Blue Line): This horizontal line connects the lowest point of low prices in the "LowerLine_period" with the lowest point of low prices in the "high_time" period. Indicates a possible long-term support level.
_Upper Line Colorr: This line represents a connection between the highest points of the "high_time" period and the lowest point of the "LowerLine_period". Indicates a possible long-term resistance level.
_Up Line Color (Red Line): This line connects the highest point of high prices in the "high_time" period with the highest point of high prices in the "LowerLine_period". It represents a possible long-term resistance level.
_Liquidity Down Line Color(Golden Line): This line connects the highest point of high prices in the "high_time" period with the highest point of low prices in the "low_time" period. It represents a liquidity point and an important support zone.
The indicator becomes particularly interesting when the lines make crossings. These crossovers could suggest a potential trend change in the market. For example:
Change from Bearish to Bullish: If the "long-term" line (black) crosses the "short- or long-term" line (green or blue) from top to bottom, it could indicate a shift from a bearish to a bullish market , suggesting the opportunity for long positions.
_Changing from Bullish to Bearish: If the "long-term" line (blue) crosses the "short-term" line (red or black) from bottom to top, it could indicate a shift from a bullish to a bearish market, suggesting the opportunity for short positions.
Generally speaking, crossings between these lines can be key points of interest for traders, as they can signal significant changes in price direction.

Ehlers DecyclerJohn F. Ehlers introuced Decycler in his book "Cycle Analytics for Traders", chapter 4.
The decycler is designed to remove the influence of shorter cycle fluctuations, resulting in an output that closely resembles a one-pole low-pass filter.
A standout feature of the decycler is its notably minimal lag. The most extended cycle elements experience a delay of less than five bars. When considering a frequency of 0.05 cycles per bar (equivalent to a 20-bar cycle period), the lag approximates 1.5 bars. Components with a higher frequency face even lesser delays. Consequently, any higher-frequency variations that pass the filter's attenuation align closely with the price fluctuations. This makes the decycler an optimal "immediate trend detector," giving a true depiction of the data's trend.
While the SuperSmoother filter can yield a comparably smoothed output, the decycler typically exhibits less lag when the two are juxtaposed. It's worth noting that the decycler operates as a one-pole filter, implying it doesn't have the best filtering capabilities. It's not advisable to use the decycler as a smoothing filter to eliminate aliasing disturbances. Instead, its application should focus on generating an immediate trend representation, especially when choosing a larger cutoff period. The broad cutoff period equips the decycler with the ability to reduce aliasing disturbances, given that it's significantly distant from the Nyquist frequency.
There are already several decycler indicators on Tradingview, but I like to structure the code and highlight the main components as functions rather than hiding them in the code. I hope this is useful for those who are starting to learn Pine Script.

Tetra Trendline Indicator 2.0This script is designed to help traders visualize and identify potential overbought and oversold conditions in a financial instrument's price chart using four customizable trendlines. It also provides the option to set alerts for these conditions. Users can adjust the input parameters to tailor the indicator's behavior to their trading preferences.
Input Parameters: The script allows users to configure various input parameters to customize the behavior of the indicator. These parameters include:
showTrendlineX: Boolean inputs to control whether to show each of the four trendlines (Trendline 1, Trendline 2, Trendline 3, and Trendline 4).
trendlineColorX: Color inputs to specify the color of each trendline.
trendlineWidthX: Numeric inputs to set the width of each trendline.
trendlineLengthX: Numeric inputs to determine the length of each trendline.
alertOnTrendlineXBreak: Boolean inputs to enable or disable alerts for each trendline when they are breached.
Trendline Calculations: The script calculates the coordinates for each of the four trendlines. It does this by identifying the starting and ending points of each trendline based on user-defined parameters and the highest or lowest price levels within a specified length.
Plotting Trendlines: The script uses the plot function to display the calculated trendlines on the price chart. It also fills the area between the trendlines to visually emphasize the region.
Alert Conditions: The script defines alert conditions for each trendline. Alerts are triggered when certain price conditions are met:
Trendline 1: An alert is triggered when the price crosses above the Trendline 1 (indicating overbought conditions).
Trendline 2: An alert is triggered when the price crosses below the Trendline 2 (indicating oversold conditions).
Trendline 3: Similar to Trendline 1, an alert is triggered when the price crosses above Trendline 3 (overbought).
Trendline 4: Similar to Trendline 2, an alert is triggered when the price crosses below Trendline 4 (oversold).

BE - Strategy Builder ToolkitIndicator vs Toolkit:
This is definitely not an indicator, hence this doesn't do any kind of analysis nor provide meaningful outputs where you can take trading decisions out of it.
This is a Strategy Builder Toolkit which works like any other broker/3P applications, which helps traders to build their own custom/ predefined strategies, save / deploy them at their wish.
Idea Behind Developing this Toolkit: I am sure many of traders have overcome scenarios where, on break of x level he wants to initiate straddle else he wants to initiate Iron Condor. Some of them wants to deploy custom strategies only at certain time or at certian price levels.
It becomes pretty difficult to track markets when you are away from desk and if you dont adjust the strategy legs, you are incurring big drawdowns. There are many if's and buts to deploy strategies.
To overcome such challenges, i have built this toolkit.
Note: As this is just a toolkit, you should conduct your analysis to gauge the market direction outside the perview of this. Once you know the view / direction of the script. you can use this toolkit in action to
1. Deploy Strategy at (Desired levels| Desired time|Confired Levels|Confirmed Volumes)
2. Strategy can be Prebuilt / Custom Built
3.1 Set SL, Target for Directional view (Trail SL aswell)
3.2 Set Upside or Downside Target for Non Directional view (Trail SL aswell)
3.3 let the strategy play with out SL|Targets for consolidation view.
4. Adjust Legs by closing existing position and opening fresh position or place fresh adjustments
5. Book partial Profits with in the zone.
How the Toolkit is buit: Script uses text related functions to understand the custom input given in the indicator and coverts into a strategy and deployes them as a algo trading (Next Level Bot) with the additional parameter set for SL|Target|Entry levels.
Understanding the settings:
1. Strike Difference: is basically a value between each strike. eg: Banknifty : 100, Nifty & Finnifty: 50
2. 1 Lot Qty: Qty per Lot accepted by exchange|Broker. eg: BNF: 15, Nifty: 50, Finnifty: 40
3. Lot Multiplier: If you build strategy with 1 lot and if you set the Lot multiplier as 2 then strategy gets deployed with 2 lots. for eg. If i have saved strategy to buy BNF 1 ITM with 1Lot and have set lot multipier to 3 then at the time of deploying the trade it pushes as 3 lots (3 * 15Qty per lot = 45Qty) of 1 ITM strike.
4. Symbol Name: Select the Symbol Name here.
5. Current & Next Week Expiry Date: Specify the expiry Dates in the format as supported by your broker.
6. Broker Name, Exchange & Product Type: hope it is self explanatory.
IMPORTANT settings to understand:
7. Triggere Entry Post (optional): You have to specify when you want to deploy the strategy. For instance, if i want to deploy my strategy at 30 min after market open which is 9:45 am, then i have specify as 0945. Another instance where i want to close my strategy at 3 PM then you have to specify as 1500. Uncheck this option if you are not worried about the time of entry.
My personal Used Case: On the Expiry -1 Day at 0916 (9:16AM) i will buy 6 lots of 8OTM PE & CE and Sell 2 lots 7OTM, 2 lots of 6OTM and 2 lots of 5OTM and close the trade by 1100 (11AM).
8. Price Levels (Confirmed vs UnConfirmed) (Optional): Confirmed is basically price is sustained at|around the specified price level, where in UnConfirmed is basically the touch of the specified level.
for instance if i want to deploy straddle only if price is sustained at 100. then, i would specify GE with 100 in price input settings, and check thee Confirmed price box. Assuming if LTP is running at 98 and with the above settings it will only deploy the trade upon price is sustained at 100 level for 3 to 5 candles not at the touch of 100.
Uncheck this option if you are not worried about the Entry Price.
9. Confirmed Volume (Optional) (Long or Short): Basis your view|direction of the strategy. you can get additional confirmation. At the time of entry you want volume to be present towards the direction of the strategy. Uncheck this option if you are not worried about the volume or Volume doesn't exist for the chart loaded.
10. Alert Types: It consists of 3 Long & 3 Short directional (prebuilt) strategy along with Close Strategy, Close Specified Symbols Only & Design Custom Strategy Option.
10.1 : Slow Upmove - If you are having bullish view and predict that prices shall go slow and steady. This strategy can be deployed where you get the benifit of time decay as well while the delta play in favor of you. (viseversa for Slow DownMove)
10.2 : Fast Upmove - If you are having bullish view and predict that prices shall go fast. This strategy can be deployed where you get the smaller benifit of time decay as well while the delta play in favor of you. (viseversa for Fast DownMove)
10.3 : Vol Upmove (Volatality)- If you are having bullish view and predict market is tend to be volatile. This strategy can be deployed where you get the benifit of volatility as well while the delta play in favor of you. (viseversa for VolDownMove)
10.4 : Close Trade - You can use this option close the deployed strategy completely.
10.5 : Close Symbols - You can use this option close few of the symbols for the strategy deployed.
10.6 : Custom: Use this option to design you own custom strayegy with the syntax below:
Sample 1:
N|B|C2|3
N refers to Nextweek Expiry (if C is used then Current week expiry)
B refers to Buy (if S is used then Sell)
C refers to Call | CE (if P is used then PE or Put)
2 refers to 2OTM (for CE any Postitive number refers to as OTM and for PE it will be treated as ITM strikes & 0 refers to as ATM - viseversa for Negative Numbers)
3 refers to as 3 Lot
With the syntax of N|B|C2|3 - strategy will be deployed as "Buy 3 lots of 2 OTM Call of Next expiry"
Sample 2:
C|S|P-3|3|10|30
Above syntax means: SELL Current Expiry 3 Lots of 3 OTM Put Strike with 10 SL and 30 TGT
Sample 3:
C|S|C10|3|Default
Above syntax means: SELL Current Expiry 3 Lots of 10 OTM CALL Strike with 50% SL and 95% TGT
Sample 4:
C|B|C-2|3|40%|50%
Above syntax means: BUY Current Expiry 3 Lots of 2 ITM CALL Strike with 40% SL and 50% TGT
Sample 5: Long Straddle
C|B|C0|3
C|B|P0|3
Above syntax means: BUY Current Expiry 3 Lots of ATM CALL & PUT Strike
Sample 6: Iron Butterfly
C|B|C1|1
C|S|C0|1
C|S|P0|1
C|B|P-1|1
Above syntax means: Sell Current Expiry 1 Lots of ATM CALL & PUT Strike and BUY 1OTM Call & Put Strike
Sample 7: Diagonal Spread
C|S|C2|1
C|S|P-2|1
N|B|C3|1
N|B|P-3|1
Above syntax means: Sell Current Expiry 1 Lots of 2OTM CALL & PUT Strike and BUY 3OTM Call & Put Strike of Next Expiry.
To Understand how to deploy Strategy with defined Adjustments. For instance i want to deploy Iron Condor with Adjustments for BNF when the price is currently running at 45000.
C|B-|C3|1
C|S*|C2|1
C|B--|P-3|1
C|S**|P-2|1
At:2|C|S|C2|1
At:2|C|B|C3|1
At:-2|C|S|P-2|1
At:-2|C|B|P-3|1
On:2|*
On:-2|**
On:2|-
On:-2|--
With the above syntax: Intial trades are placed with
BUY BANKNIFTY45300CALL(Current Expiry) 1 Lot
BUY BANKNIFTY44700PUT(Current Expiry) 1 Lot
SELL BANKNIFTY45200CALL(Current Expiry) 1 Lot
SELL BANKNIFTY44800PUT(Current Expiry) 1 Lot
Toolkit tracks the price and holds the adjustments.
We may start to bleed on the sold leg (45200CALL) once the price crosses 45200. Hence if the price crosses 2 strike upside as specified with syntax " On:2|* " where * is a character tagged to Sold Call Leg. it closes the 45200 Call.
Similarly, " On:2|- " where - is character tagged to Brought Call Leg. it closes the 45300 Call, as soon as prices reaches 2 strike upside.
At:2|C|S|C2|1
At:2|C|B|C3|1
With the At Statements you can place the fresh adjustments legs. Above syntax refers to Once the price reaches 45200 it places below adjustment legs.
BUY BANKNIFTY45500CALL(Current Expiry) 1 Lot
SELL BANKNIFTY45400CALL(Current Expiry) 1 Lot
Note: Similarly If prices reaches downside with the On and At Sytax it places the necessary adjustment legs accordingly.
11. SL & TGT - You can specify SL, TGT or Upside & Dowside TGT during the entry conditions and Stratey shall be closed upon hitting either the SL or TGT accordingly.
12. On % Tgt & Lock % SL: This option is used for Prebuilt strategy where you can lock the Profit | Set Revised SL upon hitting specified TGT percentage.
13. Close Symbols: This option is used if you select Alert type as Close Symbols (Ref - 10.5 : Close Symbols) for specified list of symbols Alert shall be pushed to close the open positions of those symbols.
DISCLAIMER: No sharing, copying, reselling, modifying, or any other forms of use are authorized for our documents, script / strategy, and the information published with them. This informational planning script / strategy is strictly for individual use and educational purposes only. This is not financial or investment advice. Investments are always made at your own risk and are based on your personal judgement. I am not responsible for any losses you may incur. Please invest wisely.
Happy to receive suggestions and feedback in order to improve the performance of the indicator better.

Traders Trend DashboardThe Traders Trend Dashboard (TTD) is a comprehensive trend analysis tool designed to assist traders in making informed trading decisions across various markets and timeframes. Unlike conventional trend-following scripts, TTD goes beyond simple trend detection by incorporating a unique combination of moving averages and a visual dashboard, providing traders with a clear and actionable overview of market trends. Here's how TTD stands out from the crowd:
Originality and Uniqueness:
TTD doesn't rely on just one moving average crossover to detect trends. Instead, it employs a dynamic approach by comparing two moving averages of distinct periods across multiple timeframes. This innovative methodology enhances trend detection accuracy and reduces false signals commonly associated with single moving average systems.
Market Applicability:
TTD is versatile and adaptable to various financial markets, including forex, stocks, cryptocurrencies, and commodities. Its flexibility ensures that traders can utilize it across different asset classes and capitalize on market opportunities.
Optimal Timeframe Utilization:
Unlike many trend indicators that work best on specific timeframes, TTD caters to traders with diverse trading preferences. It offers support for intraday trading (1m, 3m, 5m), short-term trading (15m, 30m, 1h), and swing trading (4h, D, W, M), making it suitable for a wide range of trading styles.
Underlying Conditions and Interpretation:
TTD is particularly effective during trending markets, where its multi-timeframe approach helps identify consistent trends across various time horizons. In ranging markets, TTD can indicate potential reversals or areas of uncertainty when moving averages converge or cross frequently.
How to Use TTD:
1. Timeframe Selection: Choose the relevant timeframes based on your trading style and preferences. Enable or disable timeframes in the settings to focus on the most relevant ones for your strategy.
2. Dashboard Interpretation: The TTD dashboard displays green (🟢) and red (🔴) symbols to indicate the relationship between two moving averages. A green symbol suggests that the shorter moving average is above the longer one, indicating a potential bullish trend. A red symbol suggests the opposite, indicating a potential bearish trend.
3. Confirmation and Strategy: Consider TTD signals as confirmation for your trading strategy. For instance, in an uptrend, look for long opportunities when the dashboard displays consistent green symbols. Conversely, in a downtrend, focus on short opportunities when red symbols dominate.
4. Risk Management: As with any indicator, use TTD in conjunction with proper risk management techniques. Avoid trading solely based on indicator signals; instead, integrate them into a comprehensive trading plan.
Conclusion:
The Traders Trend Dashboard (TTD) offers traders a powerful edge in trend analysis, combining innovation, versatility, and clarity. By understanding its unique methodology and integrating its signals with your trading strategy, you can make more informed trading decisions across various markets and timeframes. Elevate your trading with TTD and unlock a new level of trend analysis precision.
Linear On MACDUnlocking the Magic of Linear Regression in TradingView
In the ever-evolving world of financial markets, traders and investors seek effective tools to gauge price movements, make informed decisions, and achieve their financial goals. One such tool that has proven its worth over time is linear regression, a mathematical concept that has found its way into technical analysis and trading strategies. In this blog post, we will explore the magic behind linear regression, delve into its history, and understand how it's widely used as a technical indicator.
The Birth of Linear Regression: From Mathematics to Trading
Linear regression is a statistical method that aims to model the relationship between two variables by fitting a linear equation to observed data. The formula for a linear regression line is typically expressed as y = a + bx, where y is the dependent variable, x is the independent variable, a is the intercept, and b is the slope.
While the roots of linear regression trace back to the field of statistics, it didn't take long for traders and investors to recognize its potential in the financial world. By applying linear regression to historical price data, traders can identify trends, assess the relationship between variables, and even predict potential future price levels.
The Linear On MACD Strategy
Let's take a closer look at a powerful example of how linear regression is employed in a trading strategy right within TradingView. The "Linear On MACD" strategy harnesses the potential of linear regression in conjunction with the Moving Average Convergence Divergence (MACD) indicator. The goal of this strategy is to generate buy and sell signals based on the interactions between the predicted stock price and the MACD indicator.
Here's a breakdown of the strategy's components:
Calculation of Linear Regression: The strategy begins by calculating linear regression coefficients for the historical stock price based on volume. This helps predict potential future price levels.
Predicted Stock Price: The linear regression results are then used to plot the predicted stock price on the chart. This provides a visual representation of where the price could trend based on historical data.
Buy and Sell Signals: The strategy generates buy signals when certain conditions are met. These conditions include the predicted stock price being between the open and close prices, a rising MACD, and other factors that suggest a potential bullish trend. On the other hand, sell signals are generated based on MACD trends and predicted price levels.
Risk Management: The strategy also incorporates risk tolerance levels to determine entry and exit points. This ensures that traders take into account their risk appetite when making trading decisions.
Embracing the Magic of Linear Regression
As we explore the "Linear On MACD" strategy, we uncover the power of linear regression in aiding traders and investors. Linear regression, a mathematical marvel, seamlessly merges with technical analysis to provide insights into potential price movements. Its historical significance in statistics blends perfectly with the demands of modern financial markets.
Whether you're a seasoned trader or a curious investor, the Linear On MACD strategy exemplifies how a robust mathematical concept can be harnessed to make informed trading decisions. By embracing the magic of linear regression, you're tapping into a tool that continues to evolve alongside the financial world it empowers.
Disclaimer: The information provided in this blog post is for educational purposes only and does not constitute financial advice. Trading and investing carry risks, and it's important to conduct thorough research and consider seeking professional advice before making any trading decisions.
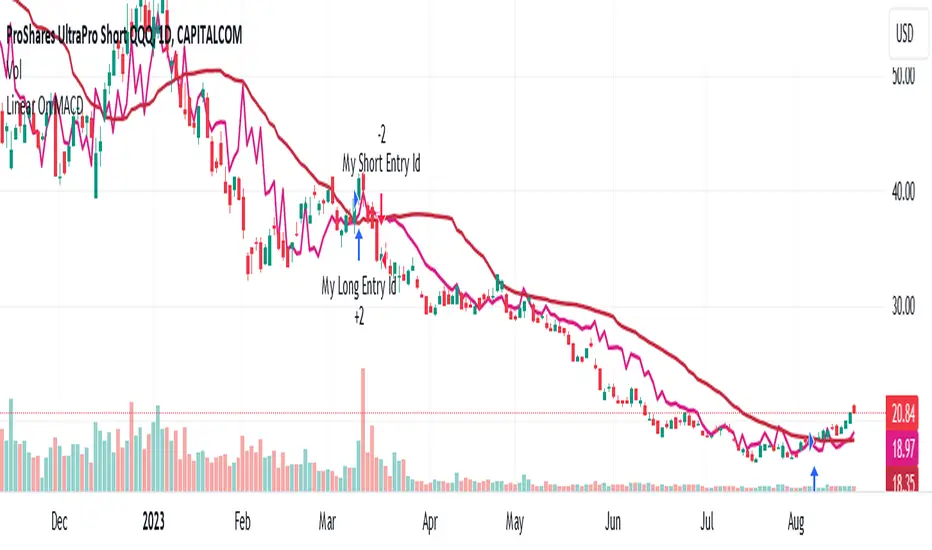
TrapZone ProThis script combines the concepts of Price Action, Trend and Momentum to identify Price Zones (Red and Green filled areas) and Price Bars (Red, Green and Gray) where traders can get trapped in the Market.
It will clearly mark the bars which favor the prevailing Trend and those bars which just don't have the momentum anymore. TrapZone moves with the market trend and will often provide it support. As the TrapZone changes direction & its color, traders can change their trade bias.
Features:
Identify strong & weak price action - By leveraging a regression calculation of price movement on Y axis against the x axis, we identify the strength of current bars. Increasing relative strength of bars indicate Bullish (Green Bars) & Bearish (Red Bars) price movement, respectively. As the relative strength starts to decrease in Bullish or Bearish price action, the indicator immediately changes the color of these bars to Gray (by default). We call these TrapBars .
Current price trend - By using the highs and lows of price in multiple periods, we are calculating the trend of the price. The Bullish trend is shown by the Green zone and Bearish trend is shown by the Red zone. These zones are the shaded areas which are plotted on the chart. If the price is in these Zones, Longs or Short trades are not advised as that price action is weak. We call these TrapZones .
Strength of the Momentum - the thickness of the TrapZone shows the strength of the current Bullish or Bearish trend. That means the wider the shaded area grows the stronger is the current market momentum. A Flat TrapZone indicates sideways price action.
Knowing when NOT to Trade is as important as when to Trade. While this indicator is designed to avoid taking bad trades such as FOMO, Catching a Falling Knife or Fighting The Trend , it successfully reveals the good trade setups!
How these features of this indicator helps Traders avoids common mistakes:
FOMO or Fear of Missing Out - If a Trader Sees TrapBars in a Bullish or Bearish Trend, they will avoid entry as the price action is weak at that time. This will avoid late entries.
Catching a Falling Knife (a.k.a. Picking a Bottom) - When Red TrapZone is being plotted, Traders can avoid taking Long Entries hoping for a price reversal.
Fighting The Trend (a.k.a Picking a Top) - When Green TrapZone is being plotted, Traders can avoid taking Short entries hoping for a price reversal.
TrapZone Pro does all this in a single panel of the chart irrespective of the market or timeframe.
How to use TrapZone Pro indicator for trading [
A. Market Analysis
Green TrapZone is Bullish and traders should not take Shorts. If Green TrapZone is moving higher, Market is Strong
Red TrapZone is Bearish and traders should not take Longs. If Red TrapZone is moving Lower, Market is Strong
No trades when TrapBars are forming
No trades inside the TrapZone
B. Trade Guidance System
Establish Market Bias - Bullish or Bearish using the TrapZone Color
Only Enter Long in Long Color Bars i.e. Green by default
Only Enter Short in Short Color Bars i.e. Red by default
3 Classes of Trades are Possible Class A, B & C. A being the best Reward : Risk ratio and C being the least rewarding. So use trade size accordingly.
Class A - Best bars are always the first & Second, close to the TrapZone
Class B - Long Bar or Short Bar Forming after TrapBar away from the TrapZone in a Strong Market
Class C - Long Bar or Short Bar Forming after TrapBar close to the TrapZone in a Flat Market (identified by Flat TrapZone )
Take profits when Price moves away from the TrapZone & TrapBars start forming OR Your Target is hit !
See a few examples of Trade Classes & Entries/ Exits for a better understanding
Recommendations
Select Session to “Electronic Trading Hours” in chart settings so you can see the Post & Pre Market trading as well. You can change the color of these sessions to the same color as chart background, so it is not distracting.
Start by Trading in the Hourly or Daily time frame to get used to the new indicator and its Trade Guidance System .
Position Size is the best form of Risk Management. Have a fixed dollar loss per trade pre-determined and adjust the size based on market volatility.
Even though this indicator is designed to work on any market or timeframe, trade the markets that you are familiar with and timeframe that matches your lifestyle. Your understanding of the instrument's behavior and knowledge of what makes it move is valuable.
Basic Set-Up
Add the Indicator to the chart
Open Chart Settings and in Symbol Section
Switch off “ Borders ”
Switch off “ Wick ” or Change the colors to a same non-distracting color like Black or Gray
Open TrapZone Pro Settings
Set the colors for the “ Long Bars ”, “ Short Bars ” & “ No Entry Bars ” if you wish to change the default colors
Change “ TrapZone ” colors to your Taste or leave the defaults
Green for “Color 0” that represents Bullish Price Action
Red for “Color 1” that represents Bearish Price Action
Important Advice & Disclaimer: This indicator does not guarantee that you will make money. It is a tool that performs market analysis for you and presents it in a easy to consume fashion. Markets are truly random and can change direction on a dime. You must use prudent risk and money management strategy based on your investor profile, investment objectives and risk appetite.
To Get Access - See Author’s instructions below

Breakout Band v1.0This indicator uses a custom source to define a point of relativity to which regions are based off to aid in technical analysis.
Breakout Band's use is:
- Monitoring trends
- Defining trends
- Defining areas of consolidation
- Trend support / resistance levels
- Aid in technical analysis
However, the band provides information different to that of an EMA, as they are not created from the same source, ref Fig 1.
---
Fig 1
Breakout Band compared to an EMA, both with a length setting of 20.
---
The primary band uses your charts timeframe to plot the band. This can be useful for more immediate information, ref Fig 2.
Fig 2
BTC on a 15m chart with Breakout Band's Chart Timeframe option.
---
There is also a functionality for a higher timeframe band to be plotted ( currently limited to 4 higher timeframes ) which can help to view higher timeframe moves with lower timeframe information, ref Fig 3. The higher timeframe band has an added smoothing effect.
Fig 3.
The same chart as referenced in Fig 2., while using Breakout Bands HTF option ( 60m band ).
---
USING BREAKOUT BAND
The band provides potential areas of consolidation, as seen in Fig 4., and when price action falls outside of the band, it can be considered trending.
Fig 4.
Defining areas of consolidation, trends, and monitor trends with Breakout Band.
---
Different zones are given different colors. The closer to the middle of the band, the higher chance of reactivity. Meaning, there is a greater chance that price will have a reaction within this zone. Whether that be trend continuation or a break of structure, showing signs of weakness of a trend, ref Fig 5.
Fig 5.
Breakout Bands reactivity region showing an area of potential resistance, which price action enters, then the trend continues.
---
NOTE : The same principles apply if you're using the HTF band for monitoring HTF trends.
I hope you enjoy the Breakout Band. Should you encounter any issues or have any suggestions for improving this indicator, let me know.
Any and all feedback is appreciated.
BE-TrendLines & Price SentimentsOverview
The trendline is one of the most potent and flexible tools in trading. A rising trendline indicates an upward trend, a falling trendline indicates a downward trend, and a flat trendline indicates a range-bound bond market.
Breakouts, price bounces, and reversal / Retest tactics are all types of trades that may be made using a trendline. Additionally, stop-loss and profit-trailing orders can be based on trendlines as support and resistance levels, appropriately.
Technical Calculations for Trendlines & Price Sentiments:
Pivot points for a specified time frame and the Prevailing High/Low for the most recent bars are used to derive trendlines. While Pivot Points alert us to price movements, High/Low tells us where Bulls and Bears find a middle ground. This provides a remarkable set of conditions from which to extrapolate the efficacy of the Trendlines.
The term "price sensitivity" refers to how much a change in the price of a product causes consumers to alter their purchase habits. It's the relationship between price shifts and shifts in consumer demand. So, for example, if a 30% jump in the cost of a product leads to a 10% drop in purchases, we can conclude that the item has a price sensitivity of 0.33%.
Basis the above theoretical statement, If the underlying asset's price drops, the indicator shall compute data on the amount of volume being pumped (Inflow vs Outflow) into the market (if available), or the percentage by which the price has changed. This will be compared to the recent drop rate to see if the behavior has changed at the similar value zone and non similar value zone. similar calculation shall be done if the price of the underlying rises.
Traders may benefit from hearing about Trendlines in their "Story Telling" form, which we now present. To help you comprehend it better, candles are divided into three Sentiment groups based on their color. Colors: Green (with its shades), Silver, and Red (including its shades). Green signifies a Bullish Trend, Silver a neutral trend, and Red a Brearish Trend.
Bullish Trend
Bearish Trend
Neutral Trend
Sentiment Price Cycle in Trending Market: Green (Directional Bullish), Dark Green (Bullish Trend Loosing its Strength), Silver (Neutral Trend), Red (Directional Bearish), Dark Red (Bearish Trend Loosing its Strength)
Sentiment Price Cycle in RangeBound Market: Green (Over Brought), Silver (Neutral) & Red (Over Sold)
How to Initiate Trade when price is within TL:
Fake Break Out Trade:
BreakDown Trade:
BreakOut Trade:
Couple of Other Features in the Indicator:
Single Alerts = These are the alerts where in, as and when the Event happens Alerts shall the trigerred. like On BreakOut, BreakDown, TouchOf Up TrendLine, TouchOf DownTrendLine, Retest Of Up TrendLine, Retest of DownTrendLine.
Conditional Alerts = These are those type of Alerts where in you can combine 2 or 3 conditions to trigger an Alert. Like
Sample 1 - After Down TL is tested for 3 times, If BreakOut happens and the setiment turns Bullish within 5 Candles.
Sample 2 - After Up TL is tested for 2 times, If Price Bounces backUp from TL and the setiment turns Bullish within 5 Candles.
Similarly you can customize the combination of events for getting the alert.
DISCLAIMER: No sharing, copying, reselling, modifying, or any other forms of use are authorized for our documents, script / strategy, and the information published with them. This informational planning script / strategy is strictly for individual use and educational purposes only. This is not financial or investment advice. Investments are always made at your own risk and are based on your personal judgement. I am not responsible for any losses you may incur. Please invest wisely.
Happy to receive suggestions and feedback in order to improve the performance of the indicator better.
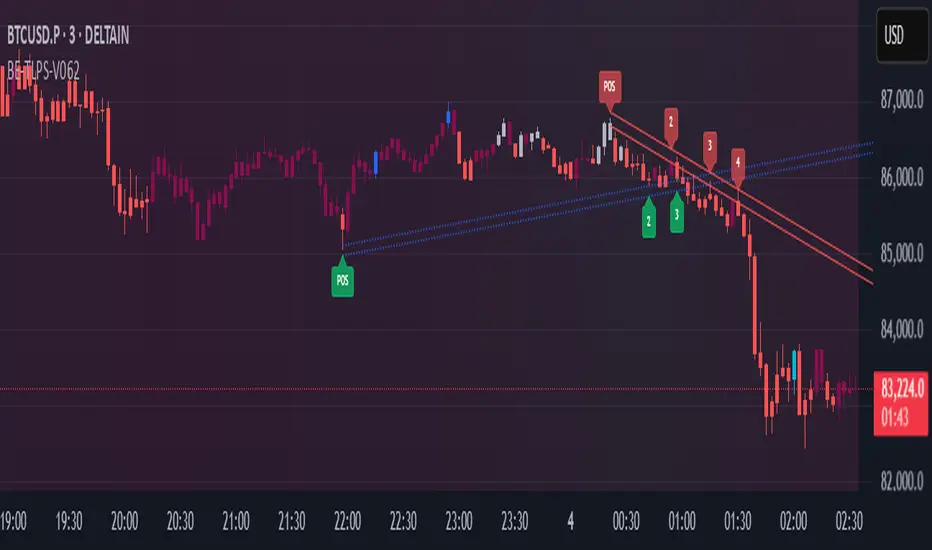
Algo LinesThe primary objective of this indicator is to identify and draw significant trendlines based on pivot points. These trendlines can help traders make informed decisions by providing a visual representation of support and resistance levels in the market.The script consists of several input parameters, functions, and variables that work together to create dynamic trendlines based on pivot points. The input parameters allow users to customize the appearance and behavior of the indicator, including the colors of the trendlines, the timeframe, and the maximum number of crossed lines to display.
The core of the script is built around two main functions:
1. createLine(): This function is responsible for creating a new trendline based on the provided pivot points. It takes five arguments - pivot type, x1, y1, x2, and y2 coordinates - and returns a new line object. Depending on the pivot type, the function adds the new line to either the dtlArray (down trendline array) or utlArray (up trendline array).
2. getSlope(): This function calculates the slope of a given line and returns the extended price level based on the current bar index. It takes one argument - the line object - and uses its coordinates to compute the slope.
The script also employs several variables to store and manipulate pivot points and trendlines. These include arrays for up and down trendlines (dtlArray and utlArray), variables for storing pivot point coordinates (utlX1, utlY1, etc.), and temporary arrays for storing crossed trendlines (tempUtl and tempDtl).
Creating Trendlines
The Algo Lines script identifies pivot highs and pivot lows using the ta.pivothigh() and ta.pivotlow() functions. When a new pivot low is detected, the script updates the utlX1 and utlY1 variables with the previous pivot low coordinates, and the utlX2 and utlY2 variables with the current pivot low coordinates. If the rate of change between these points meets the minimum threshold specified by the user, the createLine() function is called to create a new up trendline.
Similarly, when a new pivot high is detected, the script updates the dtlX1 and dtlY1 variables with the previous pivot high coordinates, and the dtlX2 and dtlY2 variables with the current pivot high coordinates. If the rate of change between these points meets the minimum threshold specified by the user, the createLine() function is called to create a new down trendline.
Processing Trendlines
The Algo Lines script processes up and down trendlines separately. For each trendline in the utlArray, the script checks if the price has crossed the trendline based on the user's chosen cross source (either close or high/low). If the price crosses a trendline, the script creates a new dashed line with the pastColor and adds it to the temporary array (tempUtl). The original trendline is then deleted.
The same process is applied to the dtlArray, except that the temporary array used is tempDtl. In both cases, if the number of crossed lines exceeds the maximum specified by the user, the oldest crossed line is removed from the temporary array.
Conclusion
The Algo Lines indicator offers traders a powerful tool for identifying significant trendlines based on pivot points. By providing a customizable and dynamic visual representation of support and resistance levels, the script enables traders to make better-informed decisions in the market. The concise and well-structured Pine Script code adheres to TradingView's house rules and ensures a seamless integration with the platform.

Trendline Pivots [QuantVue]Trendline Pivots
The Trend Line Pivot Indicator works by automatically drawing and recognizing downward trendlines originating from and connecting pivot highs or upward trendlines originating from and connecting pivot lows.
These trendlines serve as reference points of potential resistance and support within the market.
Once identified, the trend line will continue to be drawn and progress with price until one of two conditions is met: either the price closes(default setting) above or below the trend line, or the line reaches a user-defined maximum length.
If the price closes(default setting) above a down trend line or below an up trend line, an "x" is displayed, indicating the resistance or support has been broken. At the same time, the trend line transforms into a dashed format, enabling clear differentiation from active non-breached trend lines.
This indicator is fully customizable from line colors, pivot length, the number lines you wish to see on your chart and works on any time frame and any market.
Don't hesitate to reach out with any questions or concerns.
We hope you enjoy!
Cheers.
