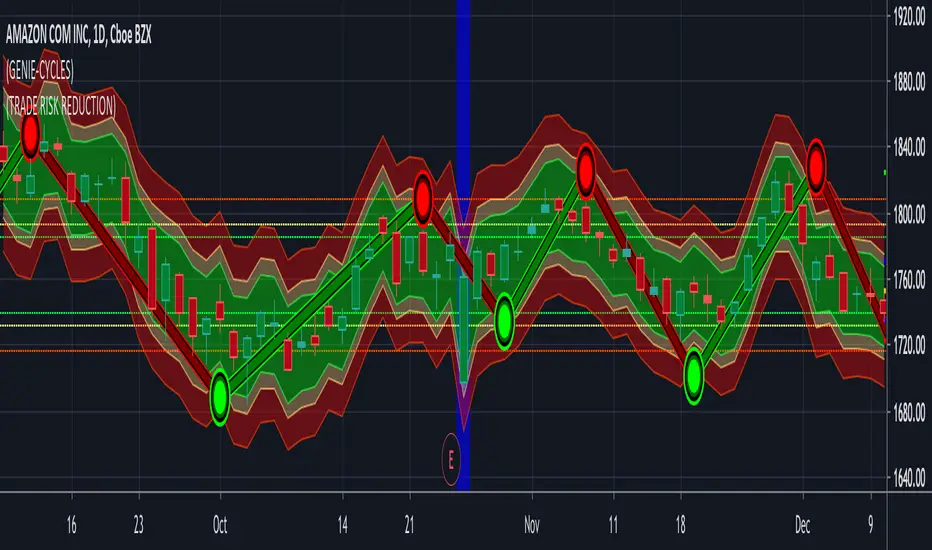
(15) Trade Risk Reduction VS-132TRR calculates the volatility of your stock. This is just the magnitude of each days price fluctuations, or what technicians refer to as the True Range. TRR averages the True Range (ATR) over three different time periods.
Why three? You want a sensitive indicator that reflect both the long term historical volatility of the equity as well as what that volatility is right now. Obviously the most recent trading days are the most important. The three ATR periods and their weighting factors are:
1) We use a 251 day period which equates to 1 trading year because we want to know what the historical volatility is. This one year period is not weighted.
2) We utilize a 21 day period because the most recent weeks tells us what the stock volatility has been over the previous calendar month. This is weighted by a factor of 2.
3) Finally, we utilize the last weeks data, Last 5 days, (L5D) to provide us with the stocks movement in the most recent trading days. This is weighted by a factor of 4.
The total of ATR251*(1) + ATR21*(2) + ATR5*(4) is then divided by the total of all factors (7).
This results in the Weighted Average True Range that the Trade Risk Reduction utilizes to produce the dynamic bands on your charts as well as power the Risk and Stop loss calculators. These indicate where this indicator is currently recommending you place stops. In the Format options of the application you are provided with the ability to adjust these band. Keep in mind that each stock will act in it's own unique and characteristic way. Looking closely at the stock's historical data, both in longer and shorter time periods should provide you with some insight into the normal variations and fluctuations of this particular equity. Below EBAY provides an example of this.
Access this Genie indicator for your Tradingview account, through our web site. (Links Below) This will provide you with additional educational information and reference articles, videos, input and setting options and trading strategies this indicator excels in.
TRUE
Relative Volume (RVOL) - ATR - R4RocketHello !!
This is a big upgrade on my earlier Indicator called "RVOL - R4Rocket". I could have updated the existing script, but there were two reasons for me to not do so.
1. I changed a lot of the previous code and added a lot of statistics like
a. Intraday Daily ATR Plot
b. Progressive (High - Low) Range as % of Daily ATR
c. % of RVOL Days in available chart data in any timeframe
d. In the new script RVOL Sectional has been removed as I did't find it very useful (Old script still has that feature)
e. And lastly and greatly, I modified the actual RVOL code (Huh ? Well I'll explain what I mean by this below)
2. Earlier I named my script just as RVOL. But then I though, well not everyone is going to search "Relative Volume" Indicator as "RVOL" Indicator, right? And Then during my second update I even tried to see whether I can change the script name but I couldn't figure it out. (Maybe it's not possible or maybe you know, "I DON'T HAVE ENOUGH BRAIN POWER" :P). So in order to make my script more accessible and easy to find for everubody so that it may add a little value to them in their trading, I'm changing the name of the script in this publication to "Relative Volume (RVOL) - ATR - R4Rocket". (Quite a big name, don't you think?)
Now as my reasons are out of the way, let me tell you about the indicator and the available options.
First let me explain what is RVOL basically. (Even after making 4 updates to my last script, I forgot to explain this......BIG BRAIN POWER :P)
It is calculated as (Cumulative sum of volume till time t from the start of the session) divided by the (Average of same period volume over a given number of days).
Lets say market starts at 09:30 am and right now the time is 10:00 am. So what RVOL does is it takes the sum of volume done from 9:30 am to 10:00 am for today and divides it by the same average volume that occurred between 9:30 to 10:00 in lets say X number of last days.
What this does is gives you the means to quantify how much everybody is interested today in the given stock w.r.t last X days. Generally higher the RVOL value - higher the public interest (due to some known or unknown reason like results / news / market condition etc) - and hence higher is the probability of stock movement on intraday basis. (Mostly everybody prefers to trade stocks intraday with RVOL > 2)
Now let's get back to the changes and the features.
1. It calculates Relative Volume
Adjusted in a way that the recent volume spike (e.g say due to quarterly result announcement or some other big news) don't skew the next day's
RVOL calculation. What this will do is, it will give you a good idea whether the stock is still in play the next day or a day after that.
LIGHTS !! CAMERA !! ANNNNNNDD ACTION !! (I love to watch movies, not very relevant here I know, but couldn't help it :P)
Now you can see in the image below the difference between old and new script RVOL calculations. This will help you to find out 2nd Day, 3rd Day plays.
To calculate RVOL first you have to choose your local exchange trading hours
E.g. NSE (India) trades from 09:15 to 15:30
NASDAQ (USA) trades from 09:30 to 16:00
LSE (UK) trades from 08:00 to 16:30 etc
Then you have to choose the RVOL period. This is the lookback period for cumulative volume average calculations.(I suggest using default value of 4 but it depends upon your preference and one more thing to note is that too high of a value will not even load the script due to some constraints that I don't know)
And last parameter is RVOL Trigger = What RVOL value YOU CONSIDER IMPORTANT. (I like 2 and if RVOL > RVOL Trigger then the columns will turn Green otherwise they will be Red. SIMPLE !!)
You can use any timeframe from 1 min to 1 Day. (Even custom timeframes like 2,4,6 will work fine)
1 min Chart
2 min Chart
2. It calculates Daily ATR in % terms of the day's open and plots it on intraday charts (and on daily charts too, if you want)
It's just what I just said - plain & simple.
You can see it in the image below. (Yellow dotted line and value in yellow color)
This will help you if you use profit targets or stop losses based on previous day's ATR values.
All you have to do is tick the Plot Daily ATR % box in inputs and choose the ATR Average.
3. The indicator calculates (High - Low) range as and when it extends throughout the day as the % of Daily ATR
This will help you quickly in finding which stocks are trading with extreme volatility.
Can be seen in the image below where the stocks trade @ almost 3 times or 300 % of the previous days ATR (Blue dotted line and value in blue color)
4. And lastly it gives you the statistic that will tell you how much is the average % of total days are RVOL days. (Did you get that ? It sounded great in my head but really don't know what I just said)
Let me tell you in terms of numbers. Lets say on daily timeframe Tradingview provides some 5000 bars worth of historical data. Out of that there were 16% days where RVOL was more than 2. Roughly speaking if you were to trade this stock every day then you would find on an average about 3 days per month with RVOL > 2.
(If you reduce the RVOL Trigger, then you will get more % RVOL days. In the second image if you reduce RVOL Trigger to 1.5 then you will have almost 27 % good trading days AS PER YOUR DESIRED & DEFINED PARAMETER OF RVOL TRIGGER = 1.5. Which translates to almost 6 days per month. You can play with it as you want and deem fit.)
RVOL Trigger = 2
RVOL Trigger = 1.5
“The goal of a successful trader is to make the best trades. Money is secondary.” – Alexander Elder
With best regards.
R4Rocket


Scott's historical ATR(volatility) percentileHistorical Volatility Percentile using Average True Range as measure of volatility.
Historical True Range Percentile

True Golden Cross by -Westy-
The “Golden Cross” of the 50 and 200 day SMA is not the most accurate combination profit-wise.
Testing of 1750 combinations over 300 years of data across 16 global markets revealed that the EMA produces better results than the SMA and the best settings are that of a 13 / 48 EMA Crossover.
Research credit to - etfhq.com

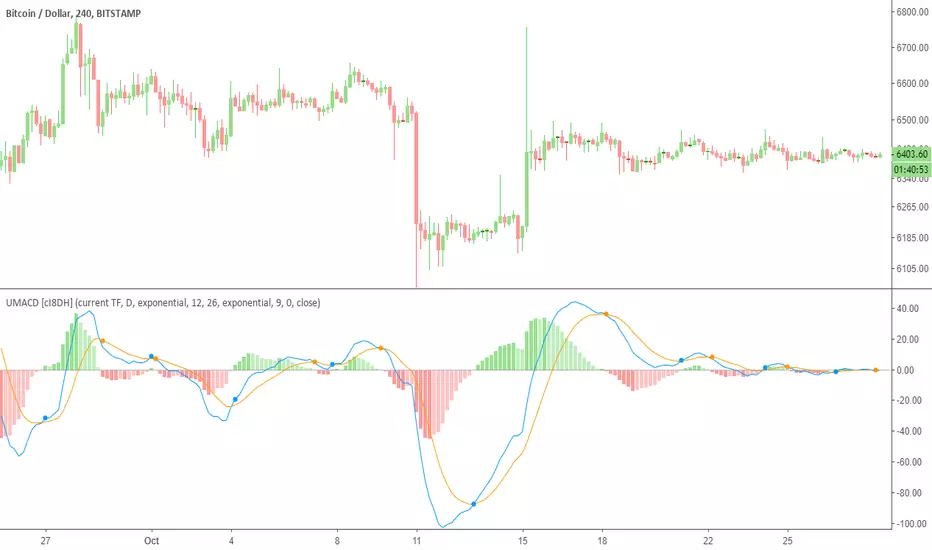
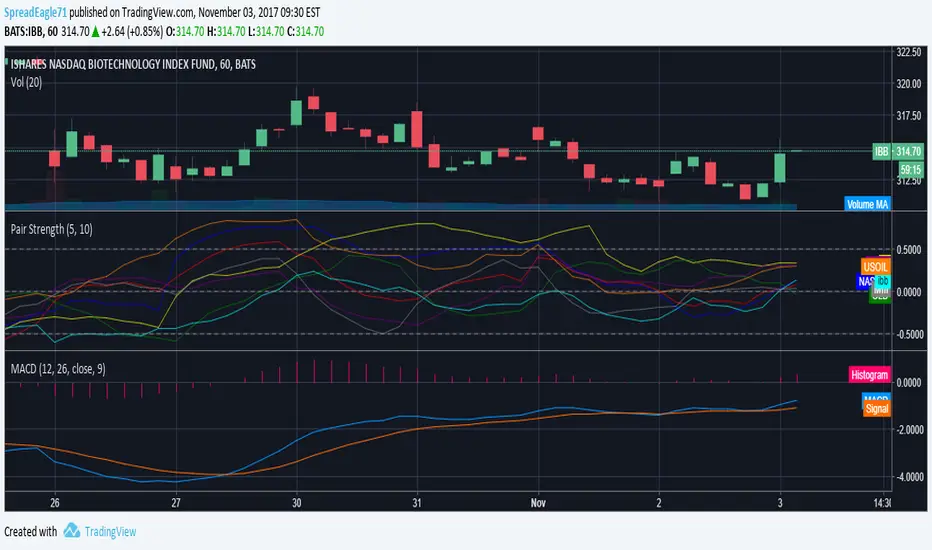
Ultimate MACD (UMACD) [cI8DH]Ultimate MACD ( UMACD ) includes True MACD fix, normalized MACD, multi time frame, bar coloring, and false cross avoidance options. It can also replicate Bill Williams Awesome Oscillator and Accelerator Oscillator. By default, this indicator is configured to work like the built-in MACD indicator. You need to customize it to your liking. Chart below shows example multi time frame setup.
True MACD and normalization
True MACD fix is similar to True RSI fix. The chart below proves that MACD is asymmetrical. This issue is most visible when analyzing charts across wide price ranges. It shows a logical problem in MACD, and most other indicators, as they can give you conflicting signals. For example, it can show long signal for both TRYUSD and its inverse pair USDTRY simultaneously. True MACD fixes this issue as shown in the chart below. Interestingly, this fix also normalizes MACD which is a major improvement upon regular MACD . (FYI, True MACD fix uses a different mechanism than my previous NMACD indicator.)
Avoiding false signals
This feature is very useful to avoid trading during sideways. To use this feature, set the std deviation multiplier option to a number greater than 1. I did some backtests on BTC chart with contract size set to 100% equity. It showed significant improvements for the time frames that I tested. (std deviation multiplier set to 1.5 @1h TF: 4x improvements, @2h: near 2x, 0.7 @4h: 2x, 0.4@12h: 3x, 0.4@daily: 1.5x). I also backtested True MACD fix separately and it showed significant improvement for most time frames.
Bar coloring
Bar coloring works similar to my previous indicators, Ultimate Money Flow and Ultimate RSI , and is subject to change in the future.
Bill Williams Awesome Oscillator and Accelerator Oscillator
Chart below both validates calculations in this indicator and also shows you how you can replicate Bill Williams AO indicators. You can apply all the features added to MACD to these indicators.
Here is a TL;DR list of my indicators to save you some time from looking at my obsolete indicators.
PS: I might publish the asymmetry fix as True MACD or as a general fix to all price-based indicators as an open source script in the future.
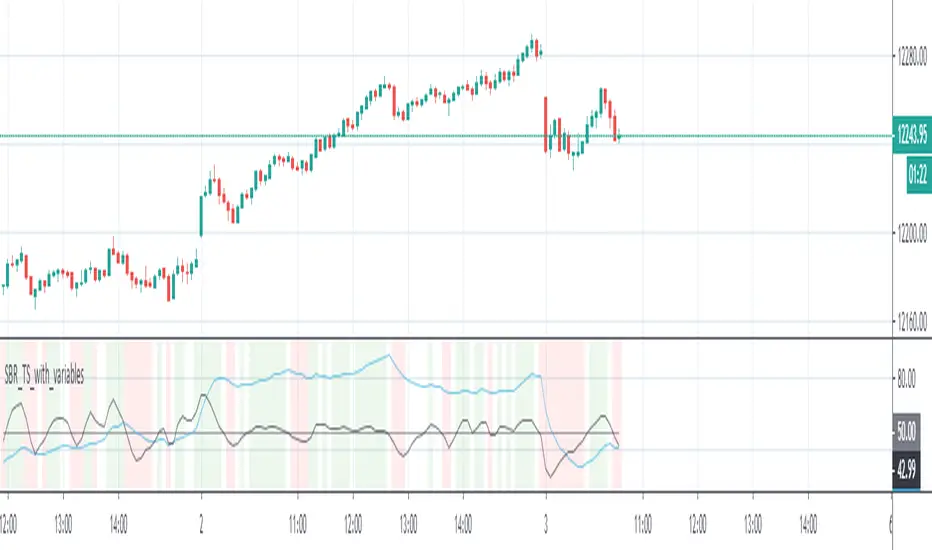
SBR_Trade_signalThis indicator is based on true strength indicator with wave trend oscillator.
Disclaimer: All the signals it is giving is based on the market movements only. I am not responsible for your PNL if you follow this indicator.
*Caution: Beta version
%ATR - TCTAThe enhanced version of %ATR of "codermua"
The %ATR calculated by EMA(red) , SMA(purple) and WMA(yellow) added to existing indicator which include only RMA(blue) calculation.

Pair Strength: Updated Version of the one by GlazI updated this version used for Forex with Stock&Index related instruments. Enjoy.
Average True Range - without open barBasic ATR without the current open bar in progress, it calculates the closed bars within the chosen ATR Period


Ro True PriceGiven enough time, market tends to oscillate around the true price. The true price slope gives information about the long term trend. Ro True Price lights red when the trend is down, green for up. If the color is blue market is in a decision period. For intraday lower the precission value to make signal sensitive to short term action.

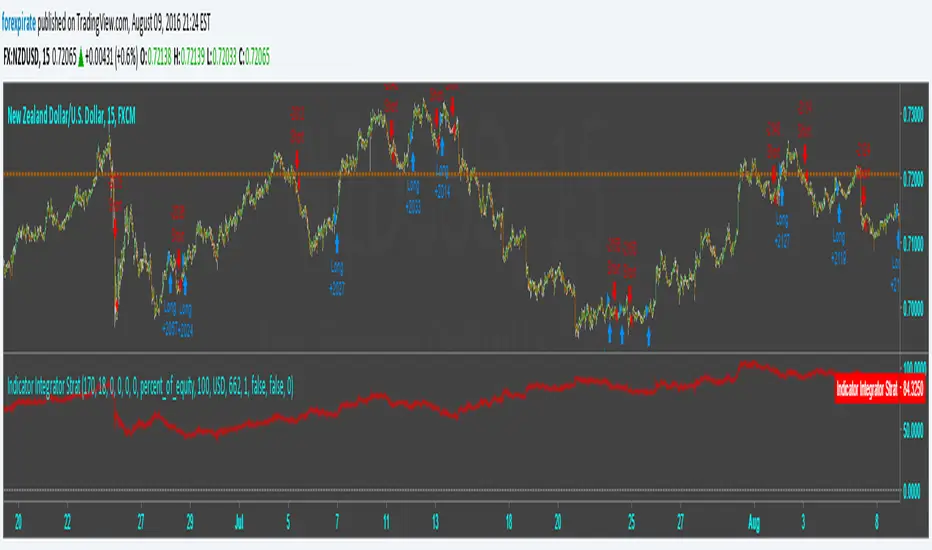
Indicator Integrator Strat <<<<<< Updated again, second2nd patch
Found an error in the orders. Script was making double orders at times. I fixed it. It is tuned as such:
NZDUSD
15 min chart
starting $USD to show 1000 contracts for minicontract with FXCM (start date 3-18 $633 ** see note)
Indicator plots Starting equity-trade gain and loses-number of trades time spread = net money
** with 1:50 leverage it requires $16 for one 1,000 contract.
$84 net vs $16 initial balance is 456% in 109 days.
* If you find errors please comment.
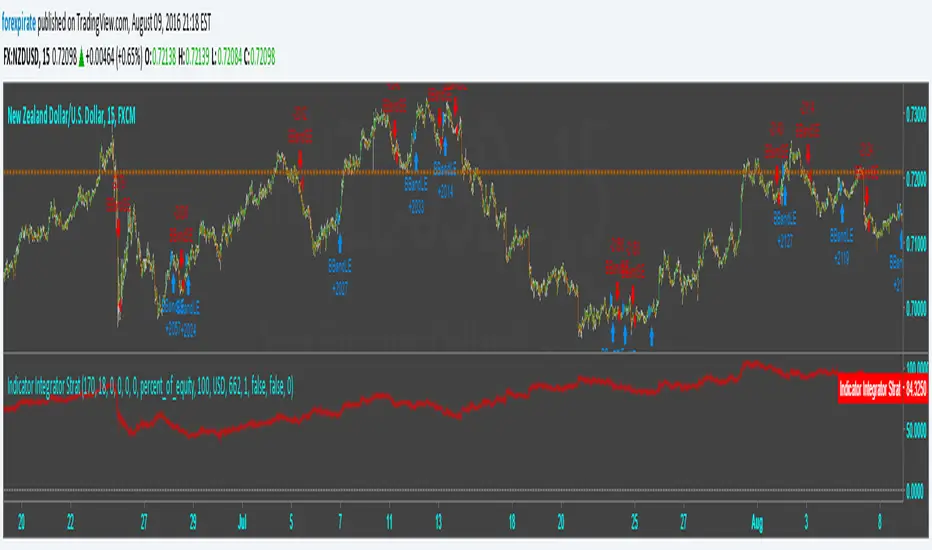
Indicator Integrator Strat <<<<<< UPDATED with CorrectionFound an error in the orders. Script was making double orders at times. I fixed it. It is tuned as such:
NZDUSD
15 min chart
starting $USD to show 1000 contracts for minicontract with FXCM (start date 3-18 $633 with 1:50 leverage)
Indicator plots ==> Starting equity - (trade gain and loses) - (number of trades) * (spread) = true balance estimate
CM ATR Stops/Bands - Multi-TimeFrameCM_MTF ATR Bands/Stops
Many Options Available Via Input Tab:
-Chart Defaults to Upper and Lower ATR's Based on Current Chart TimeFrame
-Ability to Plot either Upper and/or Lower ATR's
-Ability to Change the Time Frame ATR's are Based On!
-Ability to change Look Back Period and ATR Multiplier Individually for Both Time Frames
-This Gives you the ability to plot same Time Frame with (for ex.) a 5 ATR with a 1.5 Mult and a 14 ATR with a 2.0 Mult etc.
-Or you can plot Daily ATR's on a 60 minute Chart etc.
-ATR Multipliers are Calculated with Code that allows "Non Whole Numbers" Allowing Ability to use 1.5 ATR's, 1.8 ATR's etc.
***Endless # of Combinations can be used!!!!

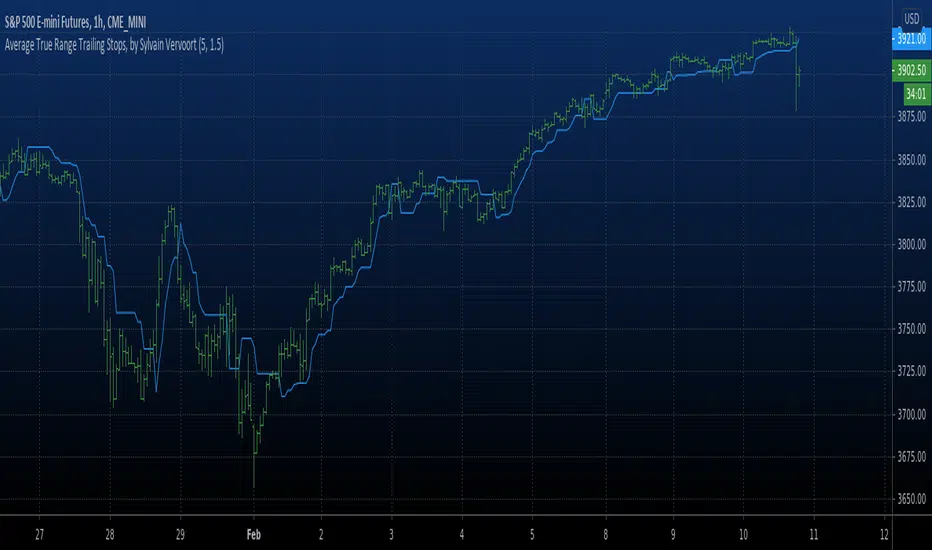
Average True Range Trailing Stops ColoredAverage True Range Trailing Stops Strategy, by Sylvain Vervoort
The related article is copyrighted material from Stocks & Commodities Jun 2009
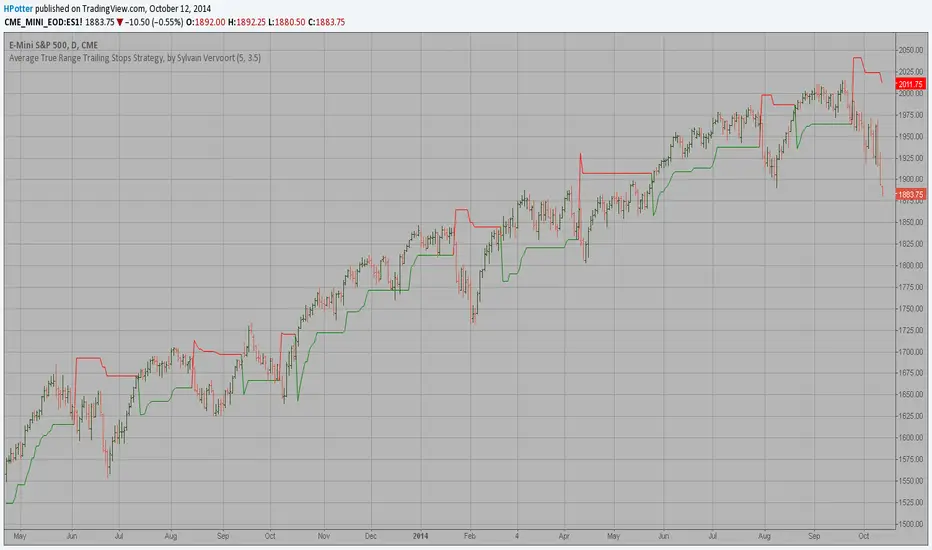
Average True Range Trailing Stops, by Sylvain Vervoort Average True Range Trailing Stops, by Sylvain Vervoort
The related article is copyrighted material from Stocks & Commodities Jun 2009