Volume Weighted Average Price @Marx_CapitalSimple VWAP indicator edited to not connect the lines between sessions for a cleaner look without vertical lines at session ends.
Session end and start times are customizable.
Volumeweightedaverageprice

Rolling VWAP Indicator🧭 Rolling VWAP Indicator
Overview
The Rolling VWAP Signals indicator offers a clean, real-time view of price behavior relative to its volume-weighted fair value.
It extends the traditional VWAP concept by introducing a Rolling VWAP that continuously adapts over a dynamic window of recent bars, allowing traders to visualize evolving equilibrium zones without being limited to daily or session resets.
Additionally, it includes a Multi-Timeframe (MTF) Trend Bias Filter — designed not to recalculate VWAP across timeframes, but to confirm directional alignment with higher-timeframe momentum. This ensures that short-term signals are traded only when the broader bias agrees, reducing false reversals and improving signal quality.
VWAP vs Rolling VWAP
The Volume-Weighted Average Price (VWAP) is one of the most widely used institutional benchmarks.
It represents the average traded price weighted by volume — effectively the market’s “fair value.”
However, standard VWAP resets each day or session, losing continuity across time and ignoring cumulative order flow beyond that session.
The Rolling VWAP used here continuously recalculates over a moving window of the most recent bars:
• It adapts naturally to 24×7 markets such as crypto and indices.
• It reflects the current consensus of price and volume rather than starting from zero each morning.
• It acts as a dynamic fair-value magnet, showing when price deviates too far from equilibrium.
In short:
• Standard VWAP → resets daily, suited for intraday benchmarks.
• Rolling VWAP → continuous measure of short-term market balance and sentiment.
How It Works
1. Rolling VWAP Calculation
Uses the last N bars (auto-adjusted by timeframe: e.g., 288 for 5-min, 96 for 15-min, 24 for 1-hour) to compute the continuously weighted mean price:
RVWAP = \frac{\sum(Price \times Volume)}{\sum(Volume)}
2. VWAP Bands
Three deviation envelopes are plotted above and below RVWAP at user-defined percentages — visual zones of overbought/oversold or expansion/compression.
3. Signal Logic
• Buy Signal: price closes above the Rolling VWAP after being below (bullish reclaim).
• Sell Signal: price closes below the Rolling VWAP after being above (bearish rejection).
• Cooldown Period: blocks repeated signals within a set bar interval to avoid whipsaws.
4. MTF Trend Bias
• Pulls higher-timeframe trend direction (e.g., from 1-hour while trading 5-min).
• Signals are confirmed only when short-term cross aligns with higher-timeframe bias.
• This filter does not modify or recalculate the VWAP — it purely acts as a directional validator.
5. Session Filter
Restrict signal generation to defined trading hours and timezone (e.g., 09:30–13:00 NY). Its for US market positional traders.
6. Dashboard Panel
Displays system states: data sufficiency, session activity, VWAP bias, cooldown status, and Buy/Sell signal triggers.
Why It’s Useful
• Provides a real-time adaptive fair-value anchor instead of static daily VWAP.
• Highlights both trend continuation and mean-reversion zones.
• Integrates MTF bias confirmation to trade only in line with higher-timeframe flow.
• Eliminates clutter — no oscillators or complex models, just price vs volume behavior.
How to Use
1. Apply on any timeframe (5M–4H).
2. Observe Buy (green) and Sell (red) signals relative to the blue Rolling VWAP line.
3. Enable MTF Trend Bias to confirm signals with higher-timeframe direction.
4. Use deviation bands for identifying overextended conditions or pullback opportunities.
5. Monitor the dashboard for live system feedback.
Customization
• Auto or manual Rolling VWAP window.
• Adjustable band multipliers.
• MTF bias confirmation toggle.
• Session and timezone settings.
• Dashboard size and placement.
Conceptual Takeaway
The Rolling VWAP Simple Signals indicator combines the strength of volume-weighted mean reversion with higher-timeframe directional filtering, producing clear, context-aware entries and exits.
It answers two critical trader questions:
“Where is the real, volume-based fair value right now?”
“Does my signal align with the larger trend?”
⚠️ Disclaimer
This indicator is designed s olely for educational and analytical purposes . It does not constitute financial advice, investment recommendation, or trading signal service. Trading involves substantial risk and may not be suitable for all investors. Always perform your own analysis and use proper risk management before taking any trade. The author assumes no liability for financial losses resulting from the use or interpretation of this tool.

Dynamic EMA x VWAP AlertsDynamic EMA × VWAP Alerts generates buy and sell signals only when an EMA crossover happens in a meaningful VWAP (or standard deviation band) context. By combining classic EMA logic with flexible VWAP anchors (Daily, Weekly, Rolling) and optional advanced filters (ATR, Relative Volume, Deviation, Distance, Time Windows) to trim noise further, the script creates location-aware, filterable alerts rather than “everywhere” crosses. The value for trading and originality here lies in the integration of one or multiple anchors, band gating, combinator logic, and advanced regime filters. It’s designed for use across multiple instruments and timeframes, where EMA/VWAP context is relevant. It can run quietly in the background while you focus on price action and your own S/R levels.
What it does (quick take)
Detects EMA crossovers (double or optional triple) and evaluates them in VWAP context.
Plots Buy/Sell markers only when all chosen conditions are met.
Clean UX: keep all or parts of the engine visible or hide everything and let alerts run based on the silent engine behind your own S/R levels in an uncluttered, practical chart, as illustrated below.
Engine illustration: All selected engines visible
Practical use case: Same snapshot sequence as above but all selected engines invisible
Swing examples (beyond intraday)
Signals-only (clean value view):
Signals + your own S/R lines:
EMA selection (choose your playbook)
Defaults: Fast 9, Medium 21 (common intraday combo).
Modes: Double Cross — Fast vs Medium.
Triple Cross (optional) — adds a Slow EMA trend filter (enable Slow > 0).
Ranges: you can set each EMA 0–200 (0 = hidden/off)
Visuals are optional; you can display or hide each EMA line
EMA cross footprints (optional): Helps you assess trend continuation or change.
Use your own strategy: switch to 9/50, 20/50, 50/200, or whatever EMA set you trust for your instrument/timeframe.
VWAP Selection (the context engine)
Daily VWAP – resets each chart day (00:00–23:59). Typical fit: scalpers and fast intraday decision points.
Weekly VWAP – resets at the start of the calendar week. Typical fit: intraday with higher-timeframe context (aligns day trades with weekly bias).
Rolling VWAP – an adjustable VWMA-based rolling anchor (not session-reset), used as a flexible context reference Typical fit: multi-day swings when you want a flexible anchor that adapts across sessions.
Standard deviation bands (σ ±1/±2/±3) available for each anchor and help you express the “how far from fair value” idea.
Why VWAP matters: it’s a running, volume-weighted anchor where strong moves relative to VWAP and its bands help frame mean-reversion vs. trend-continuation risk. Evaluating crosses relative to VWAP/±σ reduces “everywhere” noise and helps frame potential setups.
How alerts are decided
An alert triggers only when:
Your selected EMA crossover occurs, and
Your chosen VWAP gate(s) and any filters pass. (Computed on bar close to avoid mid-bar noise)
Signals and alerts do not repaint; alerts evaluate and fire once per bar close.
Alert gates (Single / AND / OR)
Select one VWAP source or combine two (e.g., Daily + Weekly) with Single, AND, or OR logic.
Choose gate levels from VWAP or standard deviation bands (±σ). Typical long logic: price at/under VWAP or −σ. Typical short logic: price at/over VWAP or +σ.
Practical recipes:
Trend-follow: Daily AND Weekly at/above VWAP → confirms strength on two anchors.
Mean-reversion probe: Daily OR Rolling at −1σ → allows earlier fades with flexibility.
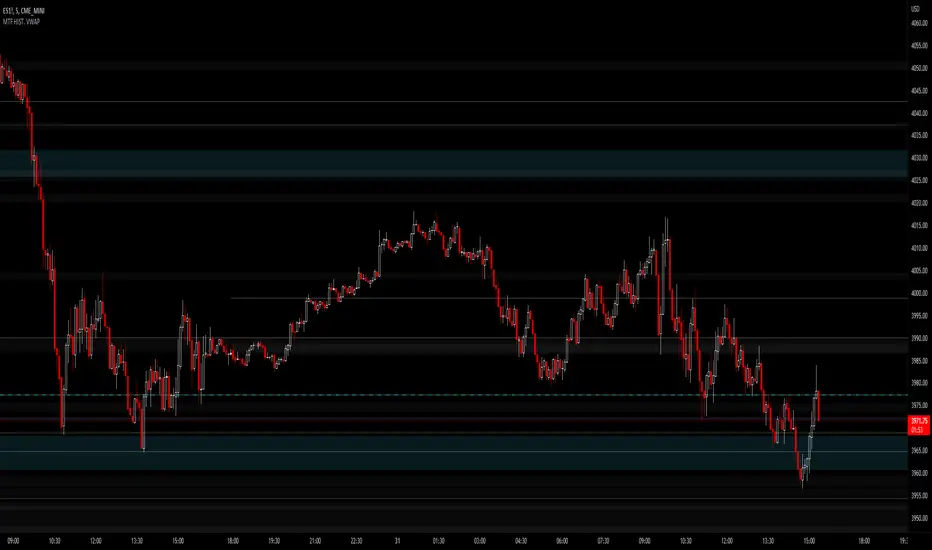
Advanced filtering: Suitable for advanced/Quant traders
During the research and development of this indicator, the EMA/VWAP cross logic was tested on historical S&P500 Futures data to explore patterns on multiple timeframes. These selected filtering indicators below showed correlation between certain market conditions and chosen indicator thresholds, helping reduce noise and lower-quality alerts. Results were research-oriented and are not predictive of future performance.
Therefore, I have built these indicator filters that run silently in the background. They let you trim noise by requiring alerts to appear only in market regimes you define. Each one constrains alert conditions; using them together helps tailor alerts to your strategy—but overly strict settings may filter out most or all alerts.
Relative Volume (RVOL): compares current volume to a baseline; ensures alerts arrive with participation instead of thin tape.
Deviation Threshold (%): controls how close the cross must be to the VWAP/σ level; tight = anchored signals, loose = more activity.
ATR Gate (+ Relative regime): keeps alerts inside a volatility regime; avoids both dead tape and chaotic spikes.
Distance Guard: requires price to be at least X ticks/% away from VWAP; useful to avoid premature signals near fair value.
Note: It’s not recommended to activate all of them at once or change the values aggressively. Unless you’ve done deeper backtesting or machine learning calibration, you can easily filter out everything. Use small thresholds at first, then adjust to your instrument once you see how each filter changes alert frequency and quality. Advanced/quant users can fine-tune freely.
Case example:
Unfiltered: Timeframe 15 min, EMA Selection 9/21, VWAP gates Rolling (250 bars) OR Weekly
Filtered: Same setup as above + activated filters:
RVOL: 100 bars, Min. RVOL 0.4
Deviation threshold (%): 0.3
ATR Length: 14
Min ATR (%): 0.05
Relative regime: Base length 2000, Min Ratio 0.85, Max Ratio 2
Under the hood
This indicator leans on TradingView built-ins (e.g., EMA, VWMA, ATR, alertcondition) to maximize speed, stability, and compatibility while we implement the custom logic (VWAP anchors, band gating, combinator gates, advanced filters, time windows). Built-ins were easy to work with and reduced edge-case bugs and kept the visuals responsive, while the design gives fine-tuning and clean visuals—so both discretionary traders and quant-minded users can shape the alerts to their strategy and workflow.
Disclaimer
The tools, scripts, and indicators presented here are provided for educational and informational purposes only. They are not financial advice and should not be interpreted as investment recommendations, trading signals, or a solicitation to buy or sell any financial instrument.
All forms of trading and investing involve risk. The past performance of any security, strategy, or market condition does not guarantee future outcomes. Users are solely responsible for their own trading and investment decisions, including evaluating their financial situation, objectives, and risk tolerance.
By using this indicator, you acknowledge that you do so at your own risk. The author accepts no liability for any direct or indirect loss or damage—including, without limitation, loss of profits—that may arise from the use of, or reliance upon, this tool.

VWAP Multi-TimeframeThis is a multi-timeframe VWAP indicator that provides volume weighted average price calculations for the following time periods:
15min
30min
1H
2H
4H
6H
8H
12H
1D
1W
1M
3M
6M
1Y
You can use the lower timeframes for short term trend control areas and use the longer timeframes for long term trend control areas. Trade in the direction of the trend and watch for price reactions that you can trade when price gets close to or touches any of these levels.
This indicator will provide a data plot value of 1 for bullish when price is above all VWAPs that are turned on, -1 for bearish when price is below all VWAPs that are turned on and 0 for neutral when price is not above or below all VWAPs. Use this 1, -1, 0 value as a filter on your signal generating indicators so that you can prevent signals from coming in unless they are in the same direction as the VWAP trend.
Features
Trend direction value of 1, -1 or 0 to send to external indicators so you can filter your signal generating indicators using the VWAP trend.
Trend table that shows you whether price is above or below all of the major VWAPs. This includes the daily, weekly, monthly and yearly VWAPs.
Trend coloring between each VWAP and the close price of each candle so you can easily identify the trend direction.
Customization
Set the source value to use for all of the VWAP calculations. The default is HLC3.
Turn on or off each VWAP.
Change the color of each VWAP line.
Change the thickness of each VWAP line.
Turn on or off labels for each VWAP or turn all labels on or off at once.
Change the offset length from the current bar to the label text.
Change the label text color.
Turn on or off trend coloring for each VWAP.
Change the color for up trends and down trends.
Turn on or off the trend direction display table.
Change the location of the trend direction display table.
Adjust the background and text colors on the trend direction display table.
How To Use The Trend Direction Filtering Feature
The indicator will provide a data plot value of 1 for bullish when price is above all of the VWAPs that are turned on, a value of -1 for bearish when price is below all of the VWAPS that are turned on and a value of 0 for neutral when price is above and below some of the VWAPs that are turned on.
The name of the value to use with your external indicators will show up as: VWAP Multi-Timeframe: Trend Direction To Send To External Indicators
Make sure to use that as your source on your external indicators to get the correct values.
This 1, -1 or 0 value can then be used by another external indicator to tell the indicator what is allowed to do. For instance if you have another indicator that provides buy and sell signals, you can use this trend direction value to prevent your other indicator from giving a sell signal when the VWAP trend is bullish or prevent your other indicator from giving a buy signal when the VWAP trend is bearish.
You will need to program your other indicators to use this trend filtering feature, but this indicator is already set up with this filtering code so you can use it with any other indicator that you choose to filter(if you know how to customize pine script).
Markets You Can Use This Indicator On
This indicator uses volume and price to calculate values, so it will work on any chart that provides volume and price data.

Advanced VWAP Multi-MA System with Bollinger Bands & Dashboard📊 Key Features:
Core Functionality:
* VWAP Calculation with customizable anchor periods (Session/Week/Month/Quarter/Year)
* Multiple Moving Average Types (EMA, SMA, WMA, HMA, RMA, VWMA)
* Three MA Lengths (Fast: 9, Medium: 21, Slow: 50)
* Standard Deviation Bands with 3 levels (1σ, 2σ, 3σ)
* Dynamic band multipliers (adjustable from 0.5 to 5.0)
🎨 Visual Theme System:
* Theme Types: Dark, Light, Pro
* Visual Styles: Quantum, Holographic, Crystalline, Plasma, Nebula
* Visual Intensity Control (20-100%)
* Multi-layer Harmonic Nodes with gradient effects
* Energy Flow Lines based on momentum
* Minimal signal dots for buy/sell conditions
📈 Holographic Dashboard:
* Real-time VWAP position tracking
* MA trend analysis (Bullish/Bearish/Neutral)
* Band position indicator (±1σ, ±2σ, ±3σ)
* Volatility percentage
* Momentum direction
* Current visual theme display
✨ Visual Effects:
* Quantum Fields: Multi-layer boxes with dynamic transparency
* Energy Flow: Momentum-based directional lines
* Gradient Fills: Between bands and MAs
* Borderless Design: Clean, modern appearance
* Emoji Headers: Enhanced visual appeal (⚡ 🌌 📊 🔮)
🎯 Trading Signals:
* Bullish Signal: Close > VWAP AND Close > Fast MA AND Fast MA > Medium MA
* Bearish Signal: Close < VWAP AND Close < Fast MA AND Fast MA < Medium MA

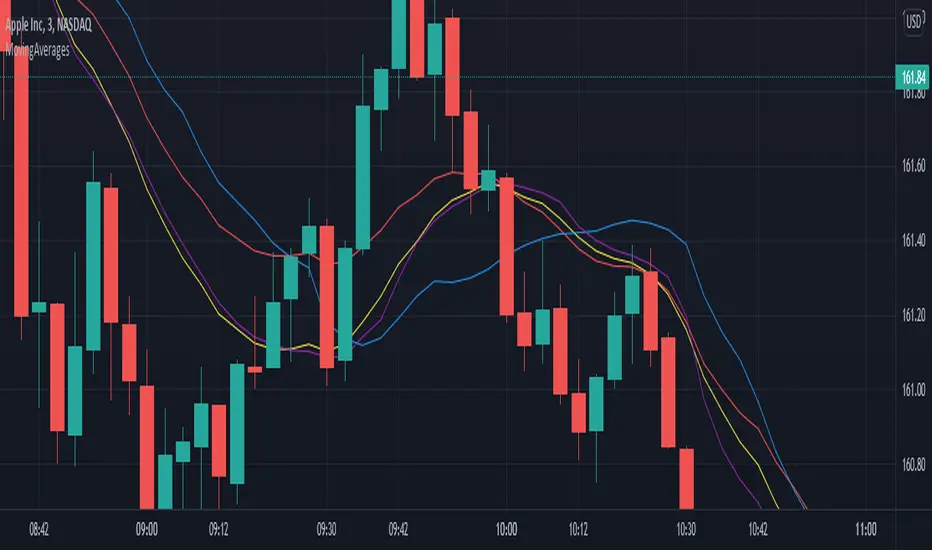
Sniper Mini VWAPThis script plots dynamic, session-based VWAPs for key intraday timeframes:
1H (green), 4H (orange), 8H (purple), and Daily (red).
Each VWAP resets at the start of its own session, giving traders a real-time view of price relative to average volume-weighted value. These lines often act as intraday support, resistance, or liquidity magnets — great for scalping, fade setups, and sniper-style entries.
You can toggle each VWAP on or off for a cleaner chart.
This version does not use anchored VWAPs — it’s designed for traders who need fast feedback as price develops within active sessions.

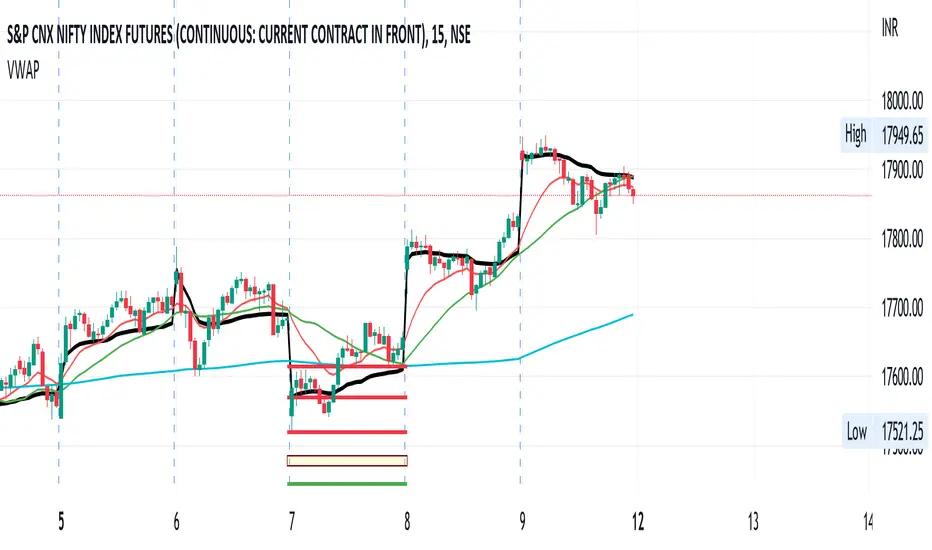
Stochastic and RSI2 entriesStochastic and RSI2 entries, v1.0
This indicator combines Stochastic and RSI to facilitate "RSI2" entry signals. Buy signals will be shown at the bottom.
The default configuration uses non-standard settings for the underlying indicators to tailor it for this type of entry strategy.
This is an entry strategy that tries to find entries close to "the dip".
A combination of Stochastic crossovers, VWAP, daily SMA50 and daily SMA200 are used to verify buy signals.
This indicator is written for bullish signals and aims to find the start of short trends or cheap entries for longer positions.
Like with any strategy, some signals will be false, and the user is advised to do some own research before using the buy signals for actual entries.
Happy trading!

Rogue ORB PRORogue ORB Pro is a precision-engineered Opening Range Breakout (ORB) indicator built for active intraday traders who need real signals, not noise.
This tool identifies high-probability breakout entries from the opening range, enhanced with optional ATR-based stop loss levels, deviation targets, cooldown filters, and a relative volume gate to filter weak setups.
🔍 Key Features:
Opening Range High/Low: Drawn from a user-defined time window and locked for the day
Deviations: Automatically plots target zones above and below the OR range (e.g. 1, 2 deviations)
Pre-Market Levels: Automatically draws pre market high and low lines at the end of pre market session
Buy/Sell Signals: Triggered on breakout of the OR High/Low with configurable breakout logic (touch or close)
ATR Stop Loss Line: Dynamically drawn at a fixed ATR distance from breakout candle, with optional SL label
Cooldown Period: Prevents back-to-back signals by enforcing a user-defined bar delay between entries, can help with overtrading
Volume Filter: Optional relative volume filter that requires breakout candles to exceed a custom volume threshold
VWAP Overlay: Visual VWAP for directional bias and confluence

Multi-Timeframe VWAP Master ProThe Multi-Timeframe VWAP Suite is a comprehensive and highly customizable indicator designed for traders who rely on Volume-Weighted Average Price (VWAP) across multiple timeframes and periods. This tool provides a complete suite of VWAP calculations, including daily, weekly, monthly, quarterly, yearly, and custom VWAPs, allowing traders to analyze price action and volume trends with precision. Whether you're a day trader, swing trader, or long-term investor, this indicator offers unparalleled flexibility and depth for your trading strategy.
Multi-Timeframe VWAPs:
Daily, Weekly, Monthly, Quarterly, and Yearly VWAPs: Track VWAP across various timeframes to identify key support and resistance levels.
Customizable Timeframes: Use the SMA timeframe input to adjust the period for moving averages and other calculations.
Previous Period VWAPs:
Previous Daily, Weekly, Monthly, and Quarterly VWAPs: Analyze historical VWAP levels to understand past price behavior and identify potential reversal zones.
Previous Year Quarterly VWAPs: Compare current price action to VWAP levels from specific quarters of the previous year.
Custom VWAPs:
Custom Start Date and Timeframe: Define your own VWAP periods by specifying a start date and timeframe, allowing for tailored analysis.
Dynamic Custom VWAP Calculation: Automatically calculates VWAP based on your custom inputs, ensuring flexibility for unique trading strategies.
Seasonal and Yearly VWAPs:
April, July, and October VWAPs: Analyze seasonal trends by tracking VWAP levels for specific months.
Yearly VWAP: Get a broader perspective on long-term price trends with the yearly VWAP.
SMA Integration:
SMA Overlay: Combine VWAP analysis with a Simple Moving Average (SMA) for additional confirmation of trends and reversals.
Customizable SMA Length and Timeframe: Adjust the SMA settings to match your trading style and preferences.
User-Friendly Customization:
Toggle Visibility and Labels: Easily enable or disable the display of specific VWAPs and their labels to keep your chart clean and focused.
Color Customization: Each VWAP line and label is color-coded for easy identification and can be customized to suit your preferences.
Dynamic Labeling:
Automatic Labels: Labels are dynamically placed on the last bar, providing clear and concise information about each VWAP level.
Customizable Label Text: Labels include detailed information, such as the timeframe or custom period, for quick reference.
Flexible Timeframe Detection:
Automatic Timeframe Detection: The indicator automatically detects new days, weeks, months, and quarters, ensuring accurate VWAP calculations.
Support for Intraday and Higher Timeframes: Works seamlessly on all chart timeframes, from 1-minute to monthly charts.
Previous Year Quarterly VWAPs:
Q1, Q2, Q3, Q4 VWAPs: Compare current price action to VWAP levels from specific quarters of the previous year.
User-Selectable Year: Choose the year for which you want to calculate previous quarterly VWAPs.
Persistent Monthly VWAPs:
Option to Persist Monthly VWAPs Year-Round: Keep monthly VWAP levels visible even after the month ends for ongoing analysis.
Comprehensive Analysis: Combines multiple VWAP timeframes and periods into a single tool, eliminating the need for multiple indicators.
Customizable and Flexible: Tailor the indicator to your specific trading strategy with customizable timeframes, periods, and settings.
Enhanced Decision-Making: Gain deeper insights into price action and volume trends across different timeframes, helping you make more informed trading decisions.
Clean and Organized Charts: Toggle visibility and labels to keep your chart clutter-free while still accessing all the information you need.
Ideal For:
Day Traders: Use daily and intraday VWAPs to identify intraday support and resistance levels.
Swing Traders: Analyze weekly and monthly VWAPs to spot medium-term trends and reversals.
Long-Term Investors: Leverage quarterly and yearly VWAPs to understand long-term price behavior and key levels.
Seasonal Traders: Track April, July, and October VWAPs to capitalize on seasonal trends.
The Multi-Timeframe VWAP Suite is a powerful and versatile tool for traders of all styles and timeframes. With its comprehensive suite of VWAP calculations, customizable settings, and user-friendly design, it provides everything you need to analyze price action and volume trends with precision and confidence. Whether you're looking to fine-tune your intraday strategy or gain a broader perspective on long-term trends, this indicator has you covered.

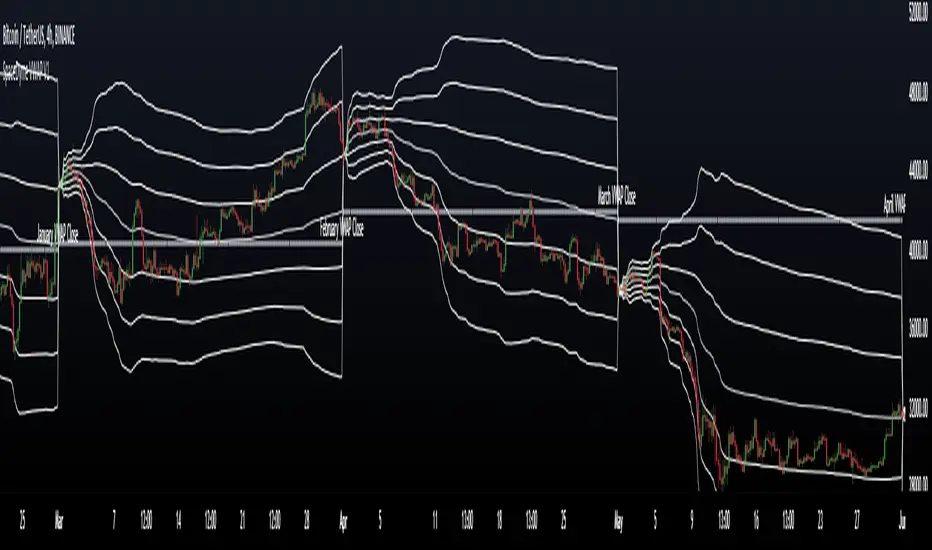
VWAP Periodic Close [LuxAlgo]The VWAP Periodic Close script offers an advanced tool for analyzing the Volume Weighted Average Price (VWAP) across various timeframes.
This tool enables traders to visualize VWAP close levels for daily, weekly, monthly, quarterly, and yearly periods, offering a comprehensive view of price behavior across different time frames. It helps in identifying key levels where the VWAP closes at the end of each specified period.
🔶 USAGE
This script is designed to enhance your trading strategy by plotting VWAP close levels on your chart for different time periods. This helps traders easily identify historical VWAP levels and analyze price action relative to these levels, particularly useful for identifying key support and resistance levels providing insights into potential future price behavior.
Supports VWAP closes for multiple timeframes, including historical periods (e.g., 3 months back, 3 quarters back, 3 years back). The labels provide context and detailed information about the VWAP close at a specific point in time and enhance the clarity and usefulness of the VWAP data presented on the chart.
Users can toggle the display of VWAP lines for different periods and customize the colors for each timeframe (e.g., distinct colors for monthly, quarterly, and yearly closes).
🔶 SETTINGS
The script offers a range of customizable settings to tailor the analysis to your trading needs.
🔹 Volume Weighted Average Price (VWAP)
VWAP Close Level: Toggle the display of VWAP levels at the end of each period (daily, weekly, monthly, quarterly, yearly).
VWAP Origin: Toggle the display of the VWAP line for each period.
VWAP Source: Choose the data source for VWAP calculations (default is HLC3).
Historical Closes: Define the number of historical VWAP levels to plot.
Line/Label Offset: Adjust the offset for positioning lines and labels on the chart.
🔹 Themes
Theme Selection: Choose between "Day," "Night," or "Custom" themes to adjust the color scheme of VWAP lines and labels.

Session VWAPS [QuantVue]The Session VWAPS indicator is a designed for traders to enhance their trading analysis by incorporating Volume Weighted Average Price (VWAP) anchored to custom-defined trading sessions.
This indicator automatically plots VWAPs at three critical points of a user defined session:
🔹session start
🔹session high
🔹session low
Additionally, it provides the option to display the VWAPs from previous sessions, offering a look at potential areas of support and resistance.
Anchored VWAP, or Anchored Volume-Weighted Average Price, is a technical analysis tool used to determine the average price of a stock weighted by volume, starting from a specific point in time chosen by the analyst.
Unlike traditional VWAP, which starts at the beginning of the trading session, the anchored VWAP allows traders to select any point on the chart, such as a significant event, price low, high, or a breakout, to begin the calculation.
VWAP incorporates price and volume in a weighted average and can be used to identify areas of support and resistance on the chart.
Indicator Features:
Custom Session Definition:
Users can define their own trading sessions by specifying start and end times, allowing for tailored analysis according to individual trading strategies or market hours.
Anchored VWAP at Three Key Points:
🔹Session Start VWAP: This VWAP is anchored at the start of the defined session.
🔹Session High VWAP: Anchored at the highest price point within the session.
🔹Session Low VWAP: Anchored at the lowest price point within the session.
Previous Session VWAPs:
The indicator can display VWAPs from the previous session, allowing traders to spot potential areas of support and resistance.
Give this indicator a BOOST and COMMENT your thoughts below!
We hope you enjoy.
Cheers!

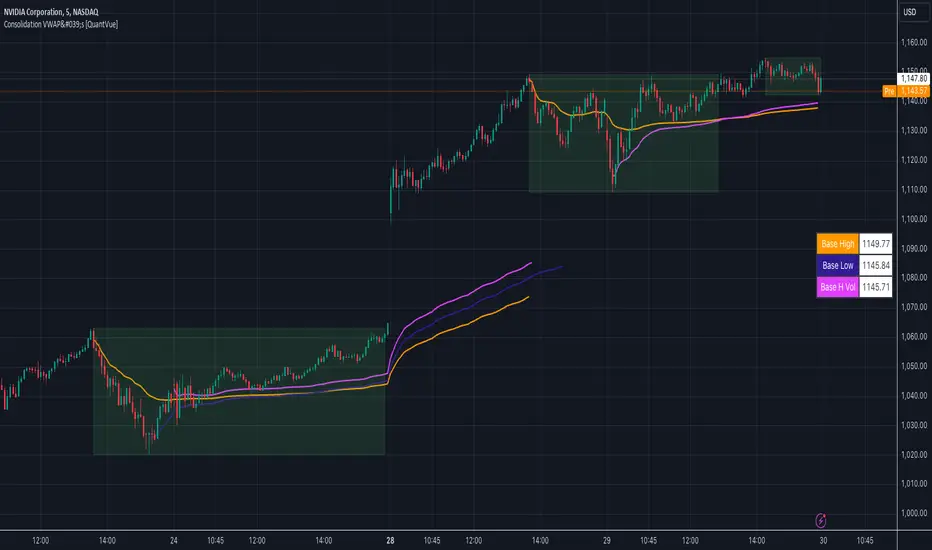
Consolidation VWAP's [QuantVue]Introducing the Consolidation VWAP's Indicator , a powerful tool designed to identify consolidation periods in stock advance and automatically anchor three distinct VWAPs to key points within the consolidation.
Consolidation Period Identification:
The indicator automatically detects periods of consolidation or areas on the chart where a stock's price moves sideways within a defined range. This period can be seen as the market taking a "breather" as it digests the previous gains. Consolidations are important because they often act as a base for the next move, either continuing the previous uptrend or reversing direction.
Consolidation requirements can be customized by the user to match your instrument and timeframe.
Maximum Consolidation Depth
Minimum Consolidation Length
Maximum Consolidation Length
Prior Uptrend Amount
Anchored VWAP, or Anchored Volume-Weighted Average Price, is a technical analysis tool used to determine the average price of a stock weighted by volume, starting from a specific point in time chosen by the analyst.
Unlike traditional VWAP, which starts at the beginning of the trading session, the anchored VWAP allows traders to select any point on the chart, such as a significant event, price low, high, or a breakout, to begin the calculation.
VWAP incorporates price and volume in a weighted average and can be used to identify areas of support and resistance on the chart.
VWAP Anchored to Consolidation High: This VWAP is anchored at the highest price point within the identified consolidation period. It helps traders understand the
average price paid by buyers who entered at the peak of the consolidation.
VWAP Anchored to Consolidation Low: This VWAP is anchored at the lowest price point within the consolidation. It provides insights into the average price paid by
buyers who entered at the lowest point of the consolidation.
VWAP Anchored to Highest Volume in the Consolidation: This VWAP is anchored at the price level with the highest trading volume during the consolidation. It reflects the average price at
which the most trading activity occurred, often indicating a key support or resistance level.
The indicator also allows the trader to see past consolidation areas and previous anchored VWAP's.
Give this indicator a BOOST and COMMENT your thoughts!
We hope you enjoy.
Cheers!
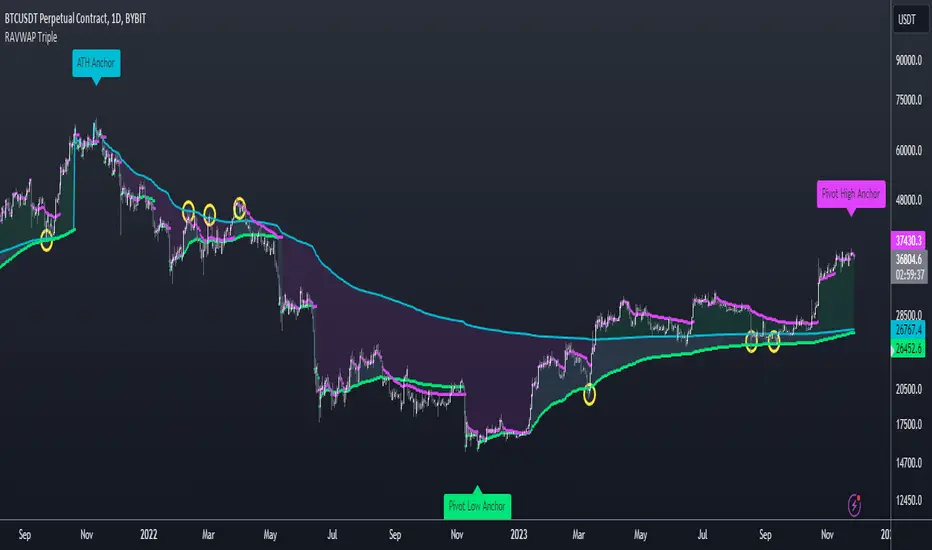
Re-Anchoring VWAP TripleThe Triple Re-Anchoring VWAP (Volume Weighted Average Price) indicator is a tool designed for traders seeking a deeper understanding of market trends and key price levels. This indicator dynamically recalibrates VWAP calculations based on significant market pivot points, offering a unique perspective on potential support and resistance levels.
Key Features:
Dynamic Re-anchoring at All-Time Highs (ATH) : The first layer of this indicator continuously tracks the all-time high and recalibrates the VWAP from each new ATH. This VWAP line, typically acting as a dynamic resistance level, offers insights into the overbought conditions and potential reversal zones.
Adaptive Re-anchoring to Post-ATH Lows : The second component of the indicator shifts focus to the market's reaction post-ATH. It identifies the lowest low following an ATH and re-anchors the VWAP calculation from this point. This VWAP line often serves as a dynamic support level, highlighting key areas where the market finds value after a significant high.
Re-anchoring to Highs After Post-ATH Lows : The third element of this tool takes adaptation one step further by tracking the highest high achieved after the lowest low post-ATH. This VWAP line can act as either support or resistance, providing a nuanced view of the market's valuation in the recovery phase or during consolidation after a significant low.
Applications:
Trend Confirmation and Reversal Signals : By comparing the price action relative to the dynamically anchored VWAP lines, traders can gauge the strength of the trend and anticipate potential reversals.
Entry and Exit Points : By highlighting significant support and resistance areas, it assists in determining optimal entry and exit points, particularly in swing trading and mean reversion strategies.
Enhanced Market Insight : The dynamic nature of the indicator, with its shifting anchor points, offers a refined understanding of market sentiment and valuation changes over time.
Why Triple Re-Anchoring VWAP?
Traditional VWAP tools offer a linear view, often missing out on the intricacies of market fluctuations. The Triple Re-Anchoring VWAP addresses this by providing a multi-faceted view of the market, adapting not just to daily price changes but pivoting around significant market events. Whether you're a day trader, swing trader, or long-term investor, this indicator adds depth to your market analysis, enabling more informed trading decisions.
Examples:
MTFT VWAPs Auto AnchoredMulti Time Frame Tools
Multi Time Frame Tools (MTFT) is a suite of scripts aimed to establish a standard timeframe-based color scheme. This can be utilized to overlay different timeframes calculations/values over a single timeframe. As one example, this would allow to observe the 5-month moving average, 5-week moving average, and 5-day moving average overlaid over each other. This would allow to study a chart, get accustomed to the color scheme and study all these at the same time much easier.
All indicators calculated using the below specific timeframes as input, will always use the color scheme outlined below. This is to get you in habit of recognizing the different timeframes overlaid in top of each other. These can be personalized.
Longer TF analysis.
Yearly - Black
Semi-Annual - Yellow
Quarterly - White
Monthly - Maroon
Weekly - Royal Blue
Daily - Lime
Shorter TF analysis.
4 hour - Fuchsia
1 hour - Orange
30 min - Red
15 min - Brown
10 min - Purple
5 min - Lilac
All color coordination is able to be modified in either the “Inputs” or “Style” section. If you need to make changes, make sure to select “Save as Default” on the bottom right of the settings menu.
Recommended Chart Color Layout
I played around with color coordination a lot. The final product was what worked best for me. I personally use the following chart settings to accent all available TF colors.
-> Click on the settings wheel on your chart. -> Click on “Appearance”.
Background - Solid -> On the top row pick the 6th color from the left.
Vert Grid Lines and Horz Grid Lines -> On the top row pick the 7th color from the left.
You may of course change these and the indicator line colors as you like.
Adding indicator to Chart
-> Open the TradingView “Indicators & Strategies” library, the icon has “ƒx”. -> All premium scripts will be located under “Invite-Only Scripts” -> Click indicator to add to your chart.
MTFT VWAPs Auto Anchored
The Anchored Volume-Weighted Average Price, Anchored VWAP, is a commonly discussed FinTwit tool. I personally found it through Brian Shannon on Twitter. I have seen big FinTwit accounts solely focus on this strategy alone and have seen other big FinTwit accounts mix with their other indicators. I will be providing very basic info to utilize this script; it is up to you to dive deep into learning this strategy. I am not an expert with the tool or a financial advisor. As with all aspects of life, I recommend you research, learn, discern and practice extensively in order to become a master.
The script has the following features.
1. Three user selected time frames auto anchored VWAPS. It will auto anchor to the start of the timeframe. Timeframes(TF) include: Yearly(Y), Semi-annually(S), Quarterly(Q), Monthly(M), Weekly(W), Daily(D), and 4 hour. Image below shows the D candlestick as the active timeframe, the anchored VWAPs for the Year, Quarter, and Month.
2. Auto hide lower timeframe calculations. Auto Hide feature will hide smaller TF calculations when a larger timeframe is selected as the display TF. Example, when the Daily timeframe candlestick selected the Weekly and Daily Anchored VWAPs are hidden because they produce very noisy results. If a lower TF is selected such as the 30 min candlestick, the previously hidden Daily and Weekly Open Anchored VWAPs are now displayed. Notice that this specific indicator calculates different with every different timeframe that is selected. The lower TF calculations are more accurate as they include additional information. Image below shows the 30 min timeframe selected with the Daily, Weekly, and Monthly Open Anchored VWAPs displayed.
3. Auto Anchor using Pivot High/Low locations. Script finds the pivot highs/lows with a user selected look back/forward period. Additionally, as new pivot highs/lows appear you can choose to keep up to 4 each previous pivot high/low anchored VWAPs displayed. Image below has a 40 look back/forward period selected, and 2 past AVWAPs enabled.
You may notice in the above image that there is a gap between the AVWAP plot and the marked pivot point. This is not something that can be avoided as the script has to look forward in order to verify the pivot. The calculation is still correct, this can be verified by manually adding an “Anchored VWAP” drawing and seeing the values align. Image below shows that they match. White lines are the manually added “Anchored VWAP” drawings. If you verify this for yourself, make sure to select the correct input source in the settings of the drawing.
4. Auto Anchored on IPO High/Low. Looks for the first available candlestick in a chart and anchors to the high and low. This is useful with newer companies with recent IPOs.
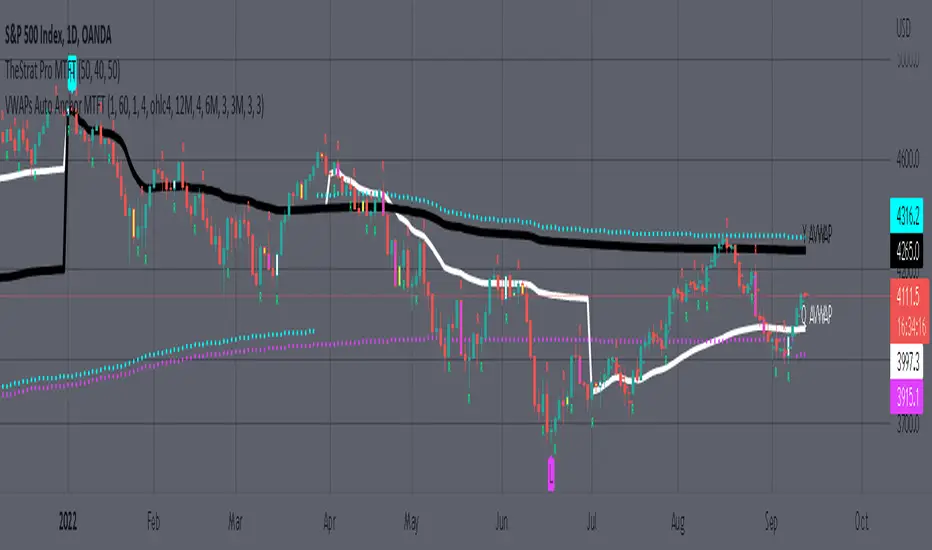
IMPORTANT NOTE to TradingView admin: One of the lessons I would consider most important in attaining clarity regarding trading, is “TheStrat” by Rob Smith. His lesson on “actionable signals” is something that can be applied to any strategy. For this reason, I am including “MTFT TheStrat Patterns Pro” script in all images that will depict confluence for a better trade selection.
Example using TheStrat Pro MTFT with this indicator.
Look for a “TheStrat actionable signal” or a “TheStrat Reversal signal” on a smaller timeframe that has an instance of this indicator on a larger timeframe calculation that is in range of the candlestick that formed your actionable signal. This means that the indicators plot you are observing must be above the low and below the high of the candlestick that is the actionable signal/reversal signal.
The Image below shows what this would look like with this indicator. The selected candlestick is the 2-day, it shows a 1-3-1 pattern and the Quarter Anchored VWAP in range. This actionable signal could be played in both directions. If the high is breached, you would enter a long position from the high of the inside candlestick. If the low is breached than you would enter a short. For targets you would look at the previous pivots, for this example all targets were hit. Note that the “Entry” and “Targets” line were added manually and are not part of the script. Setups won’t always play out so nice and clean, but given that there is so many stocks and so many signals this is just a thought to improve the quality of the signal as it has extra confluence. If you are interested in learning further, research ‘TheStrat’ by Rob Smith.
VWAP+SMA+EMAThis is the only indicator combing the results of VWAP + 2 SMAs + 2 EMAs.
This is a free indicator. Enjoy using it.
Kunal Jain
JMF MTF historical Vwap map and static levels. What is a vwap map?
This is a Multi time frame Historical vwap heatmap. The study plots lines and maps out historical vwap zones based on closing vwap value of the time frame selected and the time frames high range. Show casing high volume concentration areas and low volume area's from each time frame chosen on chart.
Static Vwap Lines can be turned off in settings, as well as the map, you can use each individually or paired together for a more complete overview of the levels. You can also refine the search by using the "Gap %" input. This will filter out and search for average price's that have gapped up or down "X" percent from the previous days average price. Leaving you with Static vwaps and map zones from the most important "Gap Day's". This helps clean up the over all visual, but be careful choosing a higher gap percentage, that you don't lose too much granularity the map offers.
What will a "Static vwap and Map look like"
The look will vary greatly depending on where the stock is in its historical range. If the name is in a consolidation range with a lot of recent average prices directly above and below, you will have a heavy, crowded, Darker/intense heat signature from the map, You will also see levels in map mode over lapping and lines bundled together. These high traffic area's can act as great support or resistance since they are showing a congregation of historical average prices where participants have previously interacted. On the contrary, if you see "open air" in the map, or large areas of blank chart where no heat signature is mapping, this is an area of LOW volume and average prices. Current price will or can move quickly through these areas IF price accepts inside the open air range. If price does NOT accept inside the open air range, Then the blank low volume zone can and will act as support or resistance given the situation.
Capture the gaps.
I look to capture these "Gaps" created by the map and static levels both long or short. I have noticed over time that the higher time frame maps zones are WELL respected intraday, Daily, Weekly, Monthly etc. I look for areas where we are clearing a high volume zone, we break above, hold and accept into open air, and start to move through the open air zones up or down.
I also use the more granular smaller levels as support and resistance intraday while in plays.
Time frames and settings .
User has 3 inputs for seperate time frames to show. You can show a combo of all 3 timeframes, or you can show only a single time frame of your choosing, or two. Mix and match with the string input time frames.
Acceptable inputs are - 5,10,15,30,60,90,240,D,W,M,2D,4W,3M and so on. Any combination of string input timeframe should work, that means numbers (5,10,15,etc) or letters (D,W,M,etc) or combination of the two.
Look and feel
Each time frame has its own color input, transparency input, line style input, and line weight input. User can customize any of the lines or maps to their liking with a wide variety of styles, widths, and colors.
Any or all of the time frames can be enabled or disabled as well, to make the map as busy, or as calm as you would like.
Enjoy !
In the end I encourage any who tries the Heatmap to really sit down and spend some time playing around with the settings in order to find out how they like the map set up. I usually run the default settings on a intraday 5min chart, and then another instance of the study on a 15min chart with W,M,3M. plotted. That way I can see granular intraday levels, and macro long term levels in the same view. See what fit's you the best, and how you like to trade. Most of all ENJOY!
Good luck -
JMF.
IMPORTANT INFO -
As always, the creator of this code is NOT a licensed investment advisor. No output of this tool is to be taken as investment advice or a recommendation to buy or sell any security.
Trading is risky, any one using this tool acknowledges they CAN LOSE some if not all of their initial investment even with this tool enabled.
User assumes ALL RESPONSIBILITY when using this tool in their technical analysis .
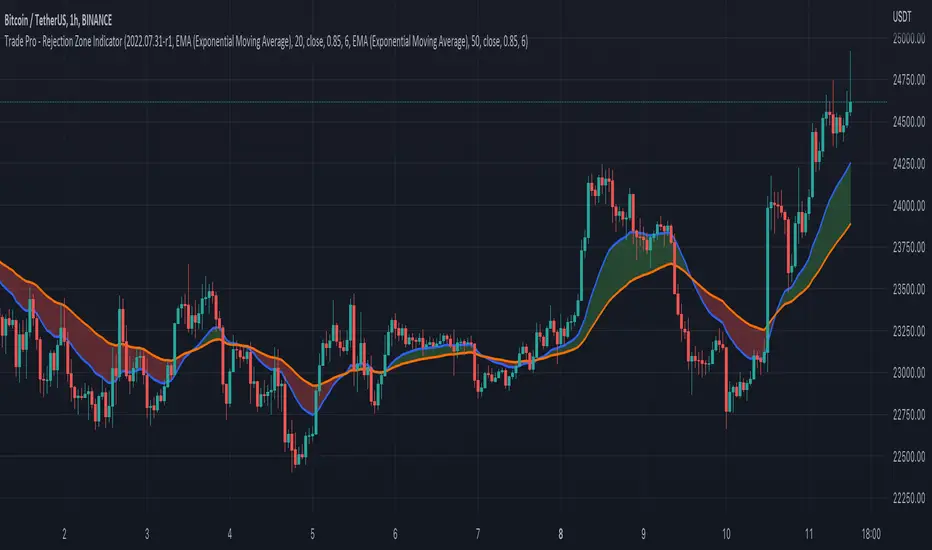
Trade Pro - Rejection Zone IndicatorThe Rejection Zone Indicator can be used to help trend following traders know when to buy dips in up trends, and when to sell pull backs in down trends.
The Rejection Zone Indicator is made up of the 20 and 50 period Exponential Moving Averages. This indicator has colored shading in between these two EMAs, which acts as a nice visual. When the 20 period Exponential Moving Average is below the 50 period Exponential Moving Average, the shaded cloud will be red, and when the 20 EMA is over the 50 EMA the cloud will be green. It is called the Rejection Zone indicator, because often in trends when price pulls back to the colored cloud, it will act as an area of support or resistance.
The suggested use of the Rejection Zone Indicator is to look for long trades when the cloud is green, and once price has pulled back into the green cloud. If the cloud is red one can look for short trading opportunity when price pulls back into the red cloud.
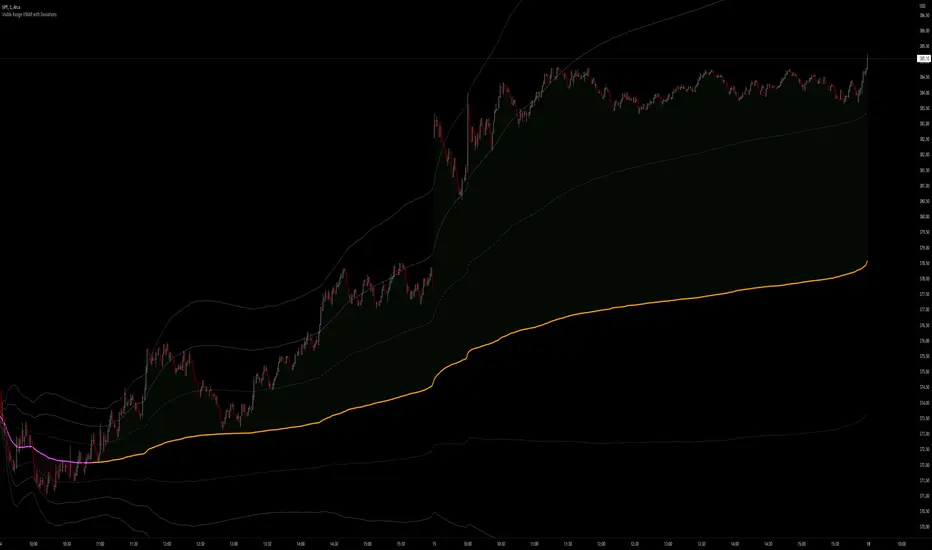
Visible Range VWAP with DeviationsImplementing Pine's new Visible range function I have built with the help of @RumpyPumpyDumpy a Visible range Vwap with Standard deviations in the same style and color way originally created by Zach Hurwitz, This is created in the styling and under the teaching of his education over the last few years. Zach uses intraday, and long term strategy based around 4 trade types that are taken in and around Vwap and its deviation bands. Whether that is intraday vwap , Longer term time based vwaps, Event based vwaps such as earnings , Gaps, Highest Volume based, and now "Visible range" based vwaps. The new visible range function is a huge help and time saver when wanting to quickly see a longer dated vwap or a vwap from a specific spot on your chart. All you have to do is scroll to that position on the chart and the Vwap and bands automatically launches from the furthest most left candle on your chart using the source input user chooses, HLC3, High, Low, etc.
This is a fully functional Volume weighted average price and launches on the furthest most left bar on your chart. It comes set to calculate the average price based off the launch candles HLC3 value, or User can choose to change the source input to High or Low for custom anchored visible range high/low vwap showing overhead resistance or support from underneath.
The deviations can be used as support and resistance intraday or longer time frames. Myself and others in our community have 4 trade type set ups that we take in and around Vwaps deviations. It offers us consistent, and manageable risk points at measured distances away from average price, and specific targets to aim for intraday and in longer time framed swing trades.
Vwap and its deviations are a institutional benchmark and a tool that higher time frame and institutional traders around the world use as a guide. With the use of visible range and multiple launch points on the candle we can quickly get an idea of where participants may be buying and selling, or trapped or supportive of price.
Standard deviation bands and the color-coding reflects the market’s current position and slope. This can now be applied to the visible range of your entire chart, and you can quickly understand whether the market is trending positive, negative, or flat and counter trend.
I have included our traditional color way of Zach's original vwap indicators that were originally released on TOS and now also available on TradingView. This shows a yellow positive sloped vwap , or magenta negative sloped vwap . User also has choice of slope signal which shows positive, negative, neutral, or single color choice.
There is also positive and negative cloud coloring behind price to show when price is above or below visible range vwap . This helps immediately understand whether price is moving in your favor or against. In addition there is the choice of brightly highlighting what we refer to as the "Fast lane", which is a trending market either positive or negative in plus one or negative one deviation. You can use them independently, or choose not to color them at all. There is also Positive and negative coloring options for the Deviation plots themselves, which in positive trend will color the upper deviations green or in negative trend color them red.
User also has the choice to add "Tolerance bands", which are sub deviation levels usually used in 0.25-0.50 increments. These show a zone above and below each deviation of which price may test above or below. We do not think as vwap as a hard "Line in the sand" rather a zone where we look for participation from those that are currently in that average price, this means price sometimes may move slightly under the vwap or deviation level as price seeks liquidity and the Tolerance bands can add some insight in an event like this.
As always-
*** ALL USERS ASSUME ALL RESPONSIBILTIY WHILE USING THIS TOOL. THIS IS NOT, NOR SHOULD NOT BE MISCONSTRUED AS FINANCIAL ADVICE. USER ASSUMES ALL RISKS ASSOCIATED WITH THE USE OF THIS TOOL WHILE TRADING,AND FOR ANY AND ALL LOSS THAT MAY OCCUR WHILE USING SAID TOOL. TRADING IS RISKY AND USER COULD STAND TO LOSE ALL CAPITAL INVESTED.
Hope you enjoy.
Thanks
-JMF
BankNifty VWAP VWAP - Volume-Weighted Average price ( VWAP )
The script draws Daily VWAP for BANKNIFTY SPOT , based on Futures Volume or underlying Index Stocks based on user input
BANKNIFTY INDICES IS THE WEIGHTAGE OF 12 STOCKS AS DECIDED BY EXCHANGE.
BANKNIFTY VWAP CALCULATES THE COMBINED VWAP OF THESE 12 STOCKS AND GENERATES VWAP FOR BANKNIFTY
It works with NIFTY as well. Please change the Symbol and Futures Volume symbol to "NSE:NIFTY" and "NSE:NIFTY1!"
NIFTY INDICES IS THE WEIGHTAGE OF 50 STOCKS AS DECIDED BY EXCHANGE.
NIFTY VWAP CALCULATES THE COMBINED VWAP OF THESE 50 STOCKS AND GENERATES VWAP FOR NIFTY
This script is intended for educational purposes only.
03/07/2022 WEIGHT AGE OF INDEX STOCKS (%)
HDFC Bank Ltd. - 27.63
ICICI Bank Ltd. - 22.98
Kotak Mahindra Bank Ltd. - 11.40
State Bank of India - 11.73
Axis Bank Ltd. - 11.6
IndusInd Bank Ltd. - 5.03
AU Small Finance Bank - Ltd. 2.54
Bandhan Bank Ltd. - 1.98
Bank of Baroda - 1.76
Federal Bank Ltd.- 1.76
PNB - 0.84
IDFC First Bank - 0.95

VWAP Suite█ OVERVIEW
This indicator is an attempt to bring all VWAP functionalities under one umbrella suite, the existing VWAPs are great and this was made to provide all functionalities. (pending more updates as well)
█ FEATURES
Multiple VWAPs MTF
Individual Band configuration
Previous vwap closes
Date tracking of previous closes
MTF Options
Enabling the other VWAPS with any timeframe will allow the user to use the "VWAP Anchor" setting to choose what HTF Vwap to be displayed
"Prev Close"
This setting enables all historical closes to be displayed with extension
"Track Dates"
Can be used to keep date information of 2 previous closes and further back
█ HOW TO USE IT
The indicator is quite straight forward in its application, as you would expect of a normal VWAP.
At the top of the settings pane the indicator has some functionality that would control the VWAPs globally, e.g. disabling show bands disables all bands for all the VWAPs.
Each VWAP has individual settings that can be controlled such as coloring, which bands enabled, previous closes, labelling...
█ SUGGESTION
My suggestion for clarity is to use 1 VWAP with bands, and a 2nd with no bands + Previous close enabled at a higher timeframe
█ LIMITATIONS OF PINE (Please read)
I see many users going on different indicators with MTF in mind and trying to use it for LTF data e.g. 1hour chart, and selecting 5min in chart settings.
This is not recommended by the team themselves and should be noted for use always use HTF: www.tradingview.com
To understand how to use VWAP please refer to some education that can be found for free online
Heres an example of a trader using the tool himself: www.youtube.com
█ Future Updates:
Previous Close Line extensions
Previous Highs and Lows of VWAP mapped out for users
Suggestions Welcome!
Anchored Volume Profile by DGTAnchored Volume Profile aims to display trading activity at specific price levels over specified anchored periods of trading, where anchor period can be set to auto or users can specify anchor periods of their interest (Day (Session), Week, Quarter or Year)
Anchored Volume Profile is plotted as two horizontal histograms on the finacial isntrumnet's chart that highlights the trader's common interest at specific price levels as well as aims to reveal dominant party, bulls or bears
You are invited to glance at Vol Profile and Price Action-Support-Resistance studies
Disclaimer: Trading success is all about following your trading strategy and the indicators should fit within your trading strategy, and not to be traded upon solely
The script is for informational and educational purposes only. Use of the script does not constitutes professional and/or financial advice. You alone the sole responsibility of evaluating the script output and risks associated with the use of the script. In exchange for using the script, you agree not to hold dgtrd TradingView user liable for any possible claim for damages arising from any decision you make based on use of the script

Haye VWAPThis is VWAP but instead of average price resetting daily, you choose the VWAP reset period.
You could choose an Hourly VWAP, or a 2D VWAP, the choice is yours.
To show the functionality compared to normal VWAP, the below shows Haye VWAP (White) and normal VWAP (red), both set to Daily timeframes and on a Daily Chart.
As you can see, they're identical.
Then the following shows a 15min chart, with VWAP set to 15min timeframe and Haye VWAP set to Daily.
Again, notice they're identical because even when you change the timeframe of the regular VWAP, it still "resets" the average price calculation Daily.
Finally you can see what happens when we change the Haye VWAP period, the average price calculation resets based on the period you choose.
In this case Haye VWAP and regular VWAP are both set to 240 (4Hour) on a 5min chart.
The regular VWAP is displaying the 4Hour data of the VWAP (which resets Daily).
The Haye VWAP (in White) is displaying the Volume Weighted Average Price of the 5min bars, resetting every 4Hours.
This allows us to use the principles of VWAP but apply it to shorter (or longer) timeframes. For example, you could have a VWAP that resets hourly, or a longer VWAP that resets every 2Days.

MovingAveragesLibrary "MovingAverages"
Contains utilities for generating moving average values including getting a moving average by name and a function for generating a Volume-Adjusted WMA.
vawma(len, src, volumeDefault) VAWMA = VWMA and WMA combined. Simply put, this attempts to determine the average price per share over time weighted heavier for recent values. Uses a triangular algorithm to taper off values in the past (same as WMA does).
Parameters:
len : The number of bars to measure with.
src : The series to measure from. Default is 'hlc3'.
volumeDefault : The default value to use when a chart has no (N/A) volume.
Returns: The volume adjusted triangular weighted moving average of the series.
getMA(mode, len, src) Generates a moving average based upon a 'mode'.
Parameters:
mode : The type of moving average to generate. Values allowed are: SMA, EMA, WMA, VWMA and VAWMA.
len : The number of bars to measure with.
src : The series to measure from. Default is 'close'.
Returns: The volume adjusted triangular weighted moving average of the series.