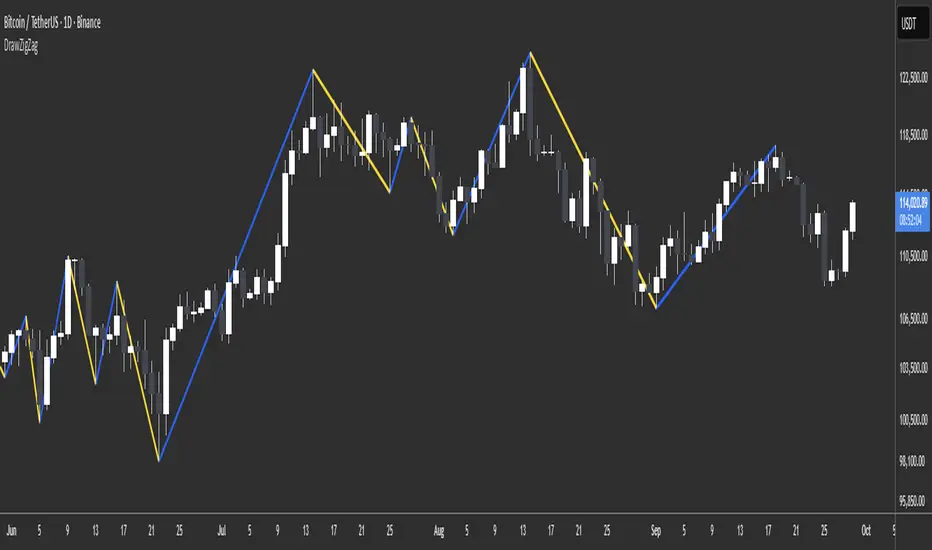
Zigzag Simple [SCL]🟩 OVERVIEW
Draws zigzag lines from pivot Highs to pivot Lows. You can choose between three different ways of calculating pivots:
• True Highs and Lows
• Williams pivots
• Oscillator pivots
🟩 HOW TO USE
This indicator can be used to understand market structure, which is arguably the primary thing you need to be aware of when trading. The zigzag by itself does not display a market structure bias, nor any information about prices of pivots, HH and HL labels, or anything like that. Nevertheless, a simple zigzag is perhaps the easiest and most intuitive way to understand what price is doing.
Choose a pivot style that you like, customise the colours and line style, and enjoy!
🟩 PIVOT TYPES EXPLAINED
True Highs and Lows
This is not an invention of mine (all credit to my humble mentor), but I haven't seen anyone else code them up. A true High is a close below the low of the candle with the highest high. A true Low is a close above the high of a candle with the lowest low. These are solid, price action-based pivots that can sometimes confirm quickly.
Williams pivots
This is how most people calculate pivots. They're simply the highest high for x bars back and x bars forwards. They're the vanilla of pivots IMO: serviceable but not very interesting. They're very convenient to code because there are built-in Pine functions for them: ta.pivothigh and ta.pivotlow . They confirm a predictable number of bars after they happen, which is great for coding but also makes the trader wait for confirmation.
Oscillator pivots
This is a completely different concept, which uses momentum in order to define pivots. For example, when you get a rise in momentum and momentum then drops a configurable amount, it confirms a pivot high, and vice versa for a pivot low. I don't know if anyone else does it –- although some indicators do mark pivots in momentum itself, and plenty do divergences, I wasn't able to find one that specifically marked *pivots in price* because of pivots in momentum 🤷♂️
Anyway, while this approach needs a whole investigation on its own, here we simply plot some pivots in a smoothed RSI. This indicator doesn't plot the actual momentum values -- for a more visual understanding of how this works, refer to the examples in the OscillatorPivots library.
🟩 UNIQUE ADVANTAGES
In contrast to other zigzag indicators available, this one lets you choose between the standard and some more unique methods of generating the zigzags. Additionally, because it's based on libraries, it is relatively easy for programmers to use as a basis for experimentation.
🟩 GEEK STUFF
Although there is considerable practical use for pivot-based zigzags in trading, this script is primarily a demonstration in coding -- specifically the power of libraries!
Most of the script consists of setup, especially defining inputs. The final section sacrifices some readability for conciseness, simply to emphasise how little code you need when the heavy lifting is done by libraries .
The actual calculations and drawing are achieved in just 8 lines.
The equivalent code in the libraries is ~250 lines long.
All libraries used are my own, public and open-source:
• MarketStructure
• DrawZigZag
• OscillatorPivots
Волновой анализ

Real-Time Spring DetectorThis is a Pine Script for Trading View that creates a "Real-Time Spring Detector" indicator. This Pine Script is essentially a sophisticated pattern recognition tool that helps identify "spring" setups - a popular trading pattern where price briefly breaks below support but then bounces back strongly, often indicating that sellers are exhausted and buyers are ready to step in.What is a "Spring" in Trading?
A spring is a technical analysis pattern that occurs when:
Price breaks below a support level (like breaking below a floor)
But then quickly bounces back up (like a spring rebounds)
This often signals that sellers are weak and buyers are stepping in
Think of it like testing the strength of a trampoline - you push down, but it springs back up stronger.
What This Script Does
This Pine Script automatically detects spring patterns on your chart and alerts you when they happen. Here's how it works:
Main Components
1. Input Parameters (Settings You Can Adjust)
Lookback Period (10): How many bars back to look for patterns
Min Support Touches (2): How many times price must touch the support level
Min Penetration % (0.1%): How far below support price must break
Min Rejection % (30%): How much price must bounce back up
Alert Settings: Choose when to get notifications
2. Support Level Detection
The script finds "support levels" - price levels where buyers have stepped in before:
It looks at recent low points
Identifies areas where price has bounced multiple times
Uses a small tolerance (0.5%) to account for minor price differences
3. Spring Detection Logic
The script identifies three types of springs:
Real-Time Spring (happening right now):
Price breaks below support by the minimum amount
Price bounces back strongly (rejection %)
Current candle closes higher than it opened (bullish)
Volume is reasonable
Confirmed Spring (already completed):
Same as real-time, but the candle has finished forming
Potential Spring (early warning):
Price is near support but hasn't fully formed the pattern yet
4. Visual Elements
Markers on Chart:
🟢 Green Triangle: Confirmed spring (reliable signal)
🟡 Yellow Triangle: Spring forming right now (live signal)
🟠 Orange Circle: Potential spring (early warning)
Labels:
Show "SPRING" with the rejection percentage
"FORMING" for developing patterns
"?" for potential springs
Support Line:
Red dotted line showing the support level
Background Colors:
Light red when price penetrates support
Light yellow for potential springs
5. Information Box
A table in the top-left corner shows:
Current support level price
Whether penetration is happening
Rejection percentage
Current pattern status
Live price
6. Alert System
Two types of alerts:
Real-time alerts: Notify when spring is forming (current bar)
Confirmed alerts: Notify when spring is complete (bar closed)
Alert cooldown: Prevents spam by waiting 5 bars between alerts
How to Use This Script
1. Installation
Copy the script code
Open TradingView
Go to Pine Editor
Paste the code
Click "Add to Chart"
2. Settings
Adjust the input parameters based on your trading style:
Lower lookback = more sensitive, faster signals
Higher support touches = more reliable but fewer signals
Lower penetration % = catches smaller springs
Higher rejection % = only strong bounces
3. Interpretation
Green triangles: High-confidence buy signals
Yellow triangles: Watch closely, pattern developing
Orange circles: Early warning, not tradeable yet
4. Best Practices
Use on higher timeframes (15min+) for more reliable signals
Combine with other indicators for confirmation
Pay attention to volume - higher volume springs are more reliable
Wait for confirmed signals if you're a conservative trader
Key Features for Small Timeframes
The script includes special detection for shorter timeframes:
Quick bounce detection: Identifies rapid reversals
Hammer pattern recognition: Spots candlestick patterns
Relaxed volume requirements: Works when volume data is limited
Advanced Features
Volume Analysis
Compares current volume to 10-bar average
Requires at least 80% of average volume (flexible for small timeframes)
Pattern Enhancement
Looks for hammer-like candles (long lower wick, small upper wick)
Identifies quick bounces where the upper wick is small
Multiple Confirmation
Combines multiple criteria to reduce false signals
Stronger springs get priority for alerts
Common Use Cases
Entry Signals: Buy when confirmed springs appear
Support Level Identification: Visual support lines help identify key levels
Risk Management: Failed springs (continued breakdown) can be stop-loss triggers
Market Structure: Understanding where buyers are defending price levels
Limitations
Works best in trending or ranging markets May produce false signals in very choppy conditions
small timeframe signals can be noisy should be combined with other analysis methods.The key advantage is that it can catch these patterns as they happen, rather than you having to constantly watch charts. This is especially valuable for active traders who want to capitalize on quick reversals at support levels.

Multi-Timeframe Wolfe Wave StrategyThis invite-only strategy implements an advanced multi-timeframe Wolfe Wave pattern recognition system specifically designed for institutional-grade algorithmic trading environments.
**Core Mathematical Framework:**
The strategy employs sophisticated mathematical calculations across 10 distinct timeframes (377, 233, 144, 89, 55, 34, 21, 13, 8, 5 periods), utilizing Elliott Wave ratio theory combined with proprietary algorithmic enhancements. Unlike standard Wolfe Wave implementations that rely on visual pattern recognition, this system uses quantitative analysis to identify precise entry and exit points.
**Technical Implementation:**
• **Pattern Detection Algorithm:** Calculates price relationships using configurable ratio sets including Fibonacci sequences, Elliott Wave ratios, Golden Ratio, Harmonic Patterns, Pi-based calculations, and custom mathematical progressions
• **Multi-Timeframe Confluence:** Simultaneously analyzes patterns across all timeframes to ensure signal reliability and reduce false positives
• **Dynamic Target Calculation:** Employs advanced mathematical modeling to project optimal profit targets based on historical price behavior and pattern completion theory
• **Risk Management Engine:** Implements position-based stop losses calculated as percentages of target profits, with liquidation price monitoring for leveraged positions
**Originality and Innovation:**
This implementation differs significantly from traditional Wolfe Wave indicators through several key innovations:
1. **Algorithmic Pattern Validation:** Uses mathematical confirmation across multiple timeframes rather than subjective visual analysis
2. **Adaptive Ratio Selection:** Offers 24 different ratio calculation methods, allowing optimization for various market conditions
3. **Institutional Integration:** Features comprehensive webhook messaging for automated execution via external trading systems
4. **Advanced Position Management:** Includes sophisticated position sizing controls with maximum concurrent position limits
**Strategy Logic:**
For bullish conditions, the algorithm identifies when price action meets specific mathematical criteria:
- Point validation through ratio analysis between swing highs/lows
- Confluence confirmation across multiple timeframes
- Minimum profit threshold filtering to ensure trade quality
- Dynamic stop-loss positioning based on pattern geometry
The mathematical approach uses proprietary calculations that extend beyond traditional Fibonacci levels, incorporating elements from chaos theory, fractal geometry, and advanced statistical analysis.
**Risk Management Features:**
• Configurable stop-loss percentages relative to profit targets
• Maximum position limits to control portfolio exposure
• Liquidation price monitoring for margin trading
• Time-based filtering options for market session control
• Minimum profit threshold settings to filter low-quality signals
**Intended Markets and Conditions:**
Optimized for cryptocurrency markets with high volatility and sufficient liquidity. Works effectively in trending and ranging market conditions due to its multi-timeframe approach. Best suited for assets with clear swing structure and adequate price movement.
**Performance Characteristics:**
The strategy is designed for active trading with frequent position entries across multiple timeframes. Position holding periods vary from short-term scalping to medium-term swing trading depending on pattern completion timeframes.
**Technical Requirements:**
Requires understanding of advanced pattern recognition theory, risk management principles, and algorithmic trading concepts. Users should be familiar with Wolfe Wave methodology and Elliott Wave theory fundamentals.

ALEX - ATR Extensions + ADR + TableALEX - ATR Extensions + ADR + Table
Overview
The ALEX ATR Extensions indicator is a comprehensive volatility and momentum analysis tool that combines Average True Range (ATR), Average Daily Range (ADR), and moving average distance calculations in a single, customizable display. This indicator helps traders assess current price action relative to historical volatility and key moving averages, providing crucial context for risk management and trade planning.
Key Features
Multi-Metric Analysis
- ATR Percentage: Current ATR as a percentage of price for volatility assessment
- ADR Percentage: Average Daily Range as a percentage for typical daily movement
- Low of Day Distance: Distance from current price to daily low
- Moving Average Distance: ATR-normalized distance from 21 and 50 period moving averages
Flexible Moving Average Options
- Configurable MA Types: Choose between EMA or SMA for both 21 and 50 period averages
- Customizable Periods: Adjust moving average lengths to suit your trading style
- Daily Timeframe Data: Uses daily moving averages regardless of chart timeframe
ATR Extension Levels
- Dynamic Price Targets: Calculate extension levels based on ATR multiples from moving averages
- Visual Reference Lines: Optional overlay lines showing ATR extension targets
- Customizable Multipliers: Adjust ATR multipliers for different risk/reward scenarios
Smart Visual Alerts
- Color-Coded Distance Metrics: Automatic color changes based on distance thresholds
- Symbol Plotting: Customizable chart symbols when distance thresholds are exceeded
- Threshold-Based Alerts: Visual cues when price reaches significant ATR distances
Comprehensive Data Table
- Real-Time Metrics: Live updating table with all key measurements
- Customizable Display: Toggle individual metrics on/off based on preference
- Professional Styling: Adjustable colors, fonts, and transparency
How to Use
Volatility Assessment
- High ATR%: Indicates elevated volatility, larger position sizing considerations
- Low ATR%: Suggests compressed volatility, potential for expansion
- ADR% Comparison: Compare current day's range to historical average
Moving Average Analysis
- ATR Distance 21/50: Normalized distance showing how extended price is from key levels
- Positive Values: Price above moving average (bullish positioning)
- Negative Values: Price below moving average (bearish positioning)
- Color Changes: Automatic alerts when reaching threshold levels
Extension Target Planning
- ATR Extension Lines: Visual price targets based on volatility-adjusted projections
- Risk/Reward Planning: Use extension levels for profit target placement
- Breakout Confirmation: Extension levels can confirm breakout validity
Symbol Alert System
- Chart Symbols: Automatic plotting when distance thresholds are breached
- Customizable Triggers: Set your own threshold levels for alerts
- Visual Scanning: Quick identification of extended conditions across multiple charts
Settings
Display Controls
- Show ADR%: Toggle average daily range percentage display
- Show ATR%: Toggle average true range percentage display
- Show LoD Distance: Toggle low of day distance calculation
- Show LoD Price: Toggle actual low of day price display
- Show ATR Distance from 21/50 DMA: Toggle moving average distance metrics
- Show 21/50 DMA Price: Toggle actual moving average price display
- Show ATR Extension Levels: Toggle extension target display in table
Moving Average Configuration
- 21/50 DMA Type: Choose between EMA or SMA calculation methods
- 21/50 DMA Period: Customize moving average lengths
- ADR/ATR Length: Adjust calculation periods for range measurements
Color Thresholds
- Threshold Levels: Set distance levels for color changes (default 2.0 and 5.0)
- Custom Colors: Choose colors for different threshold breaches
- Separate 21/50 Settings: Independent color schemes for each moving average
Symbol Settings
- Show Char Symbol: Toggle symbol plotting for each moving average
- Custom Symbols: Choose any character for chart plotting
- Symbol Colors: Customize colors for visual distinction
- Threshold Levels: Set trigger points for symbol appearance
ATR Extension Lines
- Show Extension Lines: Toggle visual extension level lines
- ATR Multipliers: Customize extension distance (default 2.0x)
- Line Colors: Choose colors for extension level visualization
Table Customization
- Background Color: Adjust table transparency and color
- Text Color: Customize default text appearance
- Font Size: Choose from tiny to huge font options
Advanced Applications
Trend Strength Analysis
- Large ATR distances suggest strong trending moves
- Small ATR distances indicate potential consolidation or reversal zones
- Compare current readings to recent historical ranges
Risk Management
- Use ATR% for position sizing calculations
- Extension levels provide natural profit target zones
- Distance metrics help identify overextended conditions
Multi-Timeframe Context
- Apply to different timeframes for comprehensive analysis
- Daily data provides consistency across all chart intervals
- Combine with weekly/monthly analysis for broader context
Market Regime Identification
- High volatility periods: Increased ATR% readings
- Low volatility periods: Compressed ATR% readings
- Trending markets: Sustained high distance readings
- Consolidating markets: Low distance readings with frequent color changes
Best Practices
Volatility-Adjusted Trading
- Increase position sizes during low volatility periods
- Reduce position sizes during high volatility periods
- Use ATR% for stop-loss placement relative to normal market movement
Extension Level Usage
- Primary targets: 1.5-2.0x ATR extensions
- Secondary targets: 2.5-3.0x ATR extensions
- Avoid chasing prices beyond 3x ATR extensions
Threshold Optimization
- Backtest different threshold levels for your trading style
- Consider market conditions when setting alert levels
- Adjust thresholds based on instrument volatility characteristics
Integration Strategies
- Combine with momentum indicators for confirmation
- Use alongside support/resistance levels
- Incorporate into systematic trading approaches
Technical Specifications
- Compatible with Pine Script v6
- Uses daily timeframe data for consistency
- Optimized for real-time performance
- Works on all chart types and timeframes
- Supports all tradeable instruments
Ideal For
- Swing traders using daily charts
- Position traders seeking volatility context
- Day traders needing intraday reference levels
- Risk managers requiring volatility metrics
- Systematic traders building rule-based strategies
Disclaimer
This indicator is for educational and informational purposes only. It should not be used as the sole basis for trading decisions. Always combine with other forms of analysis, proper risk management techniques, and consider your individual trading plan and risk tolerance. Past performance does not guarantee future results.
Compatible with Pine Script v6 | Optimized for daily timeframe analysis | Works across all markets and instruments

DrawZigZag🟩 OVERVIEW
This library draws zigzag lines for existing pivots. It is designed to be simple to use. If your script creates pivots and you want to join them up while handling edge cases, this library does that quickly and efficiently. If you want your pivots created for you, choose one of the many other zigzag libraries that do that.
🟩 HOW TO USE
Pine Script libraries contain reusable code for importing into indicators. You do not need to copy any code out of here. Just import the library and call the function you want.
For example, for version 1 of this library, import it like this:
import SimpleCryptoLife/DrawZigZag/1
See the EXAMPLE USAGE sections within the library for examples of calling the functions.
For more information on libraries and incorporating them into your scripts, see the Libraries section of the Pine Script User Manual.
🟩 WHAT IT DOES
I looked at every zigzag library on TradingView, after finishing this one. They all seemed to fall into two groups in terms of functionality:
• Create the pivots themselves, using a combination of Williams-style pivots and sometimes price distance.
• Require an array of pivot information, often in a format that uses user-defined types.
My library takes a completely different approach.
Firstly, it only does the drawing. It doesn't calculate the pivots for you. This isn't laziness. There are so many ways to define pivots and that should be up to you. If you've followed my work on market structure you know what I think of Williams pivots.
Secondly, when you pass information about your pivots to the library function, you only need the minimum of pivot information -- whether it's a High or Low pivot, the price, and the bar index. Pass these as normal variables -- bools, ints, and floats -- on the fly as your pivots confirm. It is completely agnostic as to how you derive your pivots. If they are confirmed an arbitrary number of bars after they happen, that's fine.
So why even bother using it if all it does it draw some lines?
Turns out there is quite some logic needed in order to connect highs and lows in the right way, and to handle edge cases. This is the kind of thing one can happily outsource.
🟩 THE RULES
• Zigs and zags must alternate between Highs and Lows. We never connect a High to a High or a Low to a Low.
• If a candle has both a High and Low pivot confirmed on it, the first line is drawn to the end of the candle that is the opposite to the previous pivot. Then the next line goes vertically through the candle to the other end, and then after that continues normally.
• If we draw a line up from a Low to a High pivot, and another High pivot comes in higher, we *extend* the line up, and the same for lines down. Yes this is a form of repainting. It is in my opinion the only way to end up with a correct structure.
• We ignore lower highs on the way up and higher lows on the way down.
🟩 WHAT'S COOL ABOUT THIS LIBRARY
• It's simple and lightweight: no exported user-defined types, no helper methods, no matrices.
• It's really fast. In my profiling it runs at about ~50ms, and changing the options (e.g., trimming the array) doesn't make very much difference.
• You only need to call one function, which does all the calculations and draws all lines.
• There are two variations of this function though -- one simple function that just draws lines, and one slightly more advanced method that modifies an array containing the lines. If you don't know which one you want, use the simpler one.
🟩 GEEK STUFF
• There are no dependencies on other libraries.
• I tried to make the logic as clear as I could and comment it appropriately.
• In the `f_drawZigZags` function, the line variable is declared using the `var` keyword *inside* the function, for simplicity. For this reason, it persists between function calls *only* if the function is called from the global scope or a local if block. In general, if a function is called from inside a loop , or multiple times from different contexts, persistent variables inside that function are re-initialised on each call. In this case, this re-initialisation would mean that the function loses track of the previous line, resulting in incorrect drawings. This is why you cannot call the `f_drawZigZags` function from a loop (not that there's any reason to). The `m_drawZigZagsArray` does not use any internal `var` variables.
• The function itself takes a Boolean parameter `_showZigZag`, which turns the drawings on and off, so there is no need to call the function conditionally. In the examples, we do call the functions from an if block, purely as an illustration of how to increase performance by restricting the amount of code that needs to be run.
🟩 BRING ON THE FUNCTIONS
f_drawZigZags(_showZigZag, _isHighPivot, _isLowPivot, _highPivotPrice, _lowPivotPrice, _pivotIndex, _zigzagWidth, _lineStyle, _upZigColour, _downZagColour)
This function creates or extends the latest zigzag line. Takes real-time information about pivots and draws lines. It does not calculate the pivots. It must be called once per script and cannot be called from a loop.
Parameters:
_showZigZag (bool) : Whether to show the zigzag lines.
_isHighPivot (bool) : Whether the current bar confirms a high pivot. Note that pivots are confirmed after the bar in which they occur.
_isLowPivot (bool) : Whether the current bar confirms a low pivot.
_highPivotPrice (float) : The price of the high pivot that was confirmed this bar. It is NOT the high price of the current bar.
_lowPivotPrice (float) : The price of the low pivot that was confirmed this bar. It is NOT the low price of the current bar.
_pivotIndex (int) : The bar index of the pivot that was confirmed this bar. This is not an offset. It's the `bar_index` value of the pivot.
_zigzagWidth (int) : The width of the zigzag lines.
_lineStyle (string) : The style of the zigzag lines.
_upZigColour (color) : The colour of the up zigzag lines.
_downZagColour (color) : The colour of the down zigzag lines.
Returns: The function has no explicit returns. As a side effect, it draws or updates zigzag lines.
method m_drawZigZagsArray(_a_zigZagLines, _showZigZag, _isHighPivot, _isLowPivot, _highPivotPrice, _lowPivotPrice, _pivotIndex, _zigzagWidth, _lineStyle, _upZigColour, _downZagColour, _trimArray)
Namespace types: array
Parameters:
_a_zigZagLines (array)
_showZigZag (bool) : Whether to show the zigzag lines.
_isHighPivot (bool) : Whether the current bar confirms a high pivot. Note that pivots are usually confirmed after the bar in which they occur.
_isLowPivot (bool) : Whether the current bar confirms a low pivot.
_highPivotPrice (float) : The price of the high pivot that was confirmed this bar. It is NOT the high price of the current bar.
_lowPivotPrice (float) : The price of the low pivot that was confirmed this bar. It is NOT the low price of the current bar.
_pivotIndex (int) : The bar index of the pivot that was confirmed this bar. This is not an offset. It's the `bar_index` value of the pivot.
_zigzagWidth (int) : The width of the zigzag lines.
_lineStyle (string) : The style of the zigzag lines.
_upZigColour (color) : The colour of the up zigzag lines.
_downZagColour (color) : The colour of the down zigzag lines.
_trimArray (bool) : If true, the array of lines is kept to a maximum size of two lines (the line elements are not deleted). If false (the default), the array is kept to a maximum of 500 lines (the maximum number of line objects a single Pine script can display).
Returns: This function has no explicit returns but it modifies a global array of zigzag lines.
Wavelet Filter with Adaptive Upsampling [BackQuant]Wavelet Filter with Adaptive Upsampling
The Wavelet Filter with Adaptive Upsampling is an advanced filtering and signal reconstruction tool designed to enhance the analysis of financial time series data. It combines wavelet transforms with adaptive upsampling techniques to filter and reconstruct price data, making it ideal for capturing subtle market movements and enhancing trend detection. This system uses high-pass and low-pass filters to decompose the price series into different frequency components, applying adaptive thresholding to eliminate noise and preserve relevant signal information.
Shout out to Loxx for the Least Squares fitting of trigonometric series and Quinn and Fernandes algorithm for finding frequency
www.tradingview.com
Key Features
1. Frequency Decomposition with High-Pass and Low-Pass Filters:
The indicator decomposes the input time series using high-pass and low-pass filters to separate the high-frequency (detail) and low-frequency (trend) components of the data. This decomposition allows for a more accurate analysis of underlying trends, while mitigating the impact of noise.
2. Soft Thresholding for Noise Reduction:
A soft thresholding function is applied to the high-frequency component, allowing for the reduction of noise while retaining significant market signals. This function adjusts the coefficients of the high-frequency data, removing small fluctuations and leaving only the essential price movements.
3. Adaptive Upsampling Process:
The upsampling process in this script can be customized using different methods: sinusoidal upsampling, advanced upsampling, and simple upsampling. Each method serves a unique purpose:
Sinusoidal Upsample uses a sine wave to interpolate between data points, providing a smooth transition.
Advanced Upsample utilizes a Quinn-Fernandes algorithm to estimate frequency and apply more sophisticated interpolation techniques, adapting to the market’s cyclical behavior.
Simple Upsample linearly interpolates between data points, providing a basic upsampling technique for less complex analysis.
4. Reconstruction of Filtered Signal:
The indicator reconstructs the filtered signal by summing the high and low-frequency components after upsampling. This allows for a detailed yet smooth representation of the original time series, which can be used for analyzing underlying trends in the market.
5. Visualization of Reconstructed Data:
The reconstructed series is plotted, showing how the upsampling and filtering process enhances the clarity of the price movements. Additionally, the script provides the option to visualize the log returns of the reconstructed series as a histogram, with positive returns shown in green and negative returns in red.
6. Cumulative Series and Trend Detection:
A cumulative series is plotted to visualize the compounded effect of the filtered and reconstructed data. This feature helps traders track the overall performance of the asset over time, identifying whether the asset is following a sustained upward or downward trend.
7. Adaptive Thresholding and Noise Estimation:
The system estimates the noise level in the high-frequency component and applies an adaptive thresholding process based on the standard deviation of the downsampled data. This ensures that only significant price movements are retained, further refining the trend analysis.
8. Customizable Parameters for Flexibility:
Users can customize the following parameters to adjust the behavior of the indicator:
Frequency and Phase Shift: Control the periodicity of the wavelet transformation and the phase of the upsampling function.
Upsample Factor: Adjust the level of interpolation applied during the upsampling process.
Smoothing Period: Determine the length of time used to smooth the signal, helping to filter out short-term fluctuations.
References
Enhancing Cross-Sectional Currency Strategies with Context-Aware Learning to Rank
arxiv.org
Daubechies Wavelet - Wikipedia
en.wikipedia.org
Quinn Fernandes Fourier Transform of Filtered Price by Loxx
Note on Usage for Mean-Reversion Strategy
This indicator is primarily designed for trend-following strategies. However, by taking the inverse of the signals, it can be adapted for mean-reversion strategies. This involves buying underperforming assets and selling outperforming ones. Caution: This method may not work effectively with highly correlated assets, as the price movements between correlated assets tend to mirror each other, limiting the effectiveness of mean-reversion strategies.
Final Thoughts
The Wavelet Filter with Adaptive Upsampling is a powerful tool for traders seeking to improve their understanding of market trends and noise. By using advanced wavelet decomposition and adaptive upsampling, this system offers a clearer, more refined picture of price movements, enhancing trend-following strategies. It’s particularly useful for detecting subtle shifts in market momentum and reconstructing price data in a way that removes noise, providing more accurate insights into market conditions.

NY ORB + Fakeout Detector🗽 NY ORB + Fakeout Detector
This indicator automatically plots the New York Opening Range (ORB) based on the first 15 minutes of the NY session (15:30–15:45 CEST / 13:30–13:45 UTC) and detects potential fakeouts (false breakouts).
🔍 Key Features:
✅ Plots ORB high and low based on the 15-minute NY open range
✅ Automatically detects fake breakouts (price wicks beyond the box but closes back inside)
✅ Visual markers:
🔺 "Fake ↑" if a fake breakout occurs above the range
🔻 "Fake ↓" if a fake breakout occurs below the range
✅ Gray background highlights the ORB session window
✅ Designed for scalping and short-term breakout strategies
🧠 Best For:
Intraday traders looking for NY volatility setups
Scalpers using ORB-based entries
Traders seeking early-session fakeout traps to avoid false signals
Those combining with EMA 12/21, volume, or other confluence tools

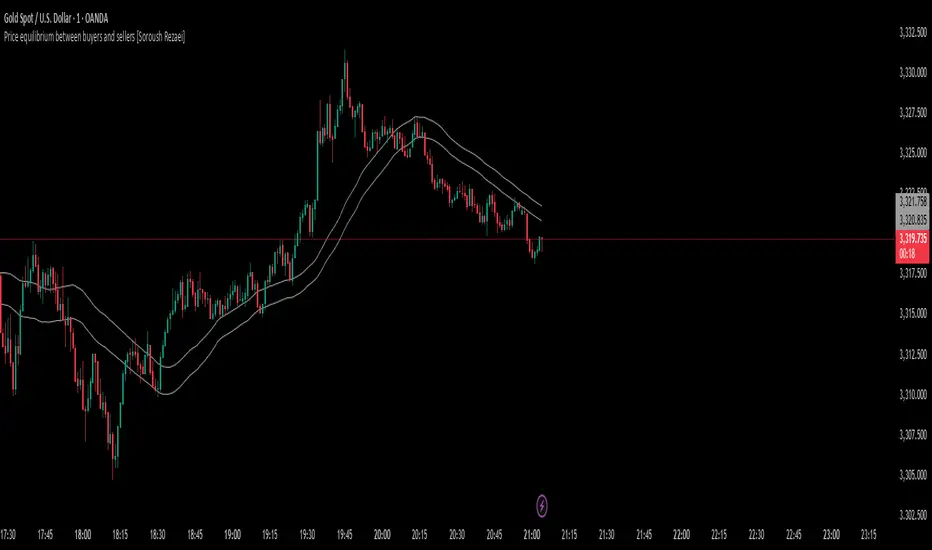
Price equilibrium between buyers and sellers [Soroush Rezaei]This indicator visualizes the dynamic balance between buyers and sellers using two simple moving averages (SMAs) based on the high and low prices.
The green line (SMA of highs) reflects the upper pressure zone, while the red line (SMA of lows) represents the lower support zone.
When price hovers between these two levels, it often signals a state of temporary equilibrium — a consolidation zone where buyers and sellers are relatively balanced.
Use this tool to:
Identify ranging or balanced market phases
Spot potential breakout or reversal zones
Enhance your multi-timeframe or price action strategy
Recommended for intraday and swing traders seeking visual clarity on market structure and momentum zones.
FSVZO | QuantumResearch🔊 FSVZO | QuantumResearch
Fourier Smoothed Volume Zone Oscillator
A proprietary hybrid oscillator blending momentum and frequency domain analysis
🧠 What Makes It Unique?
FSVZO introduces a novel approach to the classic Volume Zone Oscillator (VZO) by incorporating Discrete Fourier Transform (DFT) into both price and volume streams before calculating the VZO. This technique extracts the dominant frequency components from the market, resulting in a more stable and noise-filtered signal.
This hybrid approach of signal processing + volume-based trend detection sets it apart from traditional oscillators that only operate in the time domain.
⚙️ Core Concepts:
📈 Volume Zone Oscillator (VZO):
Built on a directional volume engine that emphasizes bullish/bearish pressure via smoothed volume flows.
🔍 Fourier Transform Layer:
A Discrete Fourier Transform is applied to the most recent price and volume arrays to isolate dominant cyclic components and suppress noise.
🧠 Trigger Line Comparison:
A smoothed EMA of the oscillator is used as a signal line for crossovers, highlighting momentum shifts.
🔍 Key Features:
✅ Fourier-Decomposed Source Data
✅ Adaptive Smoothing of the Signal Line
✅ Color-coded Trend Conditions
✅ Customizable Thresholds for Overbought/Oversold Regions
✅ Background Fill Zones for Visual Context
✅ Bar Color Overlays to Track Signal Transitions
📌 How to Use It:
When FSVZO > Trigger Line, bullish volume momentum dominates (green bars).
When FSVZO < Trigger Line, bearish volume momentum dominates (red bars).
Use ±60/90 zones as overbought and oversold thresholds.
Great for momentum confirmation, mean-reversion plays, and early trend detection when used with price action or moving averages.
⚠️ Designed For:
Momentum traders looking for a volume-aware oscillator
Analysts seeking signal stability through frequency filtering
Traders wanting a modern, noise-reduced alternative to RSI/MFI/VZO
⚠️ Disclaimer:
This script is for educational and research purposes only.
Past performance does not guarantee future results.
Always confirm with other indicators, price structure, and risk management.

ZigZag ProZigZag Pro is a precise market structure indicator that automatically detects two independent ZigZag patterns and highlights breakouts whenever significant highs or lows are breached.
The indicator calculates two separate ZigZag structures in real time. ZigZag1 captures the broader market swings and is ideal for trend or swing trading. ZigZag2 is optional and reacts more quickly – perfect for intraday or scalping setups. Both layers are fully customizable in terms of depth, color, and line width.
What makes this tool especially useful: whenever a previous swing high (for long trades) or swing low (for short trades) is broken, the indicator draws a horizontal breakout line on the chart. This makes it easy to spot structural breakouts and take advantage of potential momentum moves.
ZigZag Pro is designed for traders who rely on clean, rule-based market structure — whether you're trading classic breakouts, smart money concepts, or simply want a clearer view of trend shifts. The visuals are minimal, responsive, and suitable for any timeframe.

Bitcoin: Pi Cycle Top & Bottom | QuantumResearchBitcoin: Pi Cycle Top & Bottom | QuantumResearch
Adaptive Deviation Model for Bitcoin Macro Extremes
Bitcoin: Pi Cycle Top & Bottom by QuantumResearch is a proprietary interpretation of the famous Pi Cycle concept—enhanced with normalized deviation logic, adjustable thresholds, and visual clarity. Unlike traditional models that simply cross two moving averages, this tool calculates the dynamic spread between a short-term and amplified long-term exponential average, delivering a continuous score that adapts to Bitcoin's evolving volatility profile.
🧠 What Makes It Unique?
🔹 Pi Deviation Engine:
This creates a centered, symmetric oscillator that better visualizes overextended conditions—something the original Pi Cycle model does not offer.
🔹 Dynamic Zoning via Thresholds:
Users can set custom top and bottom thresholds to adjust sensitivity based on current market regimes, making it more flexible than static crossover models.
🔹 Gradient-Powered Area Fill:
The oscillator plot is filled with directional gradients that react to the score's magnitude, creating an intuitive visual spectrum between bullish and bearish extremes.
🔹 Macro-Focused, Overlay-Free:
The indicator runs in a clean subpanel, preserving chart space and allowing better integration into multi-layered macro dashboards.
🔹 Built for BTC’s Unique Structure:
The moving average lengths and logic are specifically calibrated to Bitcoin’s halving-driven cycles, unlike generic Pi models applied across asset classes.
🔍 Key Features
✅ Continuous Cycle Score (not binary crosses)
✅ Custom upper/lower thresholds for signal flexibility
✅ Visual gradient fill and background shading
✅ Zero chart clutter (non-overlay)
✅ Fully customizable moving average lengths
✅ Designed for macro cycle top/bottom detection
📌 Ideal For:
Long-term Bitcoin investors
Macro traders and analysts
Those seeking early warning signs of euphoria or despair
Anyone using on-chain + cyclical tools to time large market pivots
⚠️ Disclaimer
This indicator is for educational and research purposes only.
It does not provide financial advice or guarantees.
Past performance does not predict future behavior.
Always confirm with additional tools and analysis.

MAs For Loop | QuantumResearchMAs For Loop | QuantumResearch
Multi-MA Composite Momentum Scoring Engine
MAs For Loop is a unique, multi-layered moving average scoring system developed by QuantumResearch to capture persistent trend momentum through time-based strength analysis. Rather than using a single moving average or crossover, this tool evaluates the historical behavior of five different MA types simultaneously, scoring each one across a 50-bar window and generating a clean, confidence-weighted signal.
📚 How It Works:
For each selected MA (ZLEMA, DEMA, HMA, VIDYA, MEDIAN), the script applies a for-loop that compares the current value to its value over the past 50 bars.
If the MA is above its past value → +1
If it’s below → -1
These values are summed into a score for each MA, ranging from -50 to +50
These individual scores are then averaged into a final “MultiWave” score, which reflects the directional consensus of all five MAs.
🧠 What Makes This Unique?
Unlike traditional moving average signals (e.g., crossovers or price > MA), this system quantifies time-weighted directional pressure.
It doesn’t just tell you “trend or no trend”—it tells you how strong and how consistent that trend has been across multiple smoothing methods.
The composite for-loop engine captures structural momentum in a way that avoids lag and reduces noise from single-source inputs.
🔍 Included MAs & Customization:
📘 ZLEMA (Zero-Lag EMA)
📘 DEMA (Double EMA)
📘 HMA (Hull MA)
📘 VIDYA (Volatility-Adjusted MA)
📘 Median Filter (Percentile Rank 50%)
Users can:
Adjust lengths, sources, and visual color themes
Modify the bullish and bearish thresholds
Display a real-time trend scoring table
Visualize transitions with multi-layer HMA overlays and dynamic bar coloring
📊 Signals:
✅ Long → when average score > +40
🟥 Cash/Short → when average score < -10
All in-between states are neutral (gray)
🔔 Alerts:
"MAs For Loop Long" and "MAs For Loop Short" alert conditions are built-in.
📌 Use Case:
Designed for trend-following swing traders and momentum analysts who want:
Confirmation across multiple MA styles
Smoothed entries based on historical persistence
A scoring engine they can plug into larger systems
Better signal quality during consolidation or early breakout phases
⚠️ Disclaimer:
This tool is for educational and informational purposes only. It does not constitute financial advice or a recommendation to buy or sell any asset.
Past performance is not indicative of future results. Use at your own risk.

Trailing Stop Loss [TradingFinder] 4 Machine Learning Methods🔵 Introduction
The trailing stop indicator dynamically adjusts stop-loss (SL) levels to lock in profits as price moves favorably. It uses pivot levels and ATR to set optimal SL points, balancing risk and reward.
Trade confirmation filters, a key feature, ensure entries align with market conditions, reducing false signals. In 2023 a study showed filtered entries improve win rates by 15% in forex. This enhances trade precision.
SL settings, ranging from very tight to very wide, adapt to volatility via ATR calculations. These settings anchor SL to previous pivot levels, ensuring alignment with market structure. This caters to diverse trading styles, from scalping to swing trading.
The indicator colors the profit zone between the entry point (EP) and SL, using light green for buy trades and light red for sell trades. This visual cue highlights profit potential. It’s ideal for traders seeking dynamic risk management.
A table displays real-time trade details, including EP, SL, and profit/loss (PNL). Backtests show trailing stops cut losses by 20% in trending markets. This transparency aids decision-making.
🔵 How to Use
🟣 SL Levels
The trailing stop indicator sets SL based on pivot levels and ATR, offering four options: very tight, tight, wide, or very wide. Very tight SLs suit scalpers, while wide SLs fit swing traders. Select the base level to match your strategy.
If price hits the SL, the trade closes, and the indicator evaluates the next trade using the selected filter. This ensures disciplined trade management. The cycle restarts with a new confirmed entry.
Very tight SLs, set near recent pivots, trigger exits early to minimize risk but limit profits in volatile markets. Wide SLs, shown as farther lines, allow more price movement but increase exposure to losses. Adjust based on ATR and conditions, noting SL breaches open new positions.
🟣 Visualization
The indicator’s visual cues, like colored profit zones, simplify monitoring, with light green showing the profit area from EP to trailed SL. Dashed lines mark entry points, while solid lines track the trailed SL, triggering new positions when breached.
When price moves into profit, the area between EP and SL is colored—light green for longs, light red for shorts. This highlights the profit zone visually. The SL trails price, locking in gains as the trade progresses.
🟣 Filters
Upon trade entry, the indicator requires confirmation via filters like SMA 2x or ADX to validate momentum. Filters reduce false entries, though no guarantee exists for improved outcomes. Monitor price action post-entry for trade validity.
Filters like Momentum or ADX assess trend strength before entry. For example, ADX above 25 confirms strong trends. Choose “none” for unfiltered entries.
🟣 Bullish Alert
For a bullish trade, the indicator opens a long position with a green SL Line (after optional filters), trailing the SL below price. Set alerts to On in the settings for notifications, or Off to monitor manually.
🟣 Bearish Alert
In a bearish trade, the indicator opens a short position with a red SL Line post-confirmation, trailing the SL above price. With alerts On in the settings, it notifies the potential reversal.
🟣 Panel
A table displays all trades’ details, including Win Rates, PNL, and trade status. This real-time data aids in tracking performance. Check the table to assess trade outcomes instantly.
Review the table regularly to evaluate trade performance and adjust settings. Consistent monitoring ensures alignment with market dynamics. This maximizes the indicator’s effectiveness.
🔵 Settings
Length (Default: 10) : Sets the pivot period for calculating SL levels, balancing sensitivity and reliability.
Base Level : Options (“Very tight,” “Tight,” “Wide,” “Very wide”) adjust SL distance via ATR.
Show EP Checkbox : Toggles visibility of the entry point on the chart.
Show PNL : Displays profit/loss data for active and closed trades.
Filter : Options (“none,” “SMA 2x,” “Momentum,” “ADX”) validate trade entries.
🔵 Conclusion
The trailing stop indicator, a dynamic risk management tool, adjusts SLs using pivot levels and ATR. Its confirmation filters reduce false entries, boosting precision. Backtests show 20% loss reduction in trending markets.
Customizable SL settings and visual profit zones enhance usability across trading styles. The real-time table provides clear trade insights, streamlining analysis. It’s ideal for forex, stocks, or crypto.
While filters like ADX improve entry accuracy, no setup guarantees success in all conditions. Contextual analysis, like trend strength, is key. This indicator empowers disciplined, data-driven trading.

FVG (Nephew sam remake)Hello i am making my own FVG script inspired by Nephew Sam as his fvg code is not open source. My goal is to replicate his Script and then add in alerts and more functions. Thus, i spent few days trying to code. There is bugs such as lower time frame not showing higher time frame FVG.
This script automatically detects and visualizes Fair Value Gaps (FVGs) — imbalances between demand and supply — across multiple timeframes (15-minute, 1-hour, and 4-hour).
15m chart shows:
15m FVGs (green/red boxes)
1H FVGs (lime/maroon)
4H FVGs (faded green/red with borders) (Bugged For now i only see 1H appearing)
1H chart shows:
1H FVGs
4H FVGs
4H chart shows:
4H FVGs only
There is the function to auto close FVG when a future candle fully disrespected it.
You're welcome to:
🔧 Customize the appearance: adjust box colors, transparency, border style
🧪 Add alerts: e.g., when price enters or fills a gap
📅 Expand to Daily/Weekly: just copy the logic and plug in "D" or "W" as new layers
📈 Build confluence logic: combine this with order blocks, liquidity zones, or ICT concepts
🧠 Experiment with entry signals: e.g., candle confirmation on return to FVG
🚀 Improve performance: if you find a lighter way to track gaps, feel free to optimize!

ABC Trading ConceptOverview
ABC Trading Concept is a wave- and trend-based market structure indicator that identifies shifts in price behavior by analyzing impulse and correction patterns. It introduces a unique calculation method—Price-MAD-ATR Bands—to detect wave formation, trend reversals, and potential trade zones with dynamic adaptability to volatility and trend strength.
🔧 Core Logic and Calculations
1. Price-MAD-ATR Bands
At the heart of the script is a proprietary channel system based on:
MAD (MA Difference): Difference between fast and slow moving averages.
ATR (Average True Range): Measures current market volatility.
The bands are plotted as:
Upper Band = Price + MAD × ATR
Lower Band = Price − MAD × ATR
A breakout beyond these bands signals the formation of a new wave (up or down).
2. Wave Formation (A and B Waves)
Standard Method: A new wave forms when price breaks through a Price-MAD-ATR Band.
Extreme Method: A wave also forms when price breaks the passive extremum of an existing wave.
Wave A may be generated by a correction breaking the Reversal Point.
Wave B can be configured to form in three modes, including breakouts of internal or boosted counter-corrections.
3. Trend Structure
A trend is built from waves and includes:
Direction, active/passive extremums
Impulses and Corrections (each tracked independently)
Reversal Point: Defined by a boosted correction breakout
G-Point: Set at the active extremum of Wave A
Vic Line: A trendline derived from previous correction extremums (optional)
When price breaks above the G-point, a new trend may be initiated.
4. Correction Boost Logic
A correction becomes boosted when price exceeds a configurable multiple of the correction’s range. Boosted corrections define key zones and enable the creation of Reversal Points and Wave A setups.
5. Vic Sperandeo Line
Optionally used to enhance trend structure confirmation. Drawn between extremums of previous corrections and may act as a secondary condition for forming Wave A.
6. SL/TP Level Calculation
At the start of a new trend, SL and TP levels are automatically plotted based on:
The extremums of Wave A or Wave B (selectable)
Configurable ratios (e.g., 1.382, 2.0, 2.618 for TP levels)
📊 Visual Elements on the Chart
Bands: Price-MAD-ATR Bands as adaptive upper/lower thresholds
Waves: Yellow zigzag lines
Trends: Blue (or purple for hard-type) trendlines with directional arrow
Reversal Point: Dashed horizontal line (starts from key correction breakout)
Correction Zone: Shaded rectangle from boosted correction range
Vic Line: Dashed support/resistance trendline
TP/SL Levels: Dotted horizontal levels, plotted at trend origin
⚙️ Inputs and Customization
You can adjust:
ATR and MA parameters
Band width multiplier
Boost strength threshold for corrections
SL/TP levels and logic (by Wave A or B)
Vic Line usage and visual styles for each element
Over 40 configurable settings are available to adapt the indicator to your strategy.
🧠 How to Use
Look for a new trend start when G-point is broken.
Use Wave A/B structure and Reversal Point for setup planning.
Correction Zones help identify re-entry areas or stop placement.
Follow TP/SL levels to manage exits with structural targets.
The Vic Line can act as dynamic support/resistance in context.
The indicator provides analytical insights—it does not generate automatic signals.
💡 What Makes It Unique
Unlike typical wave or Zigzag indicators, ABC Trading Concept introduces a volatility-adjusted wave logic using Price-MAD-ATR Bands. This method combines trend momentum (MA differential) with market volatility (ATR), offering a more flexible and noise-resistant structure recognition system. The integration of Wave A/B logic, dynamic reversal zones, and Vic Line validation makes it a comprehensive tool for structural traders.
⚠️ Disclaimer
This tool is for technical analysis and educational purposes. It does not guarantee profit or forecast market direction. Trading involves risk—use this script as part of a larger strategy with proper risk management.

Taylor Series ForecastThis indicator projects future price movement using a second-order Taylor Series expansion, calculated from a smoothed price (EMA). It models price momentum and acceleration to generate a forward-looking trajectory.
Forecast points are plotted continuously as connected line segments extending into the future. Each segment is color-coded based on slope:
Green indicates an upward slope (bullish forecast).
Red indicates a downward slope (bearish forecast).
The forecast adapts to current market conditions and updates dynamically with each new bar. Useful for visualizing potential future price paths and identifying directional bias based on recent price action.
Inputs:
Max Forecast Horizon: How many bars into the future the forecast extends.
EMA Smoothing Length: The smoothing applied to price before calculating derivatives.
This tool is experimental and should be used in conjunction with other analysis methods. It does not guarantee future price performance.

Elliott Wave Noise FilterElliott Wave Noise Filter
Overview
The Elliott Wave Noise Filter is a specialized indicator for TradingView, designed to solve one of the biggest challenges in Elliott Wave analysis on lower timeframes: the identification of market noise. By combining multiple advanced filtering techniques, this indicator helps distinguish meaningful price action from random fluctuations.
The Problem
On lower timeframes—especially below 15 minutes—Elliott Wave analysis is significantly impacted by excessive market noise. This noise can lead to misinterpretation of wave structures, making it difficult to execute reliable trading decisions.
The Solution
The Elliott Wave Noise Filter utilizes four powerful methods to detect and filter noise:
ATR-Based Volatility Analysis: Identifies price movements too small to be structurally meaningful
Volume Confirmation: Filters out price moves that occur with insufficient volume
Trend Strength Measurement (ADX): Detects periods of weak trend activity, where noise tends to dominate
Fractal Pattern Recognition: Marks significant turning points that could be relevant for Elliott Wave analysis
Features
Visual Indicators
Background Coloring: Red indicates noise; green signifies a clear signal
Hull Moving Average: Smooths price action and highlights the prevailing trend
Fractal Markers: Triangles mark significant highs and lows
Status Panel: Displays current noise status and ADX value
Customization Options
ATR Period: Adjust the lookback period for ATR calculations
Noise Threshold: Defines the percentage of ATR below which a movement is considered noise
Volume Filter: Can be enabled or disabled
Volume Threshold: Sets the ratio to average volume for a move to be deemed significant
Hull MA Display and Length: Configure the moving average settings
ADX Parameters: Adjust trend strength sensitivity
Use Cases
For Elliott Wave Analysis
Eliminate noise to identify cleaner wave structures
Use fractal markers as potential wave endpoints
Reference the Hull MA for determining the broader trend
For General Trading
Identify high-noise periods to avoid low-quality setups
Spot clearer market phases for better entries
Assess price action quality through visual cues
Multi-Timeframe Approach
Apply the indicator across different timeframes for a comprehensive view
Prefer trading when both higher and lower timeframes align with consistent signals
Optimal Settings
For Very Short Timeframes (1–5 minutes)
Higher Noise Threshold (0.4–0.5)
Longer ATR Period (20–30)
Higher Volume Threshold (1.0–1.2)
For Medium Timeframes (15–60 minutes)
Medium Noise Threshold (0.2–0.3)
Standard ATR Period (14)
Standard Volume Threshold (0.8)
For Higher Timeframes (4h and above)
Lower Noise Threshold (0.1–0.2)
Shorter ATR Period (10)
Lower Volume Threshold (0.6–0.7)
Conclusion
The Elliott Wave Noise Filter is an essential tool for any Elliott Wave analyst or trader working on lower timeframes. By reducing noise and emphasizing significant market movements, it enables more precise analysis and potentially more profitable trading decisions.
Note: As with any technical indicator, the Elliott Wave Noise Filter should be used as part of a broader trading strategy and not as a standalone signal for trade execution.

IU Mean Reversion SystemDESCRIPTION
The IU Mean Reversion System is a dynamic mean reversion-based trading framework designed to identify optimal reversal zones using a smoothed mean and a volatility-adjusted band. This system captures price extremes by combining exponential and running moving averages with the Average True Range (ATR), effectively identifying overextended price action that is likely to revert back to its mean. It provides precise long and short entries with corresponding exit conditions, making it ideal for range-bound markets or phases of low volatility.
USER INPUTS :
Mean Length – Controls the smoothness of the mean; default is 9.
ATR Length – Defines the lookback period for ATR-based band calculation; default is 100.
Multiplier – Determines how wide the upper and lower bands are from the mean; default is 3.
LONG CONDITION :
A long entry is triggered when the closing price crosses above the lower band, indicating a potential upward mean reversion.
A position is taken only if there is no active long position already.
SHORT CONDITION :
A short entry is triggered when the closing price crosses below the upper band, signaling a potential downward mean reversion.
A position is taken only if there is no active short position already.
LONG EXIT :
A long position exits when the high price crosses above the mean, implying that price has reverted back to its average and may no longer offer favorable long risk-reward.
SHORT EXIT :
A short position exits when the low price crosses below the mean, indicating the mean reversion has occurred and the downside opportunity has likely played out.
WHY IT IS UNIQUE:
Uses a double smoothing approach (EMA + RMA) to define a stable mean, reducing noise and false signals.
Adapts dynamically to volatility using ATR-based bands, allowing it to handle different market conditions effectively.
Implements a state-aware entry system using persistent variables, avoiding redundant entries and improving clarity.
The logic is clear, concise, and modular, making it easy to modify or integrate with other systems.
HOW USER CAN BENEFIT FROM IT :
Traders can easily identify reversion opportunities in sideways or mean-reverting environments.
Entry and exit points are visually labeled on the chart, aiding in clarity and trade review.
Helps maintain discipline and consistency by using a rule-based framework instead of subjective judgment.
Can be combined with other trend filters, momentum indicators, or higher time frame context for enhanced results.

Aggregated VolumeThis is the volume for crypto instruments. The volume in crypto instruments is different from the volume in stock or forex instruments. Because in crypto instrument at the same coin, for example bitcoin, there are differences in volume appearing on chart in Tradingview between exchanges. For example the exchanges on Binance and OKX, and between the spot market and the future or perpetual market, even though the transaction is in the same coin, bitcoin, there are differences in volume appearing on chart.
For those of us who trade relying on base volume as the main analysis in trading or investing, it is important to see the differences in volume between exchanges on Bitget, Binance, Bybit, and others, that Tradingview does not display the total transaction volume on the chart, but only the transaction volume per exchange, that does not describe the reality of the transaction volume. Therefore we need an indicator that totals volume on all exchanges, both spot and future / perpetual markets.
This indicator is called Aggregated Volume, which is the total volume of the exchanges: Binance, Bybit, OKX, Coinbase, Bitget, Kukoin, Kraken, Cryptocom, and Mexc. We chose these exchanges because they are the top 9 exchanges in the world that dominate the crypto market.
Therefore, this indicator appearing the total volume of transactions made on the 9 exchanges, both spot and perpetual, and will be summed into one volume indicator called " Aggregated Volume ".

Money Flow: In & Out Detector[THANHCONG]Indicator Name:
Money Flow: In & Out Detector
Indicator Description:
The Money Flow: In & Out Detector indicator uses technical indicators such as RSI (Relative Strength Index), MFI (Money Flow Index), and volume analysis to determine money inflow and outflow in the market.
This indicator helps traders identify changes in money flow, allowing them to detect buy and sell signals based on the combination of the following factors:
RSI > 50 and MFI > 50: Money inflow, indicating a buy signal.
RSI < 50 and MFI < 50: Money outflow, indicating a sell signal.
Volume increase/decrease relative to the average: Identifies strong market behavior changes.
Adjustable Parameters:
RSI Length: The number of periods to calculate the RSI (default is 14).
MFI Length: The number of periods to calculate the MFI (default is 14).
Volume MA Length: The number of periods to calculate the moving average of volume (default is 20).
Volume Increase/Decrease (%): The percentage threshold for volume change compared to the moving average (default is 20%).
Look Back Period: The number of periods used to identify peaks and troughs (default is 20).
How to Use the Indicator:
Money Inflow: When both RSI and MFI are above 50, and volume increases significantly relative to the moving average, the indicator shows a Buy signal.
Money Outflow: When both RSI and MFI are below 50, and volume decreases significantly relative to the moving average, the indicator shows a Sell signal.
Identifying Peaks and Troughs: The indicator also helps identify market peaks and troughs based on technical conditions.
Note:
This indicator assists in decision-making, but does not replace comprehensive market analysis.
Use this indicator in conjunction with other technical analysis methods to increase the accuracy of trade signals.
Steps for Publishing the Indicator on TradingView:
Log in to TradingView:
Go to TradingView and log into your account.
Access Pine Script Editor:
Click on Pine Editor from the menu under the chart.
Paste your Pine Script® code into the editor window.
Check the Source Code:
Ensure your code is error-free and running correctly.
Review the entire source code and add the MPL-2.0 license notice if necessary.
Save and Publish:
After testing and confirming the code works correctly, click Add to Chart to try the indicator on your chart.
If satisfied with the result, click Publish Script at the top right of the Pine Editor.
Provide a name for the indicator and then enter the detailed description you’ve prepared.
Ensure you specify the MPL-2.0 license in the description if required.
Choose the Access Type:
You can choose either Public or Private access for your indicator depending on your intention.
Submit for Publication:
Wait for TradingView to review and approve your indicator. Typically, this process takes a few working days for verification and approval.
User Guide:
You can share detailed instructions for users on how to use the indicator on TradingView, including how to adjust the parameters and interpret the signals. For example:
Set RSI Length: Experiment with different RSI Length values to find the sensitivity that suits your strategy.
Interpreting In/Out Signals: When there is strong money inflow (In), consider entering a buy order. When there is strong money outflow (Out), consider selling.

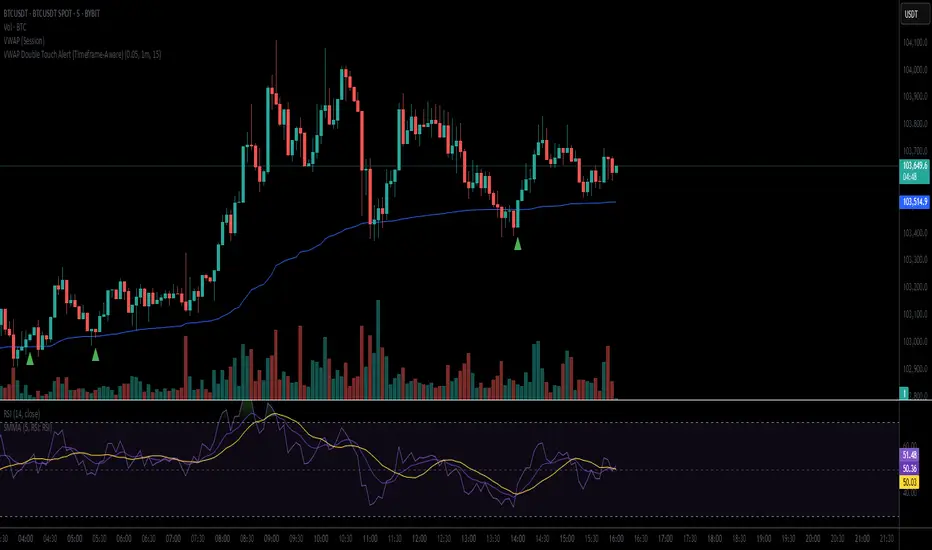
VWAP Double Touch Alert (Timeframe-Aware)📌 VWAP Double Touch Alert — Smart Re-entry Signal for Precision Traders
Take your VWAP trading to the next level with this intelligent indicator that filters out the noise and zeroes in on high-probability re-entry setups.
💡 How it works:
This script tracks every time price touches the VWAP line and alerts you when it happens twice within a defined window of time (adjustable per your timeframe). This is often a sign of smart money accumulation, potential reversals, or explosive breakouts.
🔍 Why Traders Love It:
✅ Filters out weak signals — only alerts on confirmed double touches
✅ Fully adjustable VWAP zone sensitivity
✅ Selectable timeframe profiles or custom window (1m, 5m, 15m, 30m, etc.)
✅ Clean visual cues with minimal chart clutter
✅ Perfect for scalping, intraday reversals, or VWAP mean-reversion strategies
⚙️ Customization:
VWAP zone width (in %)
Time window in bars or automatic based on timeframe
Custom alert messages
Alert only triggers once per double-touch event to avoid spamming
🎯 Best For:
Crypto scalpers & day traders
VWAP bounce and mean-reversion traders
Traders who want clean, conclusive entry alerts without lag
Long Short dom📊 Long Short dom (VI+) — Custom Vortex Trend Strength Indicator
This indicator is a refined version of the Vortex Indicator (VI) designed to help traders identify trend direction, momentum dominance, and potential long/short opportunities based on VI+ and VI– dynamics.
🔍 What It Shows:
• VI+ (Green Line): Measures upward trend strength.
• VI– (Red Line): Measures downward trend strength.
• Histogram (optional): Displays the difference between VI+ and VI–, helping visualize which side is dominant.
• Background Coloring: Highlights bullish or bearish dominance zones.
• Zero Line: A visual baseline to enhance clarity.
• Highest/Lowest Active Lines: Real-time markers for the strongest directional signals.
⸻
🛠️ Inputs:
• Length: Vortex calculation period (default 14).
• Show Histogram: Enable/disable VI+–VI– difference bars.
• Show Trend Background: Toggle colored zones showing trend dominance.
• Show Below Zero: Decide whether to display values that fall below 0 (for advanced use).
⸻
📈 Strategy Insights:
• When VI+ crosses above VI–, it indicates potential long momentum.
• When VI+ crosses below VI–, it signals possible short pressure.
• The delta histogram (VI+ – VI–) helps you quickly see shifts in momentum strength.
• The background shading provides an intuitive visual cue to assess trend dominance at a glance.
⸻
🚨 Built-in Alerts:
• Bullish Cross: VI+ crosses above VI– → possible entry long.
• Bearish Cross: VI+ crosses below VI– → possible entry short.
⸻
✅ Ideal For:
• Trend-following strategies
• Identifying long/short bias
• Confirming entries/exits with momentum analysis
⸻
This tool gives you clean, real-time visual insight into trend strength and shift dynamics, empowering smarter trade decisions with clarity and confidence.
Vietnamese Market Structure With CountersThis indicator is designed to track Market Structure with Swing-Low Breakdowns and Swing-High Breakups specifically tailored for the Vietnamese stock market, though it can be applied elsewhere too. By default, it uses a 10-period EMA to dynamically detect key turning points in price action and count significant breakdowns or breakups from previous swing levels.
As an open source, you can modify the source code to match your needs.
What it does:
Detects when price breaks below previous swing lows or above previous swing highs.
Plots swing levels for both highs and lows.
Displays labeled counters on the chart to show how many consecutive breakdowns or breakups have occurred.
Helps traders identify trend shifts and possible exhaustion in moves.
Why it's useful:
This tool is great for visually tracking market momentum and structure changes — especially in trending or volatile environments. It emphasizes structure over indicators, helping you understand price behavior in a simplified, intuitive way.
License:
This script is published under the Mozilla Public License 2.0. Feel free to use, modify, and contribute!
Created with care by @doqkhanh.
If you find it useful, consider leaving a comment or sharing it with others!
