INVITE-ONLY SCRIPT
Asset Correlation Prediction Table with EMA & RSI

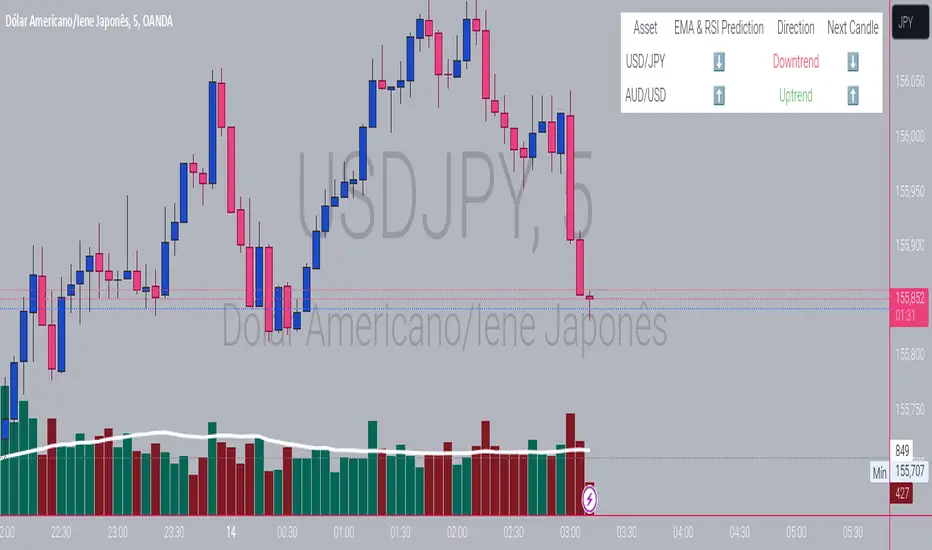
This indicator helps traders monitor short-term trends and predict the next 5-minute candle direction for two assets: USD/JPY and AUD/USD. The prediction is based on a combination of two Exponential Moving Averages (EMAs) and the Relative Strength Index (RSI), offering a simple yet effective method for forecasting price movements.
How the Script Works:
Trend Detection:
EMAs: The script uses two EMAs—one with a 9-period length and another with a 14-period length—to detect trends. A bullish trend is identified when the price is above both EMAs, while a bearish trend is indicated when the price is below both EMAs.
RSI: The script also utilizes the RSI with a 14-period length. An RSI value above 70 signals an overbought condition, and a value below 30 signals an oversold condition. This helps to confirm or reject the trend based on momentum and price conditions.
Next-Candle Prediction:
The script predicts the direction of the next 5-minute candle based on the relationship between the current price, the EMAs, and the RSI values. A bullish prediction is made if both EMAs are trending upwards and the RSI is not overbought. A bearish prediction occurs when both EMAs are trending downward, and the RSI is not oversold.
Table Display:
The script displays a real-time table at the top-right of the chart with the following columns:
Asset: The currency pair being analyzed (USD/JPY or AUD/USD).
EMA & RSI Trend Prediction: Indicates the current trend based on the EMAs and RSI.
Direction: Shows whether the current trend is up, down, or neutral.
Next Candle: A prediction of the likely direction of the next 5-minute candle (bullish, bearish, or neutral).
How to Use the Script:
Add the Indicator: Apply the script to any chart with a 5-minute timeframe. While optimized for USD/JPY and AUD/USD, the script can be adapted to other assets by adjusting the symbol.
Interpret the Table: The table displays the current trend direction and the predicted movement of the next candle. Traders can use these predictions to guide short-term entries and exits.
Customization: Traders can modify the EMA and RSI periods and RSI threshold values to adjust the script for different trading strategies or asset characteristics.
Key Concepts:
Trend Detection: Uses EMAs and RSI to identify the current market trend (bullish, bearish, or neutral).
Next-Candle Prediction: Provides a prediction for the next 5-minute candle’s direction based on trend analysis.
Simple and Effective: Combines well-known indicators (EMA and RSI) for a straightforward trading tool suitable for short-term traders and scalpers.
Скрипт с ограниченным доступом
Доступ к этому скрипту разрешён только для пользователей, авторизованных автором, и для этого обычно требуется оплата. Вы можете добавить скрипт в список избранных, но использовать его можно будет только после запроса на доступ и получения разрешения от автора. Свяжитесь с Norrax, чтобы узнать больше, или следуйте инструкциям автора ниже.
TradingView не советует платить за скрипт и использовать его, если вы на 100% не доверяете его автору и не понимаете, как он работает. Часто вы можете найти хорошую альтернативу с открытым исходным кодом бесплатно в нашем разделе Скрипты сообщества.
Хотите использовать этот скрипт на графике?
Внимание: прочтите это перед тем, как запросить доступ.
As a developer, my goal is to contribute to the community by creating solutions that promote collective growth. I believe in collaboration and knowledge sharing for continuous learning and innovation.
Отказ от ответственности
Все виды контента, которые вы можете увидеть на TradingView, не являются финансовыми, инвестиционными, торговыми или любыми другими рекомендациями. Мы не предоставляем советы по покупке и продаже активов. Подробнее — в Условиях использования TradingView.