INVITE-ONLY SCRIPT
VolWaves‴ | Volume Waves‴
Обновлено
What does it do?
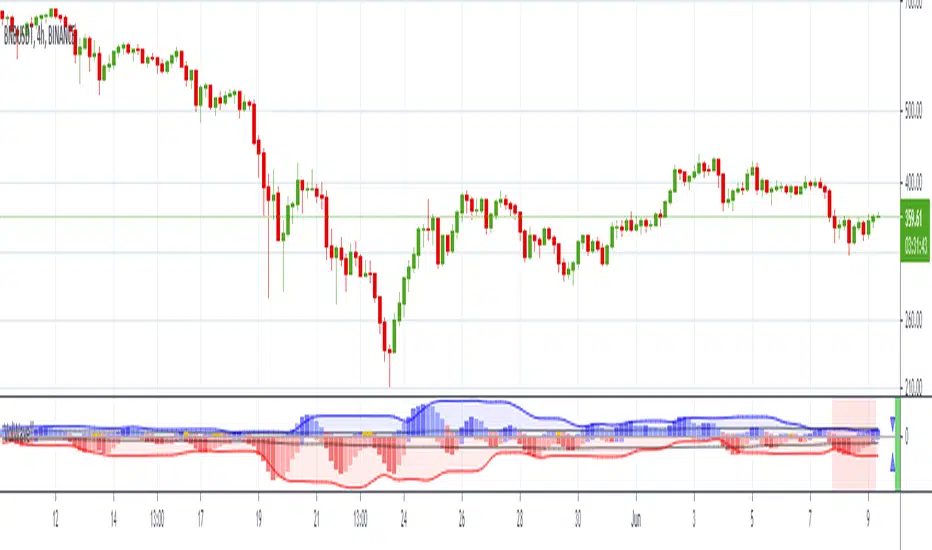
This indicator allows you to identify possible top and bottom reversals by having a prior volume reversal identifiable by positive (top reversal) and negative (bottom reversal) waves.
How does it work?
Everytime the wave starts ending its movement by shrinking the size of the histogram bars, it might be signing that a price reversal is on its way. It is possible to adjust the wave shape by increasing/decreasing its gradient value analysis, but it's so easy to use that sometimes no reconfiguration is needed, just add it and let it guide you.
What's my filling?
I've been testing this indicator for weeks and so far with incredible reversal signals.
Информация о релизе
Otimized version.Информация о релизе
What signals it provides:- measures the directional force of the volume
- suggests movement reversal
Indicator attributes:
- generally waves formation makes a symmetrical arc
- when the second half of a wave is elongated (compared to its first half), it suggests a lack of directional force of the current movement
- peak / bottom formation suggests reversal of the current movement
- smaller amplitude of a wave (compared to the previous wave) suggests loss of power, and vice-verse
- indicates divergence indication between peaks / bottoms
- when the volume bar touches the volume wave band, it suggests imminent reversal of the current movement
- band opening suggests movement increasing strength in that direction
- wavelengths (distance between two peaks / bottoms) tend to be similar
- subsequent wave rarely occurs
Technical information:
- the calculation of the positive movement is independent of the calculation of the positive movement
- the black line in the upper and lower zone is the average of the wave that is overcome, suggests strength in movement
- bands suggest delimitation of a wave's peak / bottom
Информация о релизе
Some improvements:- new Expantion/Contraction signal
- code optimization
Информация о релизе
Just another publication with a cleaner chart.Информация о релизе
Just added the very right bar image and the Expantion/Contraction arrows that didn't show up in the previous chart.Информация о релизе
Just minor adjustment to the INPUT panel.Информация о релизе
Histogram Expand/Contract Arrow Sign implemented.Информация о релизе
Just updated the colors for the Histogram Expantion/Contration Arrow Sign. Информация о релизе
Just minor ajustment to Hhistogram color to make it easier to view.Информация о релизе
Some nice new features:1. now you can choose with color setup you which to see the waves presenting (I like the standard since the other option leads me to misunderstanding signal);
2. light red background presented every time the Volatility is activated in the indicator's timeframe.
Скрипт с ограниченным доступом
Доступ к этому скрипту разрешён только для пользователей, авторизованных автором, и для этого обычно требуется оплата. Вы можете добавить скрипт в список избранных, но использовать его можно будет только после запроса на доступ и получения разрешения от автора. Свяжитесь с MarceloTorres, чтобы узнать больше, или следуйте инструкциям автора ниже.
TradingView не советует платить за скрипт и использовать его, если вы на 100% не доверяете его автору и не понимаете, как он работает. Часто вы можете найти хорошую альтернативу с открытым исходным кодом бесплатно в нашем разделе Скрипты сообщества.
Инструкции от автора
″If you wish to now more about this indicator, please DM me. Do not call me through the comments area.
Хотите использовать этот скрипт на графике?
Внимание: прочтите это перед тем, как запросить доступ.
TRADEWISER | Marcelo Torres
marcelo@tradewiser.pro
Vídeo-Análise completa diária no YouTube:
youtube.com/c/TradeWiserPro
Curso/AE
CursoAE.TradeWiser.pro
@TradeWiserPro
Telegram, Twitter, Facebook, LinkedIn, Instagram
marcelo@tradewiser.pro
Vídeo-Análise completa diária no YouTube:
youtube.com/c/TradeWiserPro
Curso/AE
CursoAE.TradeWiser.pro
@TradeWiserPro
Telegram, Twitter, Facebook, LinkedIn, Instagram
Отказ от ответственности
Все виды контента, которые вы можете увидеть на TradingView, не являются финансовыми, инвестиционными, торговыми или любыми другими рекомендациями. Мы не предоставляем советы по покупке и продаже активов. Подробнее — в Условиях использования TradingView.