INVITE-ONLY SCRIPT
Oscillator pack [Tcs] | OSC
These oscillators are a reinterpretation of some of the most famous indicators for traders, with the scope to provide higher accuracy and better readability.
The improvements are based on both calculation and visual impact, with calculations incorporating not only price but also tick volume to enhance signal accuracy.
All oscillators can be applied to different timeframes than the chart being analyzed.
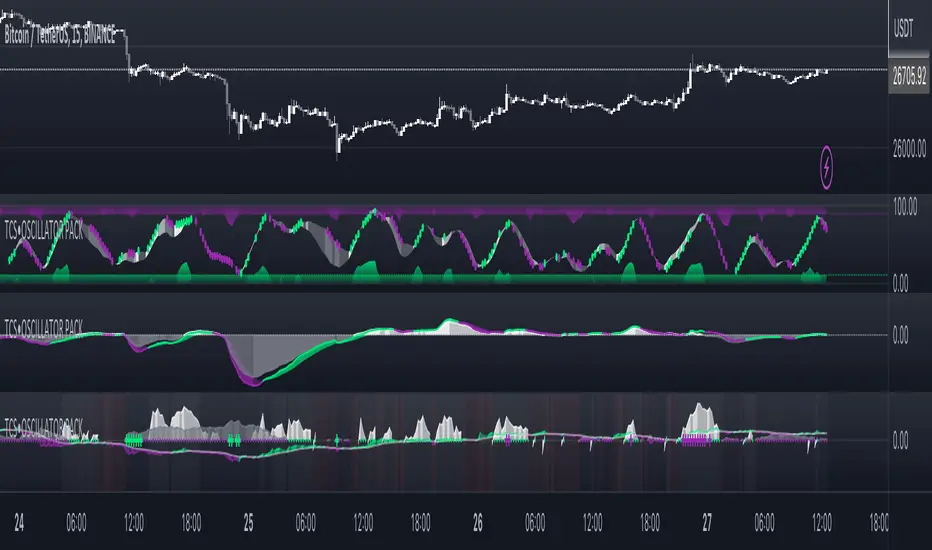
This indicator includes three different oscillators: TCS Stochastic, TCS MACD, and TCS Momentum.
•TCS STOCHASTIC
The TCS STOCHASTIC removes the noise from the standard RSI Stochastic and significantly reduces the number of anticipated signals (line crosses) that the RSI Stochastic provides. Similarly, the divergences are less frequent but more accurate.
The indicator plots overbought conditions (plotted as green waves) and oversold conditions (plotted as purple waves) in a clear way.
The Stochastic channel marks the power of buyers or sellers with white (bullish) and gray (bearish) shades.
The dots on the Stochastic line indicate when buyers or sellers are in control. This helps both in trend following conditions and reversal points.
The tinier the channel, defined by the Stochastic line and signal line, the stronger the trend is likely to be.

•TCS MACD
The TCS MACD removes noise from the standard MACD and often anticipates good entry points for standard MACD crosses, while delaying bad ones.
Additionally, the indicator's performance for divergences has been improved, as it takes into account both price action and on balance volume.
It has also been developed to provide better performance at the 0 line level, which can be a good entry point when the baseline is crossed.
The histogram helps to identify divergences and the strength of the trend.

•TCS MOMENTUM
The TCS MOMENTUM WAVES indicate the trend direction based on the strength of momentum and moments of accumulation/distribution, which are highlighted with a red background.
Bullish trends are represented with white waves, while bearish trends are shown in gray.
Crosses symbol on the 0 line indicate a possible trend reversal, with green for bullish and purple for bearish.
The best entry point for a reversal is when the momentum line changes to the trend direction color after a reversal point is detected.
The momentum line and its signal line can also be used to identify entry points for a strategy, as well as the crosses of the waves.

Please note that this indicator is for educational purposes only and should not be used for trading without further testing and analysis.
The improvements are based on both calculation and visual impact, with calculations incorporating not only price but also tick volume to enhance signal accuracy.
All oscillators can be applied to different timeframes than the chart being analyzed.
This indicator includes three different oscillators: TCS Stochastic, TCS MACD, and TCS Momentum.
•TCS STOCHASTIC
The TCS STOCHASTIC removes the noise from the standard RSI Stochastic and significantly reduces the number of anticipated signals (line crosses) that the RSI Stochastic provides. Similarly, the divergences are less frequent but more accurate.
The indicator plots overbought conditions (plotted as green waves) and oversold conditions (plotted as purple waves) in a clear way.
The Stochastic channel marks the power of buyers or sellers with white (bullish) and gray (bearish) shades.
The dots on the Stochastic line indicate when buyers or sellers are in control. This helps both in trend following conditions and reversal points.
The tinier the channel, defined by the Stochastic line and signal line, the stronger the trend is likely to be.
•TCS MACD
The TCS MACD removes noise from the standard MACD and often anticipates good entry points for standard MACD crosses, while delaying bad ones.
Additionally, the indicator's performance for divergences has been improved, as it takes into account both price action and on balance volume.
It has also been developed to provide better performance at the 0 line level, which can be a good entry point when the baseline is crossed.
The histogram helps to identify divergences and the strength of the trend.
•TCS MOMENTUM
The TCS MOMENTUM WAVES indicate the trend direction based on the strength of momentum and moments of accumulation/distribution, which are highlighted with a red background.
Bullish trends are represented with white waves, while bearish trends are shown in gray.
Crosses symbol on the 0 line indicate a possible trend reversal, with green for bullish and purple for bearish.
The best entry point for a reversal is when the momentum line changes to the trend direction color after a reversal point is detected.
The momentum line and its signal line can also be used to identify entry points for a strategy, as well as the crosses of the waves.
Please note that this indicator is for educational purposes only and should not be used for trading without further testing and analysis.
Скрипт с ограниченным доступом
Доступ к этому скрипту разрешён только для пользователей, авторизованных автором, и для этого обычно требуется оплата. Вы можете добавить скрипт в список избранных, но использовать его можно будет только после запроса на доступ и получения разрешения от автора. Свяжитесь с zendrer, чтобы узнать больше, или следуйте инструкциям автора ниже.
TradingView не советует платить за скрипт и использовать его, если вы на 100% не доверяете его автору и не понимаете, как он работает. Часто вы можете найти хорошую альтернативу с открытым исходным кодом бесплатно в нашем разделе Скрипты сообщества.
Инструкции от автора
″You can find all the necessary info in the website http://www.thecryptostrategist.com
Хотите использовать этот скрипт на графике?
Внимание: прочтите это перед тем, как запросить доступ.
For the access to premium indicators please contact me on tradingview
Отказ от ответственности
Все виды контента, которые вы можете увидеть на TradingView, не являются финансовыми, инвестиционными, торговыми или любыми другими рекомендациями. Мы не предоставляем советы по покупке и продаже активов. Подробнее — в Условиях использования TradingView.