INVITE-ONLY SCRIPT
[SignalFI] MACD+RSI+MA Trend [V1.0]
Обновлено
Welcome,
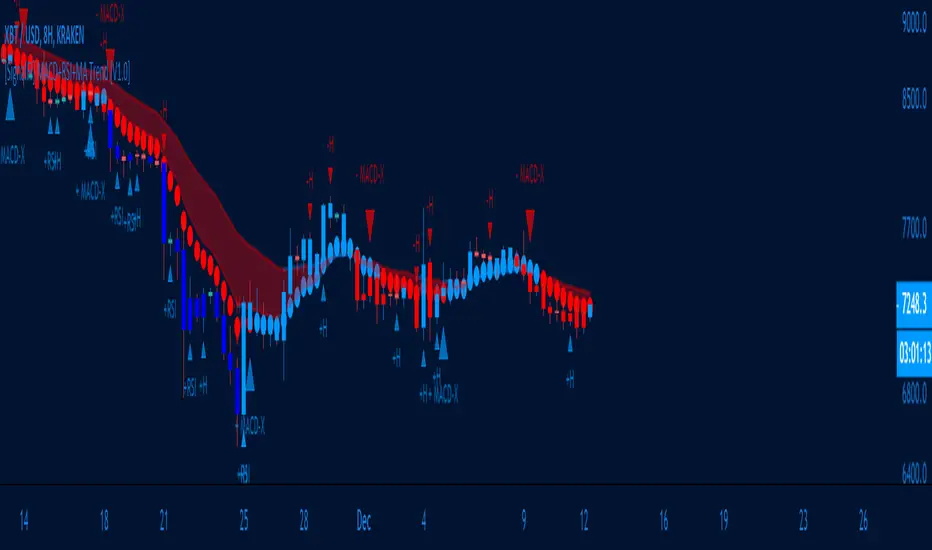
Proud to release a trending analysis tool for looking at the popular strategy of RSI + MACD + 12/26 EMA moving averages. The script is a unified trend script that shows:
- 12/26 EMA Trend
- MACD Crossovers
- MACD Histogram Pivots
- RSI Overbought (RSI > 70 = White Candles)
- RSI Oversold (RSI < 30 = Deep Blue Candles)
- RSI Pivots
Collectively, this allows you to implement and alert on one of the most popular and widely use strategies, all from one script.
In addition, we've added a third EMA moving average (Default 9 Candle EMA) that represents the MACD signal line on the chart. This line will change color to denote whether the MACD signal line is rising or falling compared to the previous candle (represented by the 'circles trend line' on the graph).
Script is fully alerted:
1) Bull MACD X
2) Bear MACD X
3) MACD Histo Pivot (Bull/Bear)
4) RSI Pivot (Bull/Bear)
5) Signal Line X (Bull/Bear)
Enjoy!
SignalFI was created to help traders and investors to effectively analyze the market based on the Golden Mean Ratio (Fibonacci numbers), plan a trade and ultimately execute it. To help inform and educate market decisions we developed a set of Trading Indicators which are available on TradingView , the most advanced and yet easy to use charting platform available on the web.
SignalFI indicators are just that, indicators. Our indicators are generally configured to use completely historical data (negating repaint), and we advise all alerts created with SignalFI indicators to be fired upon "close" of the current candle. Our indicators can provide valuable context and visualization support when performing market analysis and executing buy and sell decisions. However. we are not financial experts, and all information presented on this site or our other media outlets are for educational purposes only.
For subscription information, visit signalfi.net and follow us on twitter .
Информация о релизе
1) Color editsИнформация о релизе
1) Revert CodeСкрипт с ограниченным доступом
Доступ к этому скрипту разрешён только для пользователей, авторизованных автором, и для этого обычно требуется оплата. Вы можете добавить скрипт в список избранных, но использовать его можно будет только после запроса на доступ и получения разрешения от автора. Свяжитесь с SignalFi, чтобы узнать больше, или следуйте инструкциям автора ниже.
TradingView не советует платить за скрипт и использовать его, если вы на 100% не доверяете его автору и не понимаете, как он работает. Часто вы можете найти хорошую альтернативу с открытым исходным кодом бесплатно в нашем разделе Скрипты сообщества.
Инструкции от автора
″
Хотите использовать этот скрипт на графике?
Внимание: прочтите это перед тем, как запросить доступ.
SignalFi is creating cutting edge TradingView scripts to help identify rogue market Alpha. Check out signalfi.net for subscription information and @signalfi_ on Twitter for updates.
Отказ от ответственности
Все виды контента, которые вы можете увидеть на TradingView, не являются финансовыми, инвестиционными, торговыми или любыми другими рекомендациями. Мы не предоставляем советы по покупке и продаже активов. Подробнее — в Условиях использования TradingView.