INVITE-ONLY SCRIPT
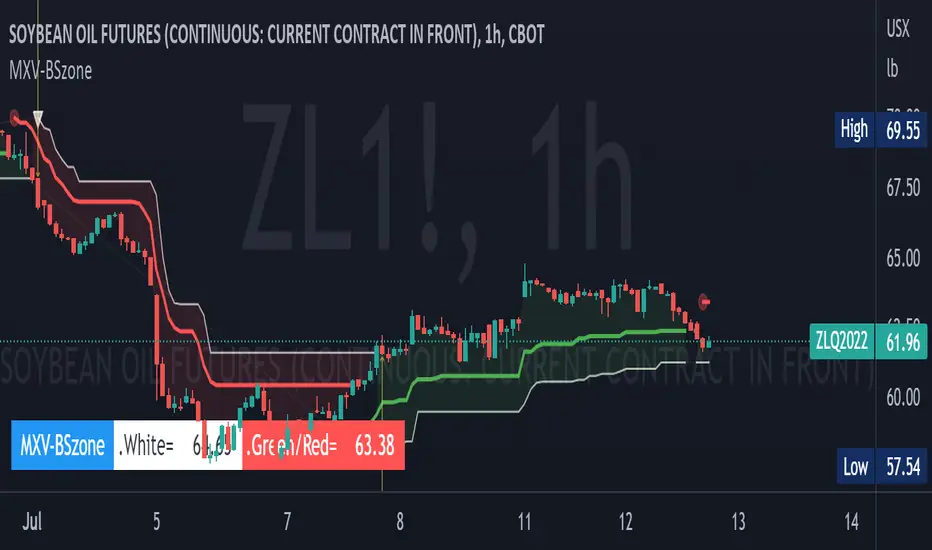
MXV-BSzone

Summary: averaging down the cost of capital with lines and color zones
The strategy can include many long entries when the market is bullish or many short entries when the market is bearish hourly. And we put a stoploss order with same value for all of them.
For me, it is always dificult to detect when and at which best price exactly to stop loss and to take profit after I make an buy or sell entry in hourly time frame, so i make may entry at different price values. And i prefer make only one stoploss price for all the entries
I use 2 visual trailing lines to determine zone of stop loss or take profit in same chart.
Every 60 minutes 2 visual horizontal line will permanently stamp on the charts: red and white.
When to Sell
- When the market is bearish in daily time frame, red line will be marked in H1 time frame as for sell zone. And when candles move up near or cut cross over the red line (we call it: action moment), it is recommended that we should short and make a stoploss at price of the white line (white line in this situation is higher than the red line). I can take profit whenever I have time to watch chart.
When to buy
- When the market is bullish in daily time frame, green line will be marked in H1 time frame as for buy zone. And when candles move down near or cut cross over the green line (we call it: action moment), it is recommended that we should long and make a stoploss at price of the white line (white line in this situation is beneath the green line). I can take profit whenever I have time to watch chart.
* When I miss an action moment, i will need to wait until the next action moments appear and make an entry (or many) then rapidly make an trailing exit with white line value (price) reducing risk
The strategy works fine
Скрипт с ограниченным доступом
Доступ к этому скрипту разрешён только для пользователей, авторизованных автором, и для этого обычно требуется оплата. Вы можете добавить скрипт в список избранных, но использовать его можно будет только после запроса на доступ и получения разрешения от автора. Свяжитесь с muzikalink, чтобы узнать больше, или следуйте инструкциям автора ниже.
TradingView не советует платить за скрипт и использовать его, если вы на 100% не доверяете его автору и не понимаете, как он работает. Часто вы можете найти хорошую альтернативу с открытым исходным кодом бесплатно в нашем разделе Скрипты сообщества.
Инструкции от автора
″Not ready to earth contact !
Хотите использовать этот скрипт на графике?
Внимание: прочтите это перед тем, как запросить доступ.
Отказ от ответственности
Все виды контента, которые вы можете увидеть на TradingView, не являются финансовыми, инвестиционными, торговыми или любыми другими рекомендациями. Мы не предоставляем советы по покупке и продаже активов. Подробнее — в Условиях использования TradingView.