INVITE-ONLY SCRIPT
MTF RSI VWAP Directional-Bias Barcolor [Intromoto]

Hey traders.
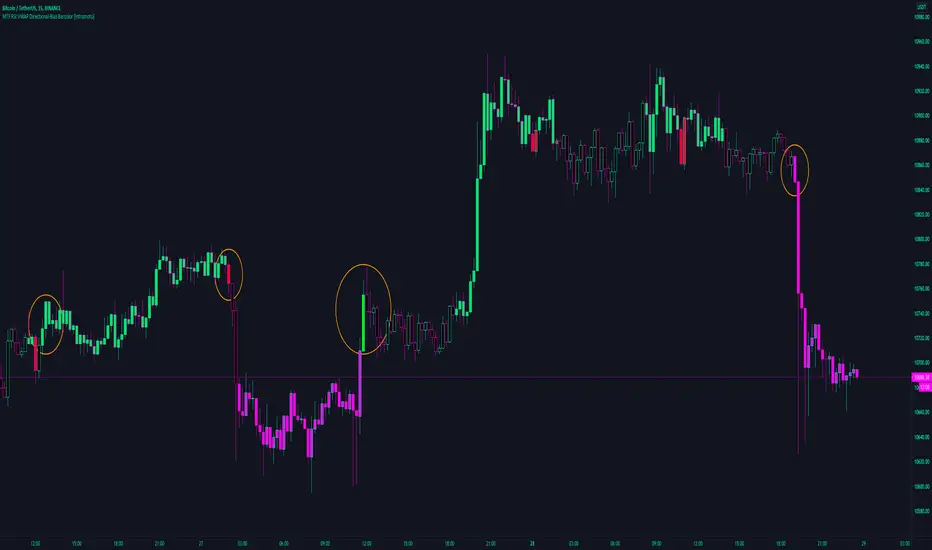
This indicator displays one of five barcolors, whether the multi-timeframe VWAP RSI set , variable by user, are above or below the 50% midline of the standard normalized oscillator.
The standard resolutions I've set as default:
1 minute
3 minute
5 minute
15 minute
These can be changed, but this is designed for low time-frame [15 minutes suggested] and if increased you'll likely not get signals as useful.
RSI VWAP functions similarly to the standard RSI but takes volume-weighted price into the calculation. VwapRSI = rsi(vwap(close), length).
The barcoloring indicates as follows:
Red: Start downtrend - Long exit
vwapRSI1< 50, vwapRSI2 > 50, vwapRSI3 >50, vwapRSI4 >50
Dull Green: Start-mid uptrend - buy/long continuation
All vwapRSI above 50
Pink: Mid-end downtrend - sell/short continuation
All vwapRSI below 50
Bright Green: New Uptrend attempt - Long entry
vwapRSI1> 50, vwapRSI2 > 50, vwapRSI3 >50, vwapRSI4 >50
Black: Chop / weak trend
Null / Differing combination of above and below - no clear trade. Black often shows when momentum is low.
This should be used with other factors like market structure and in confluence with other indicators. Be aware and avoid barcolor divergence to the trend, especially considering use on lower time frames. i.e Green bars that start at a peak and travel downwards.
Focus should be given to candle border/wick color and the barcolor. i.e Down red candle with red or pink barcolor.
Feel free to experiment with the MTF function, as it likely differs across assets and time frames. [This script is experimental]
PM me for access.
Скрипт с ограниченным доступом
Доступ к этому скрипту разрешён только для пользователей, авторизованных автором, и для этого обычно требуется оплата. Вы можете добавить скрипт в список избранных, но использовать его можно будет только после запроса на доступ и получения разрешения от автора. Свяжитесь с Intromoto, чтобы узнать больше, или следуйте инструкциям автора ниже.
TradingView не советует платить за скрипт и использовать его, если вы на 100% не доверяете его автору и не понимаете, как он работает. Часто вы можете найти хорошую альтернативу с открытым исходным кодом бесплатно в нашем разделе Скрипты сообщества.
Инструкции от автора
″
Хотите использовать этот скрипт на графике?
Внимание: прочтите это перед тем, как запросить доступ.
DM for access.
Follow on Twitter for updates.
One time fee, no subscription
twitter.com/IntroMoto
Follow on Twitter for updates.
One time fee, no subscription
twitter.com/IntroMoto
Отказ от ответственности
Все виды контента, которые вы можете увидеть на TradingView, не являются финансовыми, инвестиционными, торговыми или любыми другими рекомендациями. Мы не предоставляем советы по покупке и продаже активов. Подробнее — в Условиях использования TradingView.