Roc & Atr
Roc & Atr Orders
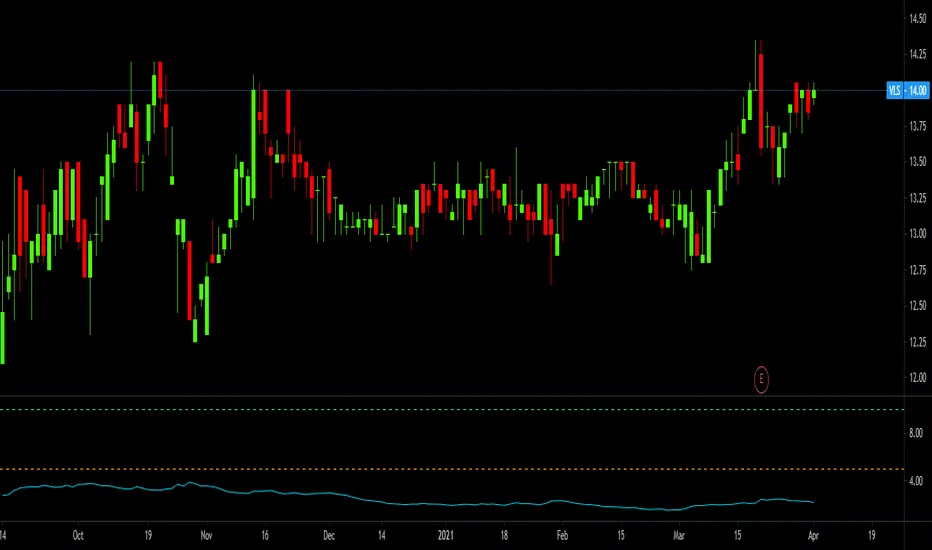
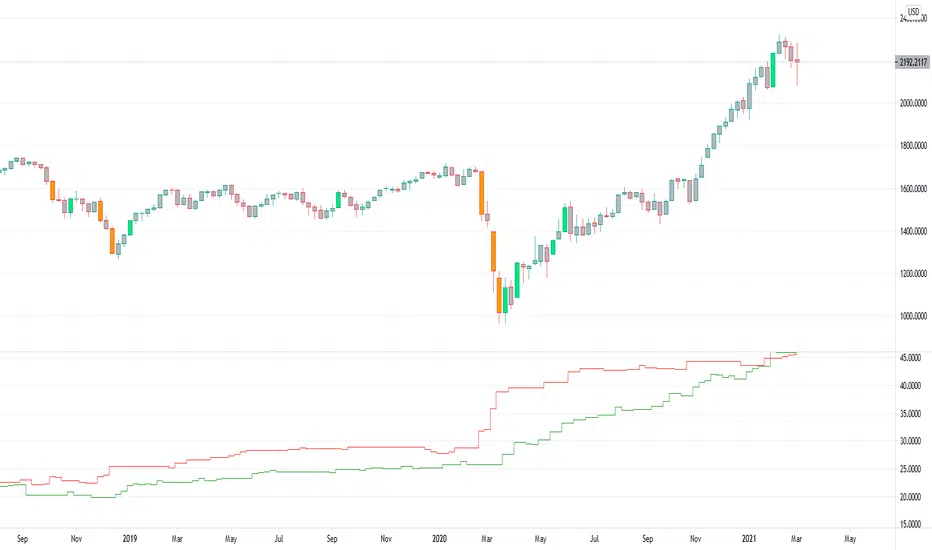
My indicator, where I compare the 20 bar change percentage with the 14 bar atr band, I hope it will be useful to everyone. the green zones can be interpreted as BUY and the red zone as SELL zone. In graphs with high motion and low atr, the channel narrowing can be interpreted as BUY and the channel opening as SELL.
No indicator shows you the right way ... The best way is your own thoughts
ATR

Trending/RangingThis script is a useful tool to use to identify the current market. It includes three other indicators:
1. ATR (combined with a SMA of the ATR)
2. ADX
3. RSI
It allows you to filter for when the market is trending vs. when the market is ranging by using any of the three indicators. You can also combine them to find extremely good trends to trade, or if you're a channel trader, identify when you wouldn't want to trade. This indicator also includes a time frame setting to allow you to ZOOM OUT and explore the long term trend of the security you are trading. I highly recommend using this indicator as a filter for when you enter a trade or not depending on the system you like to trade.

Advanced Average True RangeThis indicator allows you to improve your stop loss placement. It displays two lines based on the ATR ( Average True Range ), an upper line based on the current price + ATR and a lower line based on the current price - ATR. The ATR is multiplied by 2 but you can change this in the indicator settings.

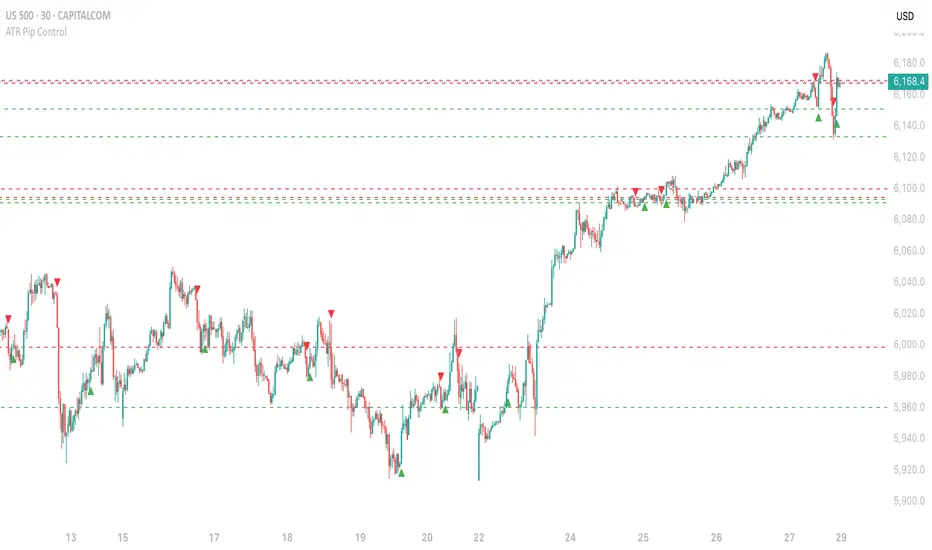
ATR Pip Control█ OVERVIEW
Here is a script based on the ATR but which unlike the traditional ATR using a Multiplier, here we use a signal filter by the Exchange of Prices
between Ticks. The more you increase the value, the more the parasitic signals will be filtered.
█ HOW TO INTERPRET?
• The signals are represented on the chart by "Buy" (Green) and "Sell" (Red) Labels.
• Pip Channel Control : Filters ATR Signals by the Exchange of Prices between Ticks. 0 = Disabled.
• Pip Length : Length of the Pip Channel. Depending on the Markets, the value can differ from 2 to 20 for Futures, Forex, CFD...
(But can go up to 5000 or more for Cryptos.) 0 = Disabled.
• Local High/Low : Local High/Low lines can be used as Stop Loss/Take Profit Zone.
• you have the option to display or not the Unconfirmed Signals on the Chart.
(They will also be displayed with "Buy" and "Sell" Labels but being transparent).
• The indicator works on all Timeframes and all types of markets.
• NO THE INDICATOR DOESN'T REPAINT.
█ ALERTS
Here is the list of Alerts available :
•ATR Buy (Unconfirmed)
•ATR Buy Condition!
•ATR Sell (Unconfirmed)
•ATR Sell Condition!
Please note that it is essential to always choose "Once per bar" (and NOT the "Once per bar close"!) option
whenever you want to place an Alert.
ATR with EOM and VORTEXThis is a strategy, designed for long trends for stock and crypto market.
Its made of ATR for volatility, EOM for volume and VORTEX for the trend direction.
In this case on the ATR, I applied an EMA to check if current position is above the EMA -> bull trend, below ema -> bear trend
For EOM I am using the positive and negative value scale, if its positive we are in a bull movement, otherwise a bear movement.
Lastly for VORTEX, I took the min and max, and made an average, after that I am using the average and compare it with 1 value. Above 1 -> bull, belowe 1-> bear.
This strategy only goes long.
If you have any questions, let me know.

ATR For Stop Loss (Overlay)This script is an enhancement of ATR Indicator.
It is used to determine the stop loss position by using the ATR indicator, in conjunction with the low of the candle.
Formula = Stop Loss = Lowest(Lowest Length) - (ATR Multiplier * ATR (Smoothing, Length))
However, the user needs to manually identify the swing low for a better stop loss placement.
Parameter Information :
- Length : Period to calculate the average true range.
- Smoothing : The method used for averaging.
- ATR Multiplier : Multiplier factor to determine the Stop Loss from the lowest reference point. (1 ATR Multiplier means the stop loss would be = Low - ATR)
- Lowest Length : A total number of candle to determine the lowest reference point. (1 means only using the latest candle's low as a lowest reference point)
Have fun and good luck!
Trend Surfers - Premium Breakout + AlertsTrend Surfers - Premium Breakout Strategy with Alerts
I am happy today to release the first free Trend Surfers complete Breakout Strategy!
The strategy includes:
Entry for Long and Short
Stoploss
Position Size
Exit Signal
Risk Management Feature
How the strategy works
This is a Trend Following strategy. The strategy will have drawdowns, but they will be way smaller than what you would go through with buy and old.
As a Trend Following strategy, we will buy on strength, when a breakout occurs. And sell on weakness.
The strategy includes a FIX Stoploss determined by an ATR multiple and a trailing Stoploss/Takeprofit also determined by an ATR multiple.
You can also manage your risk by entering the maximum % you are willing to risk on every trade. Additionally, there is an option to enter how many pairs you will be trading with the strategy. This will change your position size in order to make sure that you have enough funds to trade all your favorite pairs.
Use the strategy with alerts
This strategy is alert-ready. All you have to do is:
Go on a pair you would like to trade
Create an alert
Select the strategy as a Trigger
Wait for new orders to be sent to you
Every Entry (Long/Short) will include:
Market Entry (Enter position NOW!)
Stoploss price
Position Size
Leverage
* If you do not wish to use leverage, you can multiply the Position Size by the Leverage. But doing that, you might end up with a position greater than your equity. Trading on Futures is better in order to have accurate risk management.
Exit signals:
When you receive an exit signal, you need to close the position ASAP. If you want to keep your results as close as possible to the backtest results, you need to execute quickly and follow what the strategy is telling you.
Do not try to outsmart the strategy
Leave your emotion out of trading! If you trust the strategy, you will have way better returns than if you try to outsmart it. Follow each signal you receive even if it doesn't seem logical at the moment.
Become a machine that executes. Don't look at fundamentals. Follow the trend! Trust the strategy!
I hope you enjoy it!

ATR PercentAverage True Range in Percent to price
- 2 customizable horizontal line: to be used as custom levels.
ATR SL/TPThis indicator uses the ATR to give areas where the user might want to take profit or set a stop loss.

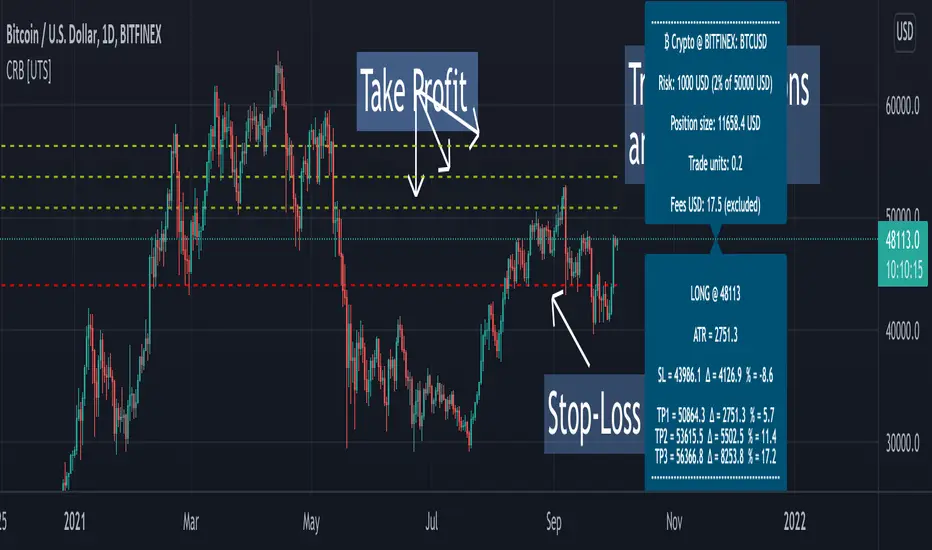
Crypto Risk Buddy: Position Size, SL & TP System [UTS]
Crypto Risk Buddy
Position Size, Stop Loss & Take Profit System
The ultimate system to calculate trading risk on crypto assets.
₿ Cyptocurrencies
Position Sizing
De-risk possible drawdown by calculating a proper position size.
Define your risk percent based on your net value
Freely define your account currency
Trade any asset by the customizable Base / Quote currency factor
Calculate trading fees
Show all information on a customizable data screen
Stop Loss
Minimize trade risk by calculatig your stop-loss.
Percent, Value and Delta display from current price
ATR based (Average True Range, modifiable)
Custom SL value possible
Adjustable
Two visual representations on chart
Automatically and real-time calculated on screen
Take Profit
Multiple take-profit levels to ensure not giving back to the market.
Up to 3 take profit levels to define
ATR based (Average True Range, modifiable)
Custom TP values possible
Easily customizable
Two visual representations on chart
Automatically and real-time calculated on screen
Currencies
Choose an account currency and calculate your risk for every trading pair.
USD
EUR
GBP
AUD
CAD
CHF
HKD
JPY
NOK
NZD
RUB
SEK
SGD
TRY
ZAR
BTC (crypto)
ETH (crypto)
USDT (crypto)
BUSD (crypto)
USDC (crypto)
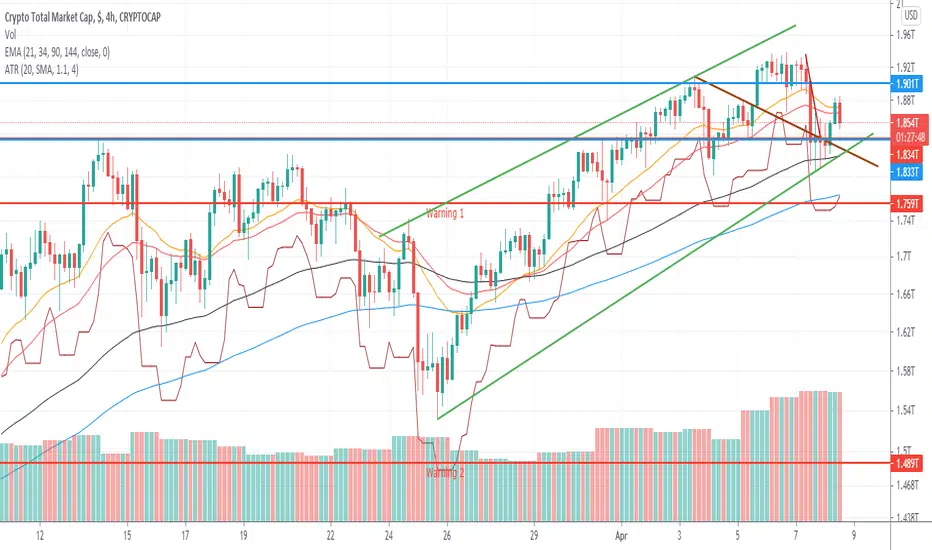
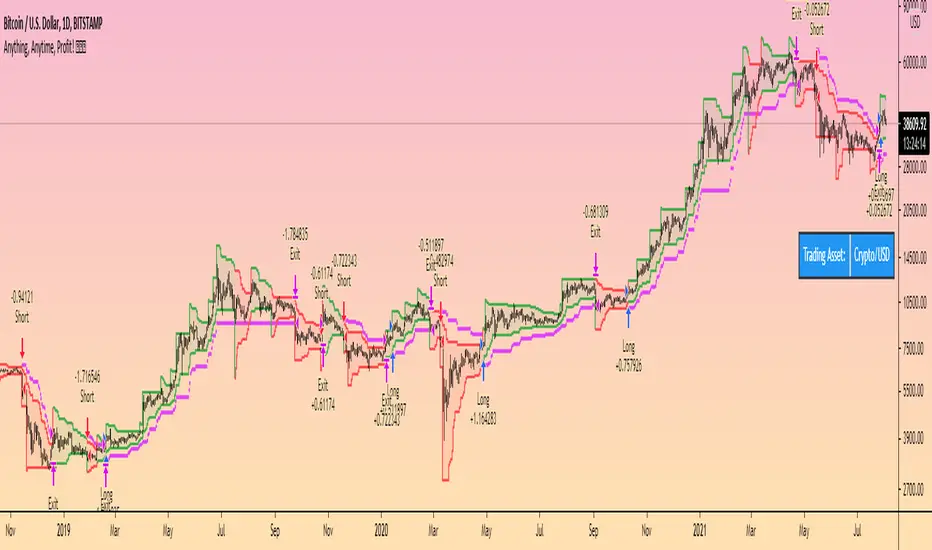
Bull Market Trend Following StrategyThis Bull Market Trend Following Strategy is perfect for long or short term Crypto or traditional market trading and investing.
It is based mainly on the ATR indicator and will therefore adapt to any market conditions and volatility.
It has a number of variable options to try and maximise gains, including stop loss and take profit points, and the ability to wait for pullbacks.
Please let me know if you find any optimal settings, and don't hesitate to ask any questions I'm always happy to help.
Thanks a lot.
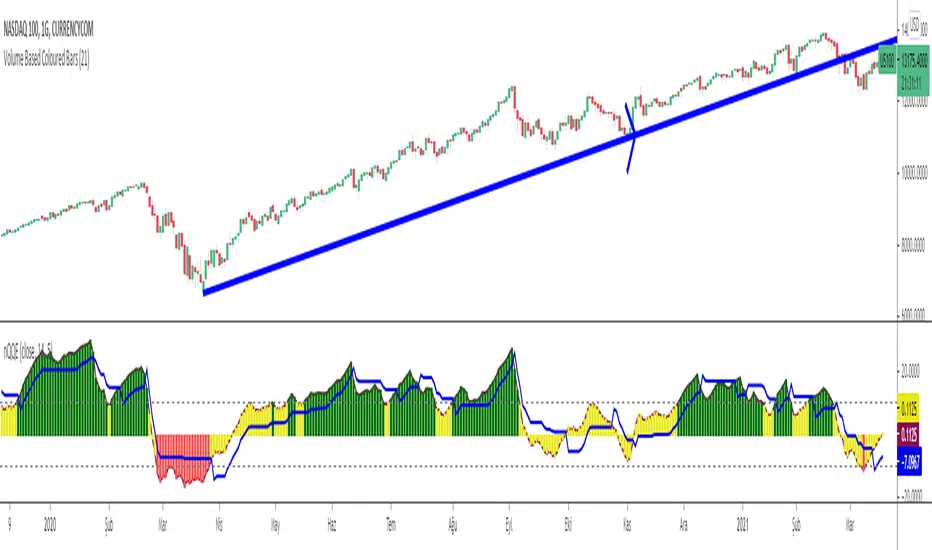
Normalized Quantitative Qualitative Estimation nQQENormalized version of Quantitative Qualitative Estimation QQE:
Normalized QQE tries to overcome the problems of false signals due to RSI divergences on the original QQE indicator.
The main purpose is to determine and ride the trend as far as possible.
So users can identify:
UPTREND : when nQQE Histogram is GREEN (nQQE is above 10)
DOWNTREND : when nQQE Histogram is RED (nQQE is below -10)
SIDEWAYS: when nQQE Histogram is YELLOW (nQQE is between -10 and 10)
Calculation is very simple;
RSI based QQE oscillates between 0-100
nQQE is simply calculated as:
nQQE=QQE-50
to make the indicator fluctuate around 0 level to get more accurate signals.
Various alarms added.
Kıvanç Özbilgiç
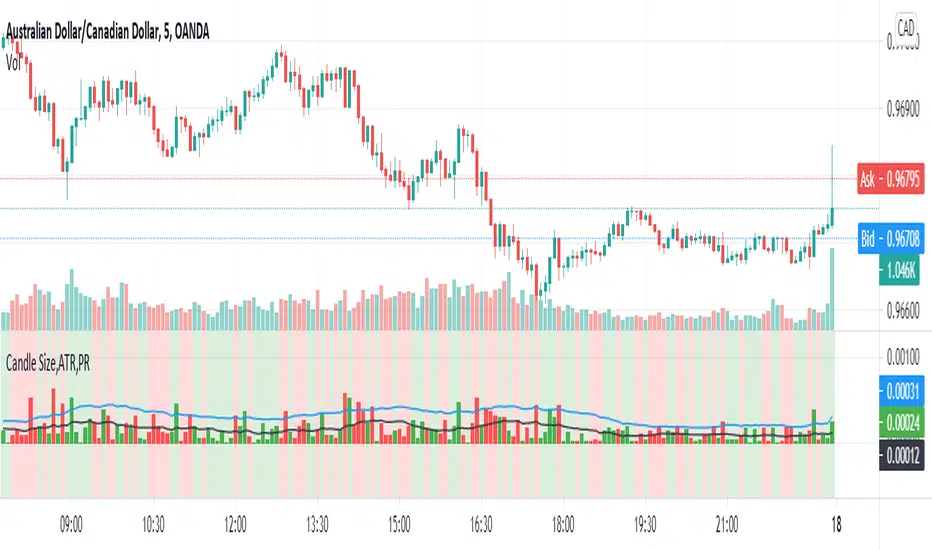
ATR% with Compression by UJBPlot ATR% along with selected compression horizontal line. Bar color changes when inside specified value.

Up-Down RangeHere is an attempt to segregate ATR into ATR of up days and down days.
While setting trailing stops based on ATR, you probably need to consider more on how an instrument can drop during red days. Hence, ATR of only red days makes more compelling case than overall ATR. Another use case for this kind of indicator may be in options if you are selling puts and calls with the intent of pocketing premiums on expiry.
Parameters are as explained below:
Range Type : Different range types are tr (True Range) , close (difference between close prices), highlow (difference between high and low of candle)
Period : ATR Period
Moving Average Type : Moving Average Type for calculating ATR. Two additional types - min and max are added which calculates lowest and highest range in last n bars
HideFullAtr : Hides combined ATR if checked.
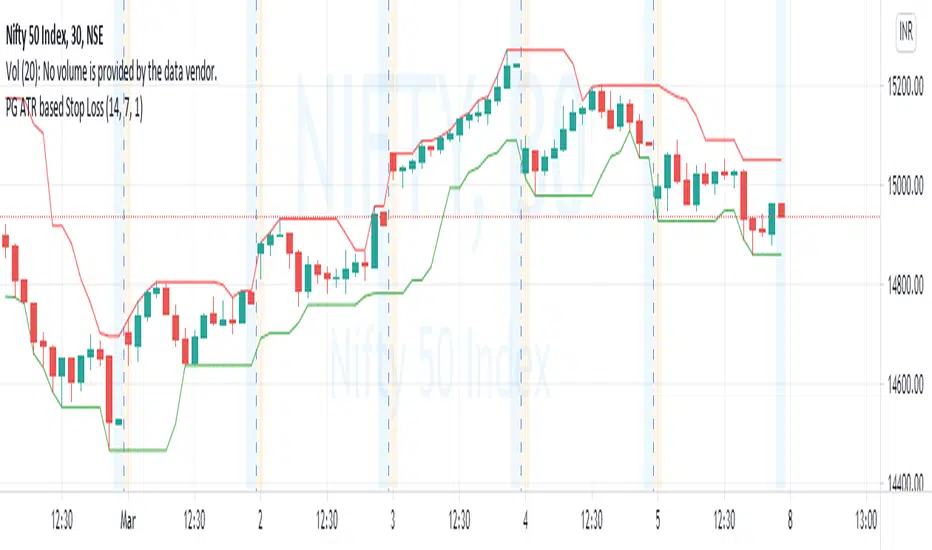
PG ATR based Stop LossA stoploss system that enables traders to exit with limited loss or even trailing loss.
Use the levels of indicator against the candle that has seen signidicant move for running positions and the candle in which a new position is taken.
Example : For long Nifty Future at 14990 levels, when Indicator is showing 14820 at bottom on a 30 min chart, 14820 can be used as a stop loss,
similarly for short conditions upper values above top of he candle will be followed.
For medium term ongoing positions, use the levels marked against candle that offered a major move, or the candles that has put the underlying in a new price zone or range.
15-30 minutes are suitable period for intraday / short term trades. Two hours or day periods can be used for positional trades.
**Queries are welcme.**
Risk Management: Position Size & Risk RewardHere is a Risk Management Indicator that calculates stop loss and position sizing based on the volatility of the stock. Most traders use a basic 1 or 2% Risk Rule, where they will not risk more than 1 or 2% of their capital on any one trade. I went further and applied four levels of risk: 0.25%, 0.50%, 1% and 2%. How you apply these different levels of risk is what makes this indicator extremely useful. Here are some common ways to apply this script:
• If the stock is extremely volatile and has a better than 50% chance of hitting the stop loss, then risk only 0.25% of your capital on that trade.
• If a stock has low volatility and has less than 20% change of hitting the stop loss, then risk 2% of your capital on that trade.
• Risking anywhere between 0.25% and 2% is purely based on your intuition and assessment of the market.
• If you are on a losing streak and you want to cut back on your position sizing, then lowering the Risk % can help you weather the storm.
• If you are on a winning streak and your entries are experiencing a higher level of success, then gradually increase the Risk % to reap bigger profits.
• If you want to trade outside the noise of the market or take on more noise/risk, you can adjust the ATR Factor.
• … and whatever else you can imagine using it to benefit your trading.
The position size is calculated using the Capital and Risk % fields, which is the percentage of your total trading capital (a.k.a net liquidity or Capital at Risk). If you instead want to calculate the position size based on a specific amount of money, then enter the amount in the Custom Risk Amt input box. Any amount greater than 0 in the Custom Risk Amt field will override the values in the Capital and Risk % fields.
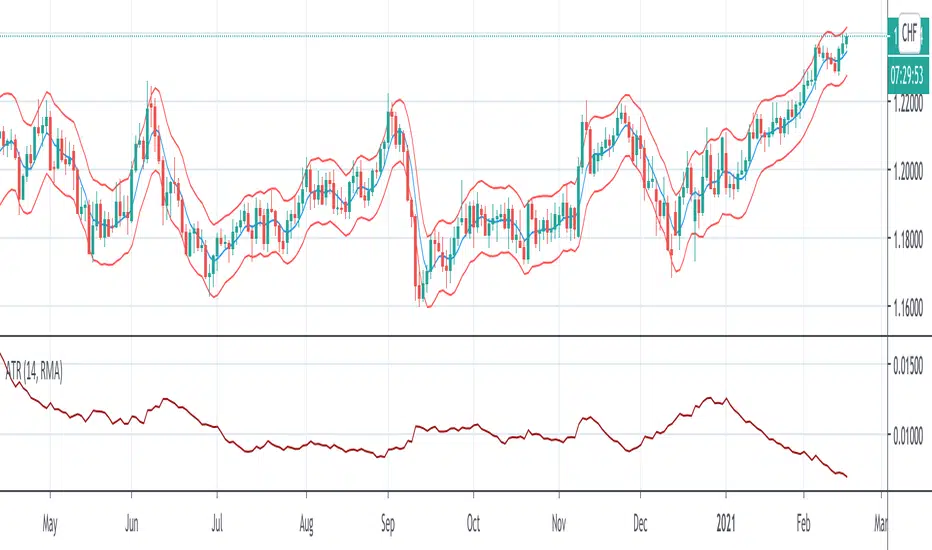
The stop loss is calculated by using the ATR. The default setting is the 14 RMA, but you can change the length and smoothing of the true range moving average to your liking. Selecting a different length and smoothing affects the stop loss and position size, so choose these values very carefully.
The ATR Factor is a multiplier of the ATR. The ATR Factor can be used to adjust the stop loss and move it outside of the market noise. For the more volatile stock, increase the factor to lower the stop loss and reduce the chance of getting stopped out. For stocks with less volatility , you can lower the factor to raise the stop loss and increase position size. Adjusting the ATR Factor can also be useful when you want the stop loss to be at or below key levels of support.
The Market Session is the hours the market is open. The Market Session only affects the Opening Range Breakout (ORB) option, so it’s important to change these values if you’re trading the ORB and you’re outside of Eastern Standard Time or you’re trading in a foreign exchange.
The ORB is a bonus to the script. When enabled, the indicator will only appear in the first green candle of the day (09:30:00 or 09:30 AM EST or the start time specified in Market Session). When using the ORB, the stop loss is based on the spread of the first candle at the Open. The spread is the difference between the High and Low of the green candle. On 1-day or higher timeframes, the indicator will be the spread of the last (or current) candle.
The output of the indicator is a label overlaying the chart:
1. ATR (14 RMA x2) – This indicated that the stop loss is determined by the ATR. The x2 is the ATR Factor. If ORB is selected, then the first line will show SPREAD, instead of ATR.
2. Capital – This is your total capital or capital at risk.
3. Risk X% of Capital – The amount you’re risking on a % of the Capital. If a Custom Risk Amt is entered, then Risk Amount will be shown in place of Capital and Risk % of Capital.
4. Entry – The current price.
5. Stop Loss – The stop loss price.
6. -1R – The stop loss price and the amount that will be lost of the stop loss is hit.
7. – These are the target prices, or levels where you will want to take profit.
This script is primarily meant for people who are new to active trading and who are looking for a sound risk management strategy based on market volatility . This script can also be used by the more experienced trader who is using a similar system, but also wants to see it applied as an indicator on TradingView. I’m looking forward to maintaining this script and making it better in future revisions. If you want to include or change anything you believe will be a good change or feature, then please contact me in TradingView.

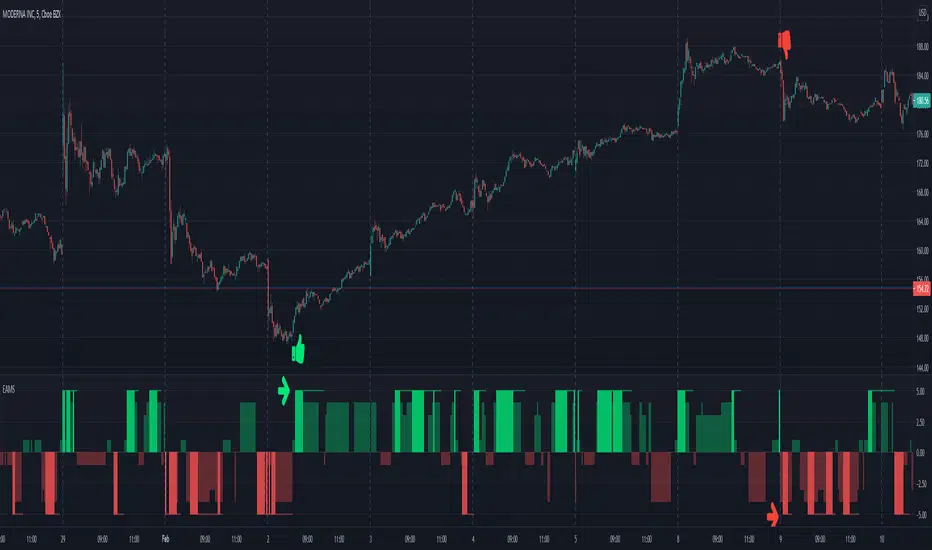
Electrified Aggressive Momentum SignalWhat this can be used for:
If you've already decided you want to trade a symbol, this can identify points of momentum alignment.
If a strong move has recently happened and you're looking for a change in momentum.
How it works:
This is a weighted combination of a Stochastic RSI and two modified SuperTrend (ATR Trailing Stop) indicators:
The Stochastic RSI signal is based upon aligned momentum and is negated at the overbought and oversold points.
The SuperTrend formula uses high and low values for calculation and both fast and slow can be adjusted for sensitivity.
Philosophy:
Signals have to be useful to humans. If a signal occurs to late, you've missed it. The intent of this indicator is to assist in timing a trade at very short time-frames. It assumes your conviction about a trade already exists, but you are trying to get an optimal entry.
Opposing momentum (weak signal) within an uptrend can be a sign that you should wait before entering. The frequency of a signal can indicate the strength of the trend. As the frequency of the aligned signal value decreases so does the reward vs risk.
ATR + %R Scalping StrategyThe Average True Range is a single line indicator that measures volatility. The indicator was originally developed by J. Welles Wilder to measure the volatility of commodities within the futures market.
ATR does not measure price trends or price direction hence %R and Parabolic SAR indicators were added.
The strategy enhances standard Average True Range and %R composition with trend confirmation and filters which clear out market noises and manipulations from triggers.
The strategy supports traditional and cryptocurrency spot, futures, options and marginal trading exchanges. It works accurately with BTC, USD, USDT, ETH and BNB quote currencies. Best to use with 5 and 15 minutes timeframe charts and Limit orders.
The strategy can be and should be configured for each particular asset. You can change filters and risk management settings to receive the most advanced accurate alerts
Advantages of this script:
Strategy has high profit factor around 30.32
Backtests show high accuracy around 91.18%
High Net Profit percentage
Low Drawdowns
Weak signals are filtered
Dynamic Take profit and Stop loss
Fast deals around 50 minutes per trade
Can be applied to any market and quote currency
Easy to configure user interface
How to use?
1. Apply strategy to the trading pair your are interested in at 5m or 15m timeframe chart
2. Configure the strategy: change filters values and risk management settings until Strategy tester shows good results according to mathematical expectation
3. Set up a TradingView alert to trigger when strategy conditions are met
4. Strategy will send alerts when to enter and when to exit positions

ATR Without OutliersIt is an ATR indicator which filters out outliers.
Outliers are values which are higher than the standard deviation of the true range.
It may be better than normal ATR for stop loss, because it does not keep large values after pump or dump.
It is very useful for high volatile markets like crypto markets.

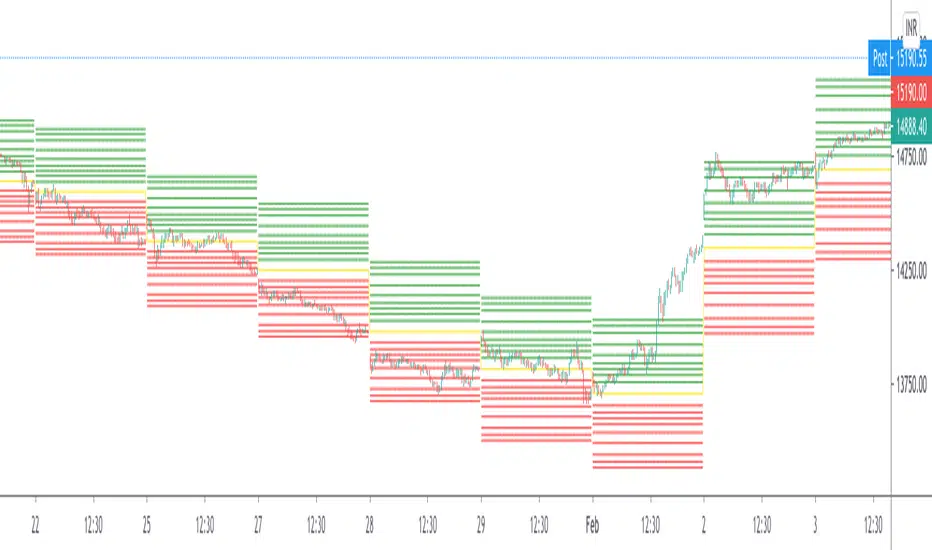
Rectangular ATR LevelsHelpful in forming Support resistance Judgements
Rectangular ATR Levels
is calculated using multipliers of the ATR value at the Previous Day's Close and plotting them on current day price movements as levels
Enjoy!
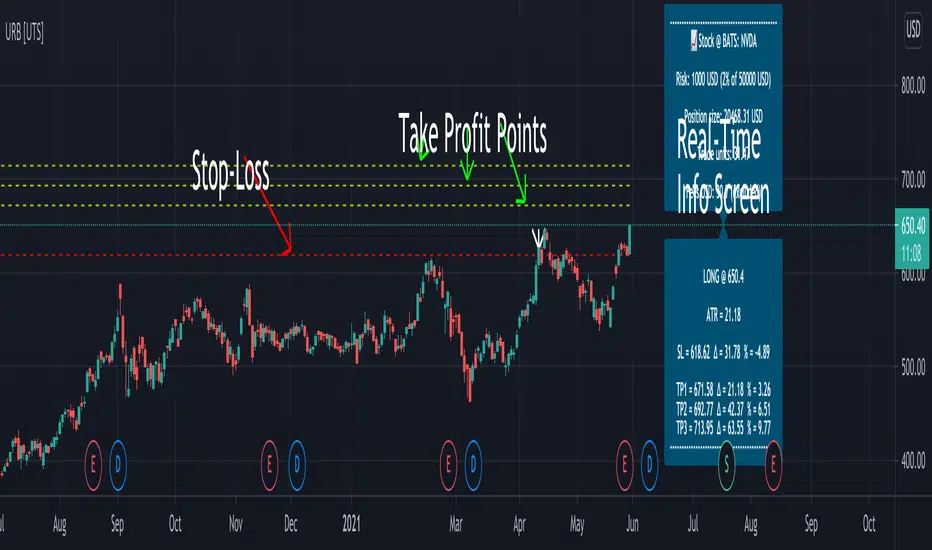
Uber Risk Buddy: Position Size, SL & TP System [UTS]
Uber Risk Buddy
Position Size, Stop Loss & Take Profit System
The ultimate system to calculate trading risk on any asset e.g.:
💰 Futures
₿ Cyptocurrencies
💵 Forex
📈 Stocks
📉 Fund
🗂️ Indices
Position Sizing
De-risk possible drawdown by calculating a proper position size:
Define your risk percent based on your net value
Freely define your account currency (Base currency)
Trade any asset by the customisable Base/ Quote currency factor
Optional trading fee calculation
Show all information on a customisable data screen
Stop Loss
Minimise trade risk by calculating your stop-loss:
Percent, Value and Delta display from current price
ATR based (Average True Range, modifiable)
Adjustable
Two visual representations on chart
Automatically and real-time calculated on screen
Take Profit
Multiple take-profit levels to ensure not giving back to the market.
Up to 3 take profit levels to define
ATR based (Average True Range, modifiable)
Easily customisable
Two visual representations on chart
Automatically and real-time calculated on screen
Indicator Access: 1 week trial available (DM for access)
Arnaud Legoux Moving Average With ATR BandsArnaud Legoux Moving Average With ATR Bands to get an idea of the volatility.