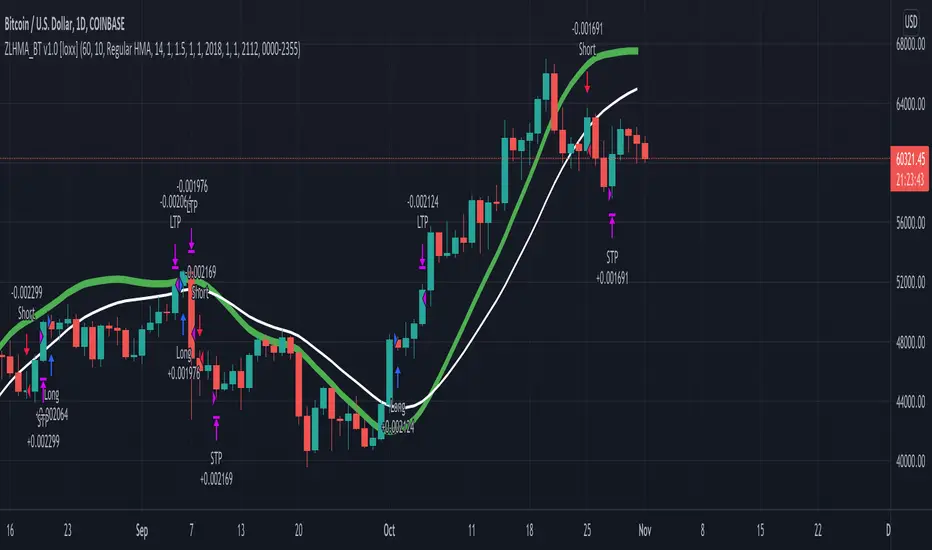
Zero-Lag HMA Backtest v1.0 [loxx]This backtest compares profitability differences between a regular Hull Moving Average ( HMA ) and a Zero-Lag HMA .
Things to know:
- Profit is set to 1 ATR
- Stop-loss is set to 1.5 ATR.
- This is by design to test the minimum the profit scenario (1 ATR up) and the worst case loss scenario (1.5 ATR down) for momentum trading. Actual results vary when additional TPs are added
How to use:
- Adjust settings and dates to view different market structures and position scenarios
- See results in the "Strategy Tester" pane
Conclusions and what's next
- Modifying HMA does very little to improve backtest results
- Future iterations will include options to backtest various moving averages with additional modifiers to improve profits and avoide losses
Comment below or send a PM with questions, comments, observations, or concerns.
ATR
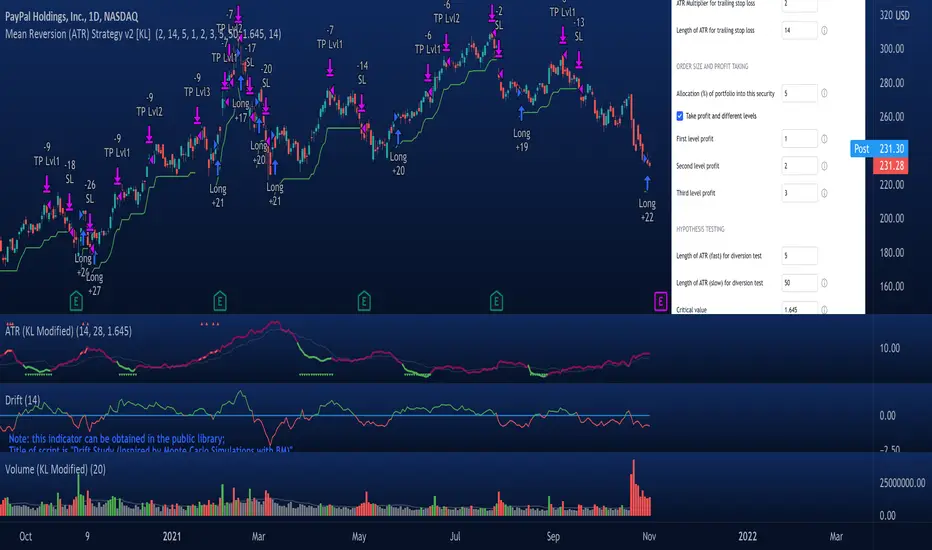
Mean Reversion Strategy v2 [KL]Description :
This strategy will enter a position when the following conditions are met:
a) Main signal: When source data (ATR) diverts from its moving average value, and
b) Confirmation: If predicted direction of trend is favorable.
Assumptions :
During periods of high price volatility, ATR diverts from its moving average value. Eventually, ATR should revert. But since just knowing the magnitude of increase/decrease of ATR does not indicate a trend signal, we need to introduce a model to predict the current trend.
In short:
• Trend Prediction : This strategy calculates the expected logarithmic return of the security (the "Drift") and considers prices to be moving in uptrend if the drift curve is upward sloping.
• Assessment of ATR diversion : To determine "yes/no" regarding whether ATR at a given point in time has diverted, this script conducts a two-tailed hypothesis test at each candlestick period. The null hypothesis (H0) is that the fast moving average value should equal the slow moving average value (say, denoted as H0: atr14 == atr28; it is assumed that atr28 is more meaningful for the purpose of describing the current trend because it has a larger sample size). Investopedia has an article summarizing this topic .
Exit Condition :
When trailing stop loss hits.
Previous version :
This strategy is based on Version 1 published back in September . This older version considers +/- one standard deviation to be the critical values relative to average ATR when testing whether ATR has diverted from the mean. This does not take Standard Error ("SE") into account. As a result, the threshold is often too wide and it generates too many entry signals.
Simple Ema_ATR Strategy HulkTradingSimple EMA strategy, based on ema55+ema21 and ATR(Average True Range) and it enters a deal from ema55 when the other entry conditions are met
Basically long and short conditions
If long:
1) close must be less than open (because we are searching for a pullback)
2) emaFast(21) must be bigger than emaSlow(55) - for a trend detection
3) Difference between emaFast and emaSlow must be greater than ATR(14) - for excluding flat
For short conditions are opposite
Stop levels and take profits, based on ATR multiplier.
You can change it in input field.
I recommended values between 1 and 4, not more.
This strategy was tested on pairs BTCUSDT and ETHUSDT and have a nice results.

TripleEMA + StochasticRSI + ATR Scalping Strategy by TradeSmartCOINBASE:BTCUSD Hello everyone and welcome to our second script release!
This script is one of many upcoming scripts. This one is a test for us, how it works, how you guys like this kind of stuff, and for feedback what we should change/improve at.
So feel free to comment any suggestions you have.
SCRIPT IS OPTIMIZED FOR:
BTC/USD (Coinbase) 15 minute timeframe
(Keep in mind default settings does not include trading fees, you can set it at the properties)
I recommend using this script on a trading exchange where the fees are extremely low or on an exchange where you get paid to place limit orders.
(I am not a financial avdvisor and none of this is financial advice.)
Now you can modify the following:
Stochastic RSI
3 different EMA
Length of ATR (for stop loss and take profit)
Stop Loss and Take Profit Risk to Reward ratio
Choice between Capital Risk on each trade or Risk of % of Capital
Allowing Short/Long entries only
Limit between dates
Trading days 1-7
We will update the script with more and more features taking in consideration your requests.
Hope you like it! Don't forget to let us know what we should change or improve. Thanks, and have a great day!
STRATEGY ENTRY RULES
LONG
When EMAs are lining up (meaning for ex. 400 < 13 < 7), and the Stochastic RSI crosses upwards (meaning blue line crosses orange upwards), then go long.
SHORT
When EMAs are lining down (meaning for ex. 7 < 13 < 400), and the Stochastic RSI crosses downwards (meaning blue line crosses orange downwards), then go short.
TAKE PROFIT
When price hits the exit price (calculated from stop loss with the risk ratio)
STOP LOSS
When price hits stop loss then exit the position.
QUANTITY TO BUY (Risk per Trade % or Capital %)
Risk Per Trade % attribute: we can set how much money we want to risk on one trade. Meaning that if we lose that particular position, then a Risk Per Trade % value of our equity will be lost.
Example: if you set the Risk Per Trade % to 1 % and you have a 100$ account balance, then if you loose the trade you will loose 1$ max.
Capital % we can set with how big % of our capital we want to enter into a position. Meaning that we enter with a set % of our capital.
Example: if you set the Capital % to 1 % and you have a 100$ account balance, then you will enter the position with 1$.
First Release Settings: (2021-10-25) for BTC/USD (Coinbase) 15 minute timeframe
Stochastic RSI settings: (Not displayed in the script. If you want to see it you have to add it separately.)
K: 3
D: 2
RSI Length: 6
Stochastic Length: 16
RSI Source: hlc3
EMA 1: 5
Source One: Close
EMA 2: 12
Source Two: Close
EMA 3: 215
Source Three: Close
Length of ATR: 16
Stop Loss Multiplier (risk): 3.6
Exit Price Multiplier (reward): 1
Risk Percentage: 3
Allow Long Entries: yes
Allow Short Entries: yes
Valid Trading Days: 1234567
The valid trading days of the Limit Trading Time feature. Numbers represent the days: Sunday (1), Monday (2), Tuesday (3), …, Saturday (7)
If you like this one, follow for more scripts! Thank you for your support!

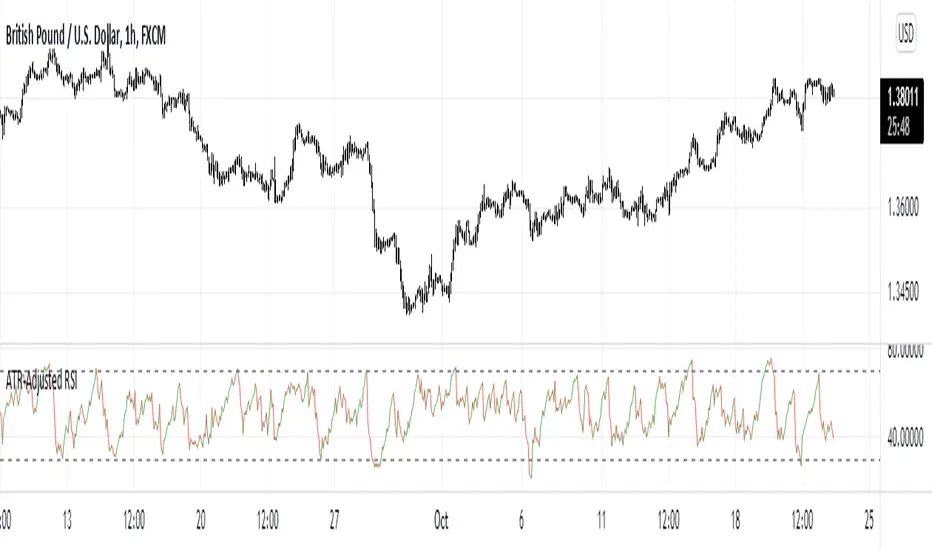
ATR-Adjusted RSIThis indicator adjusts the RSI values using the Average True Range. It is used the same way as a normal RSI.
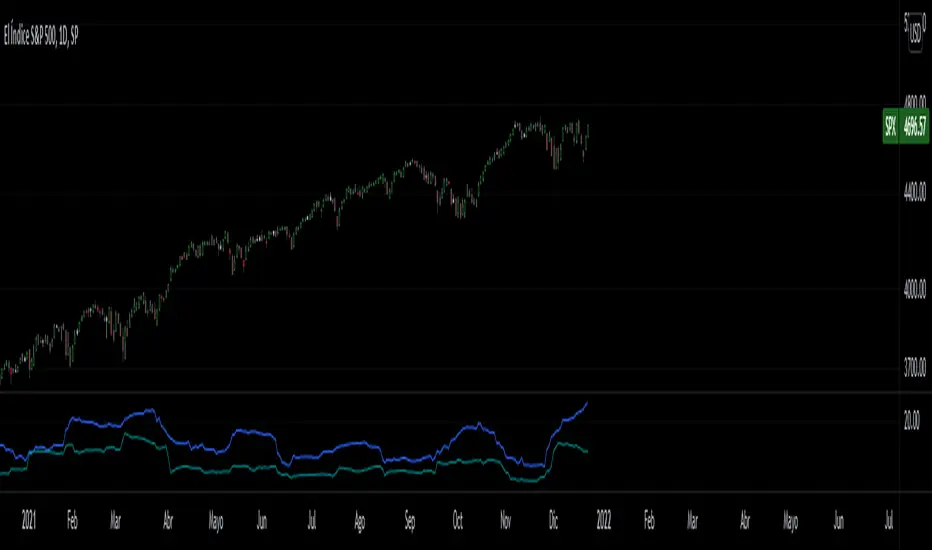
Historical Volatility Close to Close VS High to LowClose to Close Volatility VS high to low, to evaluate volatility regimes.
Both are Volatilities of 40 periods (Modifiable), calculated on 252 days (Average trading days in the American market) (Also modifiable in the case of cryptocurrency analysis).
The Moving Average is a 20 periods (Modifiable) Simple Moving Average of the average of both volatilities.
Blue = Close to Close Volatility
Green = High to Low Volatility
Orange = Moving Average
Volatilidad Close to Close VS High to Low, para evaluar regimenes de volatilidad historica.
Ambas son Volatilidades de 40 periodos (Modificable), calculadas sobre 252 dias (Promedio de dias operables en el mercado americano)(Tambien modificable para el caso de analisis de criptomonedas).
La Media movil, es una media movil Simple de 20 periodos del promedio de ambas volatilidades.
Azul = Volatilidad Close to Close
Verde = Volatilidad High to low
Naranja = Media Movil
Day Trading SPYThis script can be used to see a potential trend change, ride a trend and to scalp following the current trend.
Indicators:
- ATR (bright green/maroon) – is a longer term trend ATR line
- MA (green/red) - is a shorter term MA, where the fast MA is dotted and the long MA is a line
- Support and Resistance (white bold line) – long-term support and resistance areas
- Scalping signals (red/green) – small triangles above/below the candles bouncing off fast MA
- Black candles - oversized huge candles, which must be addressed carefully, especially when these candles change the trend per ATR, as with such huge candle – it is hard to determine where to place the stop-loss (if it is above/below the candle, since the candle is so big - it becomes a big risk). Also such candles may point to an unusual market moves. The size can be adjusted from 0.1 and up, it’s set to 1.4 by default, but it can be changed as needed. With such candles, it is best to wait and see what market does. If the black candle is following the ATR trend or changing the trend per ATR – wait for next 1-3 candles or so, usually those re-bounce in the opposite direction of the ATR trend, which allows you to open the position with a tighter stop-loss.
- Olive and Maroon candles – overbought and oversold candles per RSI (80/15 default) levels. At this levels just watch out for a potential soon reversal. Keep in mind, price may continue going oversold/overbought for a while, so look for additional confirmations.
1) ATR (long-term trend): The flag “Buy” and “Sell” signals (can set Alerts), which happens when the price is crossing through ATR line, marking a potential trend change. If ATR matches MA and ideally there is a breakout - open position in the direction of the signal and use the ATR line as your initial hard stop-loss until you reach the first price target / take first profit. It is best to use the most recent high/low pivot or a Fibonacci extension for the first price target. Once you take it – move SL to entry to secure the profits. If the trend continues and you take the next price target, you can use the fastMA (dotted line) as your dynamic stop-loss to ride the trend. Use the bold white line (long-term support and resistance) where price may certainly reverse where you can close your position completely if you day-trading Options.
2) MA (scalping): The small green and red triangles below/above the bars (can set Alerts), which appear when the price “touches” the fast MA (dotted line) and re-bounces from it with the candle matching the direction (bullish/bearish). Make sure ATR and MA are both going in the same direction for best results. This can be used to scalp for small profits or to jump into the trend. To minimize the risk, since you are jumping into the trend, I suggest placing your stop-loss slightly above/below the candle (the one which bounced off the fast MA). Price targets are similar – most recent high/low pivot or a Fibonacci extension. Same way, once you take the first profit/reach the first price target, move SL to entry and on the next price target – use the fast MA as your dynamic stop-loss.
If you don’t know how to divide up your position - here is an example on how I take profits between the price targets:
- Open position with buying a multiple of x4 contracts
- Sell ½ of the position at first price target and move my SL to entry
- Sell ½ of the remaining position at a second price target
- Sell the rest of the position at the third price target or sell ½ of it and use the fast MA as my dynamic stop-loss for the remaining of the position
Also, keep an eye on the breakouts, especially if they go along the ATR and MA trend and keep an eye on the volume, which may help confirming the direction of the price.

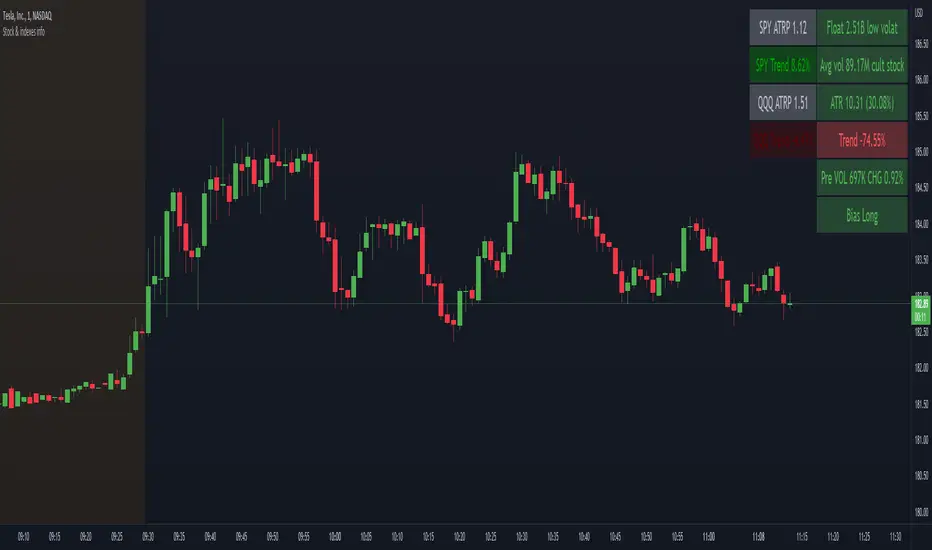
Stock float, avg volume, pre-market info and indexes atrp, trendNASDAQ:AAPL
This indicator shows the most usefull informations about the current symbol and the two common indexes (SPY and QQQ) in a table, in the upper right corner of the graph.
The informations are:
Symbol
Float
Daily average volume
Average True Range
Pre-market volume
Pre-market change %
Indexes
SPY ATRP
SPY trend (this value indicates how much the symbol is changing from the last X bars of Y minues. Higher values means a stronger trend)
QQQ ATRP
QQQ trend (same as SPY trend)
The indicator is highly customizable. Here are some of the settings:
Compact view
Text size
Every information is hidable
Most of the informations have customizable warning
Background color with thresholds
Period/lenght of the indicators
MACD PlusMoving Average Convergence Divergence – MACD
The MACD is an extremely popular indicator used in technical analysis. It can be used to identify aspects of a security's overall trend. Most notably these aspects are momentum, as well as trend direction and duration. What makes the MACD so informative is that it is actually the combination of two different types of indicators. First, the MACD employs two Moving Averages of varying lengths (which are lagging indicators) to identify trend direction and duration. Then, it takes the difference in values between those two Moving Averages (MACD Line) and an EMA of those Moving Averages (Signal Line) and plots that difference between the two lines as a histogram which oscillates above and below a center Zero Line. The histogram is used as a good indication of a security's momentum.
Added Color Plots to Settings Pane.
Switched MTF Logic to turn ON/OFF automatically w/ TradingView's Built in Feature.
Added Ability to Turn ON/OFF Show MacD & Signal Line.
Added Ability to Turn ON/OFF Show Histogram.
Added Ability to Change MACD Line Colors Based on Trend.
Added Ability to Highlight Price Bars Based on Trend.
Added Alerts to Settings Pane.
Customized Alerts to Show Symbol, TimeFrame, Closing Price, MACD Crosses Up & MACD Crosses Down Signals in Alert.
Alerts are Pre-Set to only Alert on Bar Close.
Added ability to show Dots when MACD Crosses.
Added Ability to Change Plot Widths in Settings Pane.
Added in Alert Feature where Cross Up if above 0 or cross down if below 0 (OFF By Default).
Squeeze Pro
Traditionally, John Carter's version uses 20 period SMAs as the basis lines on both the BB and the KC.
In this version, I've given the freedom to change this and try out different types of moving averages.
The original squeeze indicator had only one Squeeze setting, though this new one has three.
The gray dot Squeeze, call it a "low squeeze" or an "early squeeze" - this is the easiest Squeeze to form based on its settings.
The orange dot Squeeze is the original from the first Squeeze indicator.
And finally, the yellow dot squeeze, call it a "high squeeze" or "power squeeze" - is the most difficult to form and suggests price is under extreme levels of compression.
Colored Directional Movement Index (CDMI) , a custom interpretation of J. Welles Wilder’s Directional Movement Index (DMI), where :
DMI is a collection of three separate indicators ( ADX , +DI , -DI ) combined into one and measures the trend’s strength as well as its direction
CDMI is a custom interpretation of DMI which presents ( ADX , +DI , -DI ) with a color scale - representing the trend’s strength, color density - representing momentum/slope of the trend’s strength, and triangle up/down shapes - representing the trend’s direction. CDMI provides all the information in a single line with colored triangle shapes plotted on the bottom. DMI can provide quality information and even trading signals but it is not an easy indicator to master, whereus CDMI simplifies its usage. The CDMI adds additional insight of verifying/confirming the trend as well as its strength
Label :
Displaying the trend strength and direction
Displaying adx and di+/di- values
Displaying adx's momentum (growing or falling)
Where tooltip label describes "howto read colored dmi line"
Ability to display historical values of DMI readings displayed in the label.
Added "Expert Trend Locator - XTL"
The XTL was developed by Tom Joseph (in his book Applying Technical Analysis ) to identify major trends, similar to Elliott Wave 3 type swings.
Blue bars are bullish and indicate a potential upwards impulse.
Red bars are bearish and indicate a potential downwards impulse.
White bars indicate no trend is detected at the moment.
Added "Williams Vix Fix" signal. The Vix is one of the most reliable indicators in history for finding market bottoms. The Williams Vix Fix is simply a code from Larry Williams creating almost identical results for creating the same ability the Vix has to all assets.
The VIX has always been much better at signaling bottoms than tops. Simple reason is when market falls retail traders panic and increase volatility , and professionals come in and capitalize on the situation. At market tops there is no one panicking... just liquidity drying up.
The FE green triangles are "Filtered Entries"
The AE green triangles are "Aggressive Filtered Entries"

Volume Power Flow - Taylor V1Combination of Volume Average Trend & Volume Power Range
Able to Change Average Moving Type & Length = Depending on How Volatility /Smooth is Require on your Strategy
1# Color Green = The Volume On Trend Up
2# Color Red = The Volume On Trend Down
3# Spiking Higher Volume = End of the Top/ Bottom
Elder Impulse System + ATR BandsDisregard the above chart, I am not sure why it isn't showing the one I want, which is linked below:
This is as far as I can tell the closest representation to Dr. Alexander Elder's updated "Elder Impulse System" that has added ATR-volatility bands up to 3x deviations from price. I got the idea from watching this recent video (www.youtube.com) of Dr. Elder reviewing some recent trades and noticed he had updated his system from his original books. The Impulse System colour coding was inspired by AstralLoverFlow and LazyBear. ATR Bands are pre-programmed Keltner Channels with some modifications such as filing in the ATR Zones with user-selected colour bands and modifying the ATR value to better suit the volatility of the market being traded.
The script has several components, which I will detail below:
Exponential Moving Averages:
1) A 13-period EMA that is used as a staple in all of Dr. Elder's technical analysis. He uses this EMA as the basis for all of his indicators and why it is included here.
2) A 26-period EMA which can be used as a base-line of sorts to filter when to go long or when to go short. For instance, price over the 26-EMA, price is strong and the rally upwards is likely to continue, underneath it, price is weak and likely to continue downwards for a time.
Volatility Bands:
By definition these are nothing more than 3 separate Keltner Channels of a 13-period EMA each set to one additional multiplier from the moving average. This gives us a 1x, 2x, and 3x multiplier of average volatility from the 13-period EMA based on a 14-period Average True Range (ATR) reading. The ATR was chosen as it accommodates price gaps and also is the standard formula calculation in TradingView. The values of the bands cannot be adjusted but the colour coding of them can be.
Elder Impulse System:
These colour-coded bars show you the strength and direction of the current chart resolution, calculated by the slope of a 13-period EMA and the slope of a MACD histogram. These are used not as a buying or selling recommendation alone but as trend filters, as per Dr. Elder's own description of them.
Green Bars = The 13-period EMA is sloping positively and the MACD histogram is rising compared to previous bars. The trader should only consider buying/long opportunities when a green bar is most recent.
Red Bars = The 13-period EMA is sloping negatively and the MACD histogram is falling compared to previous bars. The trader should only consider selling/short opportunities when a red bar is most recent.
Blue Bars = The 13-period EMA and the MACD histogram are not aligned. One of the indicators is sloping opposite to the other indicator. These are known as indecision bars and are typically seen near the end of a previously established trend. The trader can choose to wait for either a green or red bar to shape their trading bias if they are more risk-averse while a counter-trend trader may decide to try opening a position against the currently-established trend.
How To Trade the System:
This system is unique in that it is so versatile and will fit the styles of many traders, be it trend following traders (generally the original Elder Impulse System design) or mean-reversion/counter-trend trading (the original Keltner Channel design). None of the examples below or in the chart above are financial advice and are just there for demonstration purposes only.
1) The most basic signal given would be the moving average cross up or down. A cross of the 13-EMA over the 26-EMA signals upward trend strength and the trader could look for buying opportunities. Conversely, the 13-EMA under the 26-EMA shows downward trend strength and the trader could look for selling opportunities.
2) Following the Elder Impulse system in conjunction with the EMAs. Look for long opportunities when a green bar is printed and price is over both of the 13- and 26-period EMAs. Look for short opportunities when a red bar is printed and price is below both of the 13- and 26-period EMAs. Keep in mind this does not necessarily need a moving average cross to be viable, a green or red bar over both EMAs is a valid signal in this system, usually. Examine price more closely for better entry signals when a blue bar is printed and price is either above or below both EMAs if you are a trend trader. This is how Dr. Elder originally intended the system to be used in conjunction with his famous Triple Screen Trading System. I am not going into detail here as it is a deep subject but I would suggest an interested trader to examine this Triple Screen System further as it is widely accepted as a strong strategy.
3) Mean Reversion and Counter-Trend Trading. Dr. Elder mentions that the zone between the two EMAs is called the Value Zone. A mean reversion trader could look for buying opportunities if price has generally been in an uptrend and falls back to value, conversely, they could look for shorting opportunities if price has generally been in a downtrend and rises back to value. These are your very basic pull backs found in trends that create your higher lows in an uptrend or your lower highs in a downtrend. A mean reversion/scalper trader may also look to use the upper and lower most ATR bands as an indication of price being overbought or oversold and could look to enter a counter-trend trade here once a blue indecision bar is printed and to ride that move back down to the Value Zone.
Taking Profits and Risk Management
This system again is very versatile and will fit a wide range of trading styles. It has built in take profit levels and risk management depending on your style of trading.
1a) In original Triple Screen Trading (and the original Elder Impulse system), a trader was to place a buy order one tick above a newly printed green bar with a stop loss one tick below the most recent 2-day low, and vice-versa for red bars on short selling. as long as other criteria were met, that I will not go into. It is all over YouTube and in his books and on Investopedia if you want more information. The general idea is to continue the trend in the direction if price is strong and you are bought into that move with a close stop, or if price falls back a little bit, you can get in at a better price. This would be a system typically better suited to a scalper.
1b) The updated risk management according to the above video is to place a stop loss at least 2ATR away from price. These bands already have calculated these values so a trader can place a stop one tick below the 2 or even 3ATR zones depending on their risk appetite. This is assuming you have already received a strong buy signal based on the system you follow. This would be a system typically better suited to a trend-trader.
2a) Taking profits if you are a trend trader has several possibilities. The first, as Dr. Elder suggests, is to place a price target 2ATR values away from your entry giving you approximately a 1:1 risk-reward ratio.
2b) The second possibility if the trade is successful is to ride the trend upwards until a blue bar is printed, suggesting indecision in the market. A modified version of this that could let a winning trade run longer is to wait for the price to close under the 13-EMA in fast markets, or close under the 26-EMA in slightly slower markets to maximize potential winnings.
2c) A scalper trader may wish to have a target at either the value zone if they are playing an extended buy/short back to the mean, or if they are being at the mean, to sell or cover when price extends back out to the 2x or 3x zone.
3) Trend traders can additionally use the ATR zones as a sort of safety guidelines for entering a trade. Anything within the 1ATR zone is typically a safer entry as the market is less volatile at this time. Entering when price has gone into the 2ATR zone is signaled as a strong momentum move and can signal a stronger move in the direction of the current closing bar. While not always the case, it is suggested by Dr. Elder to not enter trend trades at the 3ATR zone as this is where you will be likely looking for a counter-trend retracement back to value and a trader entering here in the direction of the trade has a higher chance of being stopped out or not getting in at the best possible price.

MM CHEATCODE V2The Best Renko system out there. The second coming to the original Cheatcode Algo we made
with options to use Tradition point calculations or ATR values for price measurement
- Select up to 3 tp levels
- ATR Risk calculator
- Strategy presets for easy setting selection for certain assets
- A trailing Ma for stint entries filters
- Volatility bands (BB, Kentler,Donchain)
- ATR super trend for added trend & trade filter
- MTF filter (up to 3)
- Added Session display as well as strict filter to only trade during that session(s) selected
- Full signal Alerts (meaning the full signal will send Entry, TP, Sl )
- added MM Capo volatility filter
Also Have Automation Version Available
How to use
You can use a setting preset in for the asset selected and the settings will automatically adjust but won't apply to your setting screen. (Tradingview limitations)
For the most part the buy signal will plot when the ATR moves in up/down direction
Filter your trades with the various trend detections indicators added when they all line up you have the best probability for the trade.
Renko is the best way to trade basic market structure and now with all the confirmation you need.
ALL Links below or PM us for access to this indicator Happy Trading

Risk Management Tool [LuxAlgo]Good money management is one of the fundamental pillars of successful trading. With this indicator, we propose a simple way to manage trading positions. This tool shows Profit & Loss (P&L), suggests position size given a certain risk, sets stop losses and take profit levels using fixed price value/percentage/ATR/Range, and can also determine entries from crosses with technical indicators which is particularly handy if you don't want to set an entry manually.
1. Settings
Position Type: Determines if the position should be a "Long" or "Short".
Account Size: Determines the total capital of the trading account.
Risk: The maximum risk amount for a trade. Can be set as a percentage of the account size or as a fixed amount.
Entry Price: Determines the entry price of the position.
Entry From Cross: When enabled, allows to set the entry price where a cross with an external source was produced.
1.1 Stop Loss/Take Profit
Take Profit: Determines the take profit level, which can be determined by a value or percentage.
Stop Loss: Determines the stop loss level, which can be determined by a value or percentage.
2. Usage
One of the main usages of position management tools is to determine the position size to allocate given a specific risk amount and stop-loss. 2% of your capital is often recommended as a risk amount.
Our tool allows setting stop losses and take profits with different methods.
The ATR method sets the stop loss/take profit one ATR away from the entry price, with the ATR period being determined in the drop-down menu next to the selected methods. The range method works similarly but instead of using the ATR, we use a rolling range with a period determined in the drop-down menu next to the selected methods as well.
Unlike the available position management tool on TradingView, the entry can be determined from a cross between the price an an external source. The image above shows entries from the Volatility Stop indicator. This is particularly useful if you set positions based on trailing stops.

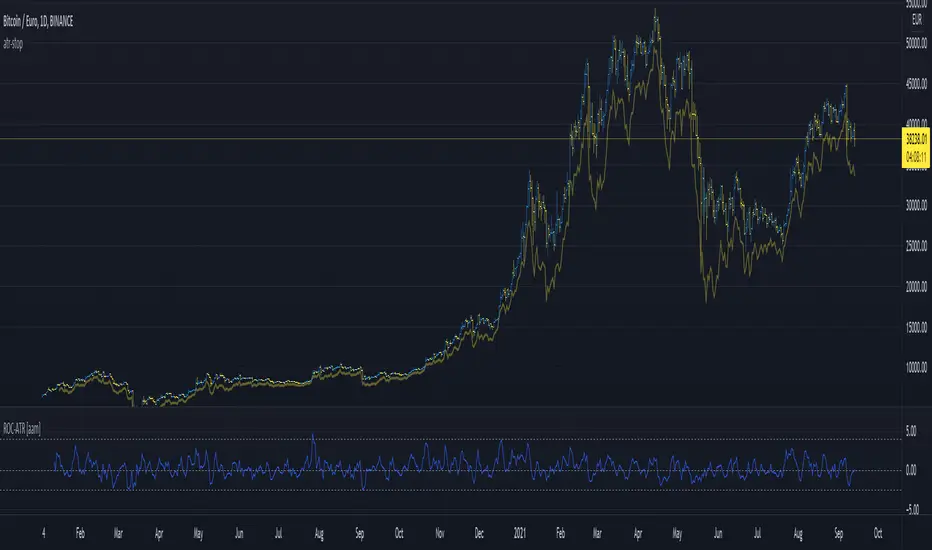
Rate Of Change ATRThis is a very basic, but powerful script.
It gives you the ratio between the rate of change of the last x days and the average true range of the last y days.
---> ROC-ATR Ratio = ROC/ATR
Therefore, you can see how much the price has moved relative to the prices in the past.
This is important because (in my opinion) the basic ROC indicator is not very meaningful if you don't look at the average volatility of recent history.
For example, a ROC of 5% over the last 3 days might be very high for Forex but very small for some crypto.
Consequently, this indicator makes it possible to compare (and be used on) every instrument in every industry the same way.
Generally speaking, it makes more sense if the ATR length is larger than the ROC length.
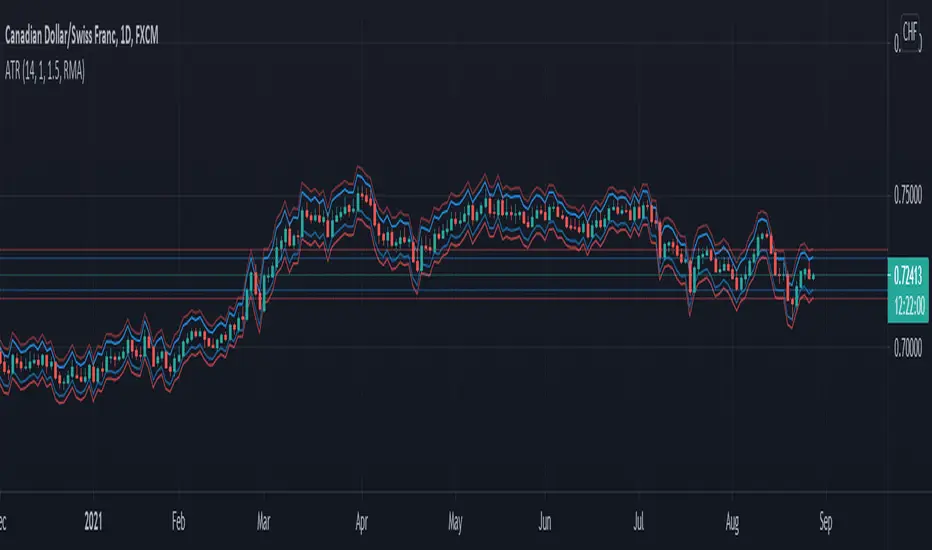
Keltner Center Of Gravity Channel ( KeltCOG )I have the ambition to create a ‘landscape’ which enables the user to see the ‘mood’ of the market about the price of an instrument, simply by looking where the candles go. Prices are a simple phenomenon , they go up or down or stay the same. This is represented quite well for the short term by a candle. I recommend to study candle patterns. Prices not only fluctuate but also trend up, down or go sideways. The user should analyze this by determining the COG (Center Of Gravity) and the ‘normal’ current range by using the historical data in a lookback period.
As a COG the center line of a Donchian Channel is often used. I.m.o. a COG should be a zone, in this channel I use the gray zone of my Donchian Fibonacci Channel, The ‘normal’ range is a multiple of Average True Range, as used in a Keltner Channel. Combining the two can give a cumbersome result, as one can see in my Keltner Fibonacci Channel. In this KeltCOG channel I solved this by not using all Fibonacci levels and by making the Keltner lines strictly parallel to the nearest COG line. To do this, I use the fact that the COG lines have horizontal stretches, there I make the Keltner lines horizontal too. Only where the COG lines change value, the Keltner lines are recalculated. This way the channel gets a very regular shape with three clear zones.
Interpretation of a chart by using the KeltCOG channel.
Overbought: If the candles go higher then the blue zone, the market is hyper enthusiast, creating an overbought situation. This is often followed by a reversion to the COG.
Uptrend: If the candles form in the blue zone, the market is enthusiast and willing to pay more.
Hopeful: If the candles form in or near the upper uncolored zone, the market is hopeful and is thinking about paying more. Sometimes prices go a little up.
Content: If the candles form in the gray zone, which represents COG, the market is happy with the current prices, so these move sideways
Disappointed: If the candles form in or near the lower uncolored zone, the market is disappointed and contemplates paying less, sometimes prices go a little down.
Downtrend: If the candles form in red zone, the market doesn’t like the instrument at all, rejects the current price and is only prepared to pay less.
Oversold: If the candles form below the red zone, the market overdoes its disgust, creating an oversold situation, often followed by a reversion to the COG.

Moving Average Support and Resistance ChannelThe Moving Average Support and Resistance Channel is a channel that consists of trend lines of resistance and support of the analyzed instrument, represented as moving averages with the selected type and smoothing period on a certain timeframe, where:
- Middle Line - the middle of the channel (the moving average of the pivot point using the Floor Pivot method)
- R1 - first resistance (moving average of support + Factor*ATR)
- R2 - second resistance (R1 + Factor*ATR)
- S1 - first support (moving average of resistance-Factor*ATR)
- S2 - second support (S1-Factor*ATR)
- Factor-ATR multiplier
Despite the fact that the indicator consists of moving averages, it can work equally well both during a trend and in its absence.
Characteristics of the trend movement:
• During an uptrend, the moving averages of the indicator are directed upwards, the price is above the Middle Line level most of the time
• During a downtrend, the moving averages of the indicator are directed down, the price is below the Middle Line level most of the time
• During the flat period, the boundaries of the moving average channel narrow, the channel tends to align in a horizontal position, the price consolidates most of the time around the Middle Line level, fighting off the support and resistance levels of the indicator.
The position of asset prices outside the indicator may mean an early correction or trend reversal.
How to trade:
One of the trading methods may be that during a breakout or a pullback after a breakout of the Middle Line level, the target of further movement, depending on the direction of this movement, may be the levels R1, R2 or S1, S2. Use this situation to make a profit.
I wish you good luck in building your trading plans and remember: such indicators do not predict the future price movement on the chart, they only determine the characteristics of the price movement at the current time, taking into account historical data.

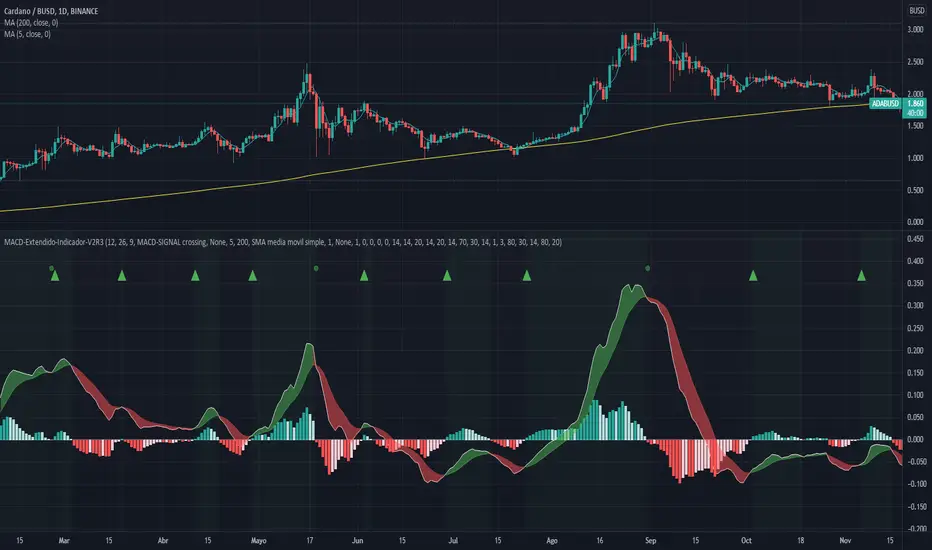
MACD-Extendido-Indicador por NeilMACD-Extendida-Estrategia
--------------------------------
DESCRIPTION
Resource that identifies entry and exit operations using the indicator
Average Convergence and Divergence Movements (MACD) and 5 strategies
INTERESTING
Novel strategies are implemented such as:
1. Overbought and oversold band to avoid horizontal movements
2. Control inputs and outputs at positions opposite the histogram line
3. Make a profit (take profit) without prior purchase orders
HOW DOES IT WORK (STRATEGIES)
1) Overbought and oversold:
Allows you to define an overbought upper band
Allows you to define an oversold ower band
Operations that occur within the band are ignored
2) Place of next operation (either side):
Indicates that the next operation can occur on either side of the histogram
3) Place of next operation (opposite side):
Indicates that the next operation must occur on the opposite side of the histogram
4) Take profit:
It allows defining the deviation in favor to execute a take profit.
It does not place a buy order at a distant point, instead it looks back and if the shift meets the expected deviation, take profit is executed
5) Loss control (stop loss):
It allows to define the deviation against to execute a stop loss.
It does not place a stop order at a distant point, instead it looks back and if the displacement meets the expected deviation the stop loss is executed
How to use it:
Press the "Indicators" option, go to the "Public Librarian" segment, write the name "MACD-Extendido-Indicador Neil", double-click on the record in question and you will have it added in your work panel, now, just It remains to be used to identify the inputs and outputs and you can do it visually or by defining the automatic notification alerts.
DESCRIPCION
Recurso que identifica operaciones de entradas y salida haciendo uso del indicador
Media Móvil de Convergencia/Divergencia (MACD) y 5 estrategias
NOVEDADES
Se implementan estrategias novedosas como:
1. Banda de sobrecompra y sobreventa para esquivar movimientos horizontales
2. Control de entradas y salidas en posiciones contrarias a la línea del histograma
3. Toma de ganancias (take profit) sin ordenes de compra previa
COMO FUNCIONA (ESTRATEGIAS)
1) Sobrecompra y Sobreventa:
Permite definir una banda superior de sobrecompra
Permite definir una banda inferior de sobreventa
Operaciones que ocurren dentro de la banda son ignoradas
2) Lugar de próxima operación (cualquier lado):
Indica que la próxima operación puede ocurrir en cualquier lado del histograma
3) Lugar de próxima operación (lado opuesto):
Indica que la próxima operación debe ocurrir en el lado opuesto del histograma
4) Toma de ganancias (take profit):
Permite definir la desviación a favor para ejecutar una toma de ganancia.
No coloca una orden de compra en un punto distante, en su lugar mira hacia atrás y si el desplazamiento cumple con la desviación esperada se ejecuta la toma de ganancia
5) Control de pérdida (stop loss):
Permite definir la desviación en contra para ejecutar una parada de pérdida.
No coloca una orden de parada en un punto distante, en su lugar mira hacia atrás y si el desplazamiento cumple con la desviación esperada se ejecuta la parada de la pérdida
Como usarlo:
Presione la opción "Indicadores", ubíquese en el segmento "Libreria Publica", escriba el nombre "MACD-Extendido-Indicador por Neil", haga doble clic sobre el registro en cuestión y lo tendrá agregado en su panel de trabajo, ahora, solo resta usarlo para identificar las entradas y salidas y puede hacerlo de forma visual o definiendo las alertas de notificación automática.
MACD-Extendido-Estrategia por Neil--------------------------------
MACD-Extendida-Estrategia
--------------------------------
DESCRIPTION
Resource that identifies entry and exit operations using the indicator
Average Convergence and Divergence Movements ( MACD ) and 5 strategies
INTERESTING
Novel strategies are implemented such as:
1. Overbought and oversold band to avoid horizontal movements
2. Control inputs and outputs at positions opposite the histogram line
3. Make a profit (take profit) without prior purchase orders
HOW DOES IT WORK (STRATEGIES)
1) Overbought and oversold:
Allows you to define an overbought upper band
Allows you to define an oversold ower band
Operations that occur within the band are ignored
2) Place of next operation (either side):
Indicates that the next operation can occur on either side of the histogram
3) Place of next operation (opposite side):
Indicates that the next operation must occur on the opposite side of the histogram
4) Take profit:
It allows defining the deviation in favor to execute a take profit.
It does not place a buy order at a distant point, instead it looks back and if the shift meets the expected deviation, take profit is executed
5) Loss control (stop loss):
It allows to define the deviation against to execute a stop loss.
It does not place a stop order at a distant point, instead it looks back and if the displacement meets the expected deviation the stop loss is executed
How to use it:
Press the "Indicators" option, go to the "Public Librarian" segment, write the name "MACD-Extended-Strategy by Neil", double-click on the record in question and you will have it added in your work panel, now, just It remains to be used to identify the inputs and outputs and you can do it visually or by defining the automatic notification alerts.
--------------------------------
MACD-Extendida-Estrategia
--------------------------------
DESCRIPCION
Recurso que identifica operaciones de entradas y salida haciendo uso del indicador
Media móvil de Convergencia/Divergencia ( MACD ) y 5 estrategias
NOVEDADES
Se implementan estrategias novedosas como:
1. Banda de sobrecompra y sobreventa para esquivar movimientos horizontales
2. Control de entradas y salidas en posiciones contrarias a la línea del histograma
3. Toma de ganancias (take profit) sin ordenes de compra previa
COMO FUNCIONA (ESTRATEGIAS)
1) Sobrecompra y Sobreventa:
Permite definir una banda superior de sobrecompra
Permite definir una banda inferior de sobreventa
Operaciones que ocurren dentro de la banda son ignoradas
2) Lugar de próxima operación (cualquier lado):
Indica que la próxima operación puede ocurrir en cualquier lado del histograma
3) Lugar de próxima operación (lado opuesto):
Indica que la próxima operación debe ocurrir en el lado opuesto del histograma
4) Toma de ganancias (take profit):
Permite definir la desviación a favor para ejecutar una toma de ganancia.
No coloca una orden de compra en un punto distante, en su lugar mira hacia atrás y si el desplazamiento cumple con la desviación esperada se ejecuta la toma de ganancia
5) Control de pérdida (stop loss):
Permite definir la desviación en contra para ejecutar una parada de pérdida.
No coloca una orden de parada en un punto distante, en su lugar mira hacia atrás y si el desplazamiento cumple con la desviación esperada se ejecuta la parada de la pérdida
Como usarlo:
Presione la opción "Indicadores", ubíquese en el segmento "Libreria Publica", escriba el nombre "MACD-Extendido-Estrategia por Neil", haga doble clic sobre el registro en cuestión y lo tendrá agregado en su panel de trabajo, ahora, solo resta usarlo para identificar las entradas y salidas y puede hacerlo de forma visual o definiendo las alertas de notificación automática.

Percent ATRThe script changes the default output of ATR and shows the result based on the percentage. It could be usefull when do you want to know about the percentage of the movement.

NNFX ATRBefore I begin I want to mention:
1. This is an indicator specially made for NNFX traders who use the ATR rule of ATR1x for Take Profit and ATR1.5x for Stop Loss
2. It is a product of combining the in-built ATR and Dillon Grech's ATR ()
The indicator:
1. It can be used for a quick look using the lines to see instead of calculating whether price hit a TP or SL. However I have kept the Main ATR for those who want to record the ATR into the spreadsheet when back testing or forward testing
2. When placing a buy/long order, TP is blue and appears above price, SL is red and appears below price
3. When placing a sell/short order, TP is blue and appears below price, SL is red and appears above price
4. The Main ATR, which is yellow, is way below price because I didn't want the chart to be overwhelmed by a 5th line in the middle of 2 TPs and SLs aka make the chart look claustrophobic
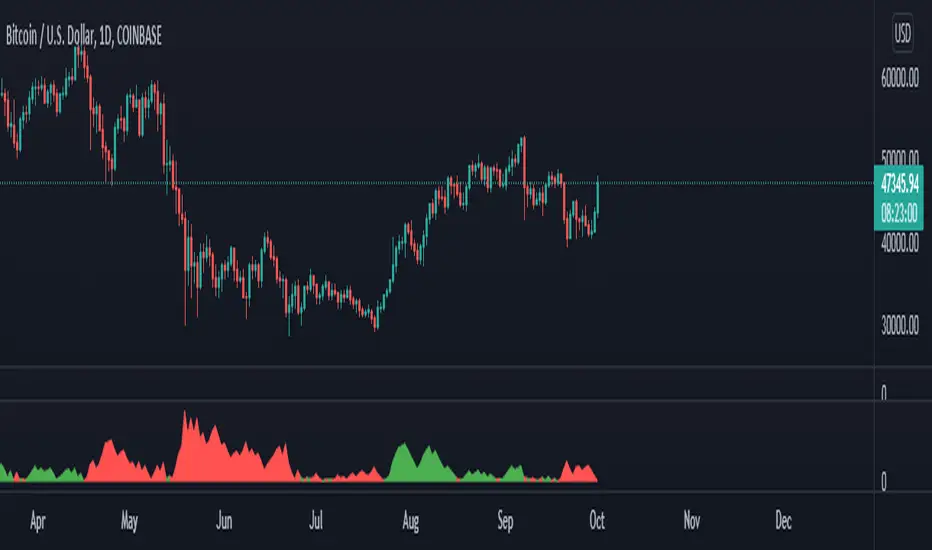
ATR Start & Stop BotThis script is using Average True Range (ATR) and works very well on the Bitcoin 4 hour timeframe to determine when to stop and start your bots.
It has a very similar visual to the EMA RSI Indicator found here:
This 'ATR Start & Stop Bot' is better because it has less confusion during sideways market movement.
As an example - You are using 3commas and have a Composite bot setup with several alt coins, you can use this indicator with the ' Stop bot ' alert to disable your composite bot from taking trades at times when the market is on a trend that looks in the red.
Alternatively you can use the ' Start bot ' alert to turn your bot back on during the green uptrends.
Using this indicator with these alerts on the Bitcoin 4-Hour chart add a great layer of automation to your already existing bots.
Credits:
Original 'ATR Stops' indicator belong to the user failathon and that script is found here:
Also credits to Dradian for the alert additions.

Study: Candle MA Distance (ATR)Simple script that plots price to MA distance (ATR) as a bar chart.
ATR is being used here instead of % because ATR keeps it relative to current volatility (1ATR move in either direction can have very different % for when price at 20cent and 2 dollars).
Upper/Lower band is calculated based on the average of previous peak/trough. Price approaching the band could signal overextended in the short term movement, expect price to consolidate/retrace to the MA.
Caution: if the indicator shows the price "pulled back" to MA, the actual price could still go up (or down), just a little slower then the MA
Adjustable Settings:
- Plot as bar or line
- MA Type and Length
- ATR Length
█ Disclaimer
Past performance is not an indicator of future results.
My opinions and research are my own and do not constitute financial advice in any way whatsoever.
Nothing published by me constitutes an investment recommendation, nor should any data or Content published by me be relied upon for any investment/trading activities.
I strongly recommends that you perform your own independent research and/or speak with a qualified investment professional before making any financial decisions.
SuperTrend+ DuoUses two SuperTrend+ indicators to signal when a change in trend is confirmed.
By using a minor trend within the major, a pullback after a turning point can signal a more optimal entry.
See SuperTrend+ for more details.
