Rainbow MA Width█ OVERVIEW
Rainbow MA Width is a companion indicator for Rainbow MA Cloud. It displays ribbon width as a normalized Z-Score, allowing traders to visualize trend momentum expansion and contraction relative to recent history.
█ CONCEPTS
Z-Score Normalization:
Rather than displaying raw width values (which vary by asset and timeframe),
this indicator normalizes the ribbon width using Z-Score calculation:
Z-Score = (Current Width - Average Width) / Standard Deviation
Z-Score Interpretation:
• 0 = Average width (mean)
• +1 to +2 = Expanding (above average, strong trend)
• -1 to -2 = Contracting (below average, weakening trend)
• Beyond ±2 = Extreme (statistical outlier, potential reversal)
Width Calculation Modes:
• Outer — Distance between fastest and slowest MA: |MA1 - MA8|
• Average Gap — Mean of all adjacent MA gaps
• Total Gap — Sum of all adjacent MA gaps
█ FEATURES
1 — Width Mode Selection
Three methods to calculate ribbon width.
"Outer" recommended for aligned trends.
2 — Z-Score Period
Configurable lookback for mean and standard deviation.
Default 20 bars; increase for smoother, less reactive readings.
3 — Zone Fill Coloring
Cyan fill when expanding (Z > 0).
Orange fill when contracting (Z < 0).
Yellow fill for extreme values (|Z| > 2) as warning.
4 — Alignment Background
Green background during bullish alignment.
Red background during bearish alignment.
Synced with Rainbow MA Cloud for consistency.
5 — Reference Lines
Horizontal lines at 0 (mean), ±1σ, and ±2σ levels.
Provides clear visual boundaries for interpretation.
6 — Raw Width Display
Optional secondary line showing original width percentage.
Useful for comparing normalized vs absolute values.
█ HOW TO USE
Trend Confirmation:
• Z-Score rising above 0 confirms trend acceleration
• Z-Score staying above +1 indicates sustained strong momentum
• Use alongside alignment background for confluence
Reversal Warning:
• Z-Score exceeding +2 suggests overextension (yellow warning zone)
• Z-Score dropping below -2 indicates extreme contraction
• Extreme readings often precede trend reversals or consolidation
Entry Timing:
• Enter trends when Z-Score crosses above 0 (expansion beginning)
• Avoid entries when Z-Score is at extreme highs (potential exhaustion)
• Consider exits when Z-Score peaks and begins declining
█ LIMITATIONS
• Z-Score is relative to lookback period; different periods give different readings
• Extreme zones (±2) are statistical guides, not guarantees
• Best used in conjunction with Rainbow MA Cloud for full context
█ ALERTS
Four built-in alert conditions:
• Z-Score crosses above/below zero
• Z-Score enters extreme high/low zones (±2)
Полосы и каналы

Momentum Burst Pullback System v66 * Detects **momentum “bursts”** using:
* **Keltner breakout** (high above upper band for long, low below lower band for short), and/or
* **MACD histogram extreme** (highest/lowest in a lookback window, with correct sign).
* Optional **burst-zone extension** keeps the burst “active” for N extra bars after the burst.
* Marks bursts with **K** (Keltner) and **M** (MACD) labels:
* Core burst labels use one color, extension labels use a different color.
* Tracks the most recent burst as the **dominant side** (long or short), and stores burst “leg” anchors (high/low context).
* Adds **structure-based invalidation**:
* On a new **core burst**, it locks the most recent **confirmed swing** level (pivot):
* Long: locks the last confirmed **swing low**.
* Short: locks the last confirmed **swing high**.
* After the burst, if price **breaks that locked level**, the burst regime is **cancelled** (and any pending setup on that side is dropped).
* Finds **pullback setups** after a dominant burst (and not inside the active burst zone), within min/max bars:
* Long pullback requires a sequence of **lower highs** and price still below the burst high.
* Short pullback requires **higher lows** and price still above the burst low.
* Optional background shading highlights pullback bars.
* On pullback bars, plots **static TP/SL crosses** using ATR:
* Anchor is the pullback bar’s high (long) or low (short).
* TP/SL are ± ATR * multiple.
* TP plots are visually classified (bright vs faded) based on whether TP would exceed the prior burst extreme.
* Maintains a **state-machine entry + trailing stop**:
* Sets a “waiting” trigger on pullback.
* Enters when price breaks the trigger (high break for long, low break for short).
* Trails a stop using **R-multiples**, with different behavior pre-break-even, post-break-even, and near-TP.
* Optionally draws the trailing stop as horizontal line segments.
* Optionally shows a **last-bar label** with the most recent pullback’s TP and SL values.

MASTER MACD'S Plus2nd Indicator- Description to come later... Invite only Go to the indicator then invite only. Click invite only and it should show up under my scripts. Save as a favorite and in settings click checkboxes Enable Ghost MacD MOdule, Show Histograms, Show Zero Line, Show Adaptive Zero Buff, Show engage Labels, Show RSI Zones, , and Smooth RSI. I will provide a better description later.
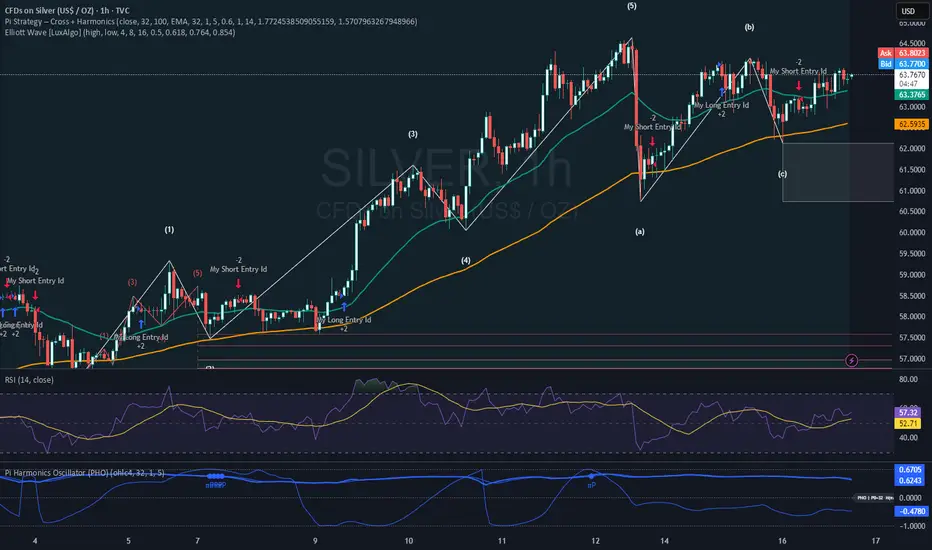
Pi Strategy Cross Harmonicsstill customizing this one, buy and sell seems to off on alternate time settings.
a work in progress, see if this works for anyone.
thanks again.
Scalping Signals with MTF Fibo BandsThis indicator is a scalping / intraday signal system built on Multi-Timeframe (MTF) Fibonacci Bands, combined with an RSI midline filter and an optional direction-lock mechanism to reduce consecutive losing entries.
🔹 What does this indicator do?
It plots two independent Fibonacci Band sets (A & B), each calculated from a higher timeframe SMA + ATR.
Entry zones are defined between Band 2 and Band 3, representing statistically extreme price areas.
You can choose to generate signals from:
Band A only
Band B only
BOTH (A + B confirmation)
📈 Entry Logic
LONG
Price closes inside the Lower Zone (between Fib2 Lower & Fib3 Lower)
RSI is above the midline (default 50)
SHORT
Price closes inside the Upper Zone (between Fib2 Upper & Fib3 Upper)
RSI is below the midline (default 50)
🟧 Direction Lock System
If enabled, the indicator locks the trade direction when a position hits Stop Loss before reaching TP1.
This prevents repeated entries in the same direction during unfavorable conditions.
🔓 Unlock Logic
The lock can be removed when:
RSI crosses back over the midline (RSI > 50 for LONG, RSI < 50 for SHORT)
AND price closes again inside the valid Band 2–3 zone
With the optional setting enabled, a new entry can occur on the same candle
🛑 Stop Loss Logic (Important)
This indicator uses price-action-based stop logic, not fixed pip stops.
1️⃣ Before TP1
LONG: Two consecutive candle closes below Fib3 Lower
SHORT: Two consecutive candle closes above Fib3 Upper
⚠️ Because SL depends on candle closes, you must monitor lower timeframes (1m or below) to react quickly and avoid delayed exits.
2️⃣ After TP1 (Break-Even Protection)
Once TP1 is touched:
SL automatically shifts to Break-Even (entry price)
Any return to entry will close the position
⚠️ Usage Warning
This indicator is NOT designed for sharp, explosive, or news-driven moves
Avoid using it during:
High-impact news
Extremely fast impulsive candles
Sudden volatility spikes
Best performance is achieved in structured price action environments, not chaotic market conditions.

Clean Market Structure & Trend Confirmation ( Updated ) CLEAN MARKET STRUCTURE & TREND CONFIRMATION — 24H CONTINUATION EDITION
This indicator is designed to help traders identify clear market direction, confirm trend strength, and manage trades with structured take-profit and stop levels. It works by aligning trend, momentum, and structure before showing any BUY or SELL signal. Signals are selective by design to reduce noise and false entries.
This version includes an optional continuation mode, allowing additional high-quality signals when trends persist, while still maintaining discipline and structure.
HOW TO LOAD AND USE (IMPORTANT)
Add the indicator to your chart.
Recommended symbols: SPY, QQQ, ES1!, NQ1! (works on stocks and futures).
Recommended timeframes:
• 5-minute (default and most balanced)
• 1-minute (faster, more active, optional)
No refresh is required each day. The script resets automatically.
RECOMMENDED DEFAULT SETTINGS
• 9:25 Bias Filter: ON
• Continuation Signals: ON
• TP Ladder: ON
• Keep Only Most Recent TP Ladder: ON
• Execute on Candle Close: optional (ON = safer, OFF = faster)
These defaults provide the best balance between discipline and opportunity.
HOW THE RIBBON WORKS (CORE TREND FILTER)
The ribbon is the foundation of the system.
• Teal ribbon = bullish trend
• Red ribbon = bearish trend
• Gray ribbon = no-trade zone
The system avoids signals in gray conditions to reduce chop. Only trade in the direction of the ribbon.
BULL AND BEAR DOTS
Bull and Bear dots mark confirmed trend flips.
• Bull dot = trend has flipped bullish
• Bear dot = trend has flipped bearish
These are not trades by themselves. They are early awareness signals that help you prepare for potential entries.
BUY AND SELL ARROWS (TRADE SIGNALS)
BUY and SELL arrows appear only when:
• Ribbon direction is aligned
• Trend structure confirms
• Momentum and volume agree
• Market conditions are favorable
These arrows represent high-probability trade opportunities, not constant signals.
TAKE PROFIT & STOP LEVELS
When a BUY or SELL arrow prints:
• TP1, TP2, TP3 levels appear automatically
• A STOP level is plotted automatically
• Levels are based on volatility and adjust to market conditions
Only the most recent trade plan is shown to keep the chart clean.
CONTINUATION MODE (WHAT’S DIFFERENT)
Compared to the original version:
• This version can take more than one trade per day
• It allows new trades when trends reset and realign
• It does NOT chase every candle
• It still requires full confirmation before each signal
Think of this as adaptive trend participation, not aggressive scalping.
1-MINUTE VS 5-MINUTE USE
• 5-minute: fewer signals, higher confidence, best for most users
• 1-minute: earlier entries, more activity, requires discipline
You do NOT need to switch back and forth constantly. Pick one timeframe and stay consistent.
IMPORTANT NOTES FOR NEW USERS
• Fewer signals is a feature, not a flaw
• Missing a move is better than forcing a bad trade
• Always manage risk and position size
• This indicator assists decision-making — it does not predict the future
DISCLAIMER
This indicator is for educational purposes only. It is not financial advice. Trading involves risk, and you are responsible for all trading decisions. Use proper risk management and only trade with capital you can afford to lose.

Clean Market Structure & Trend Confirmation ( UPDATED )
CLEAN MARKET STRUCTURE & TREND CONFIRMATION — 24H CONTINUATION EDITION
This indicator is designed to help traders identify clear market direction, confirm trend strength, and manage trades with structured take-profit and stop levels. It works by aligning trend, momentum, and structure before showing any BUY or SELL signal. Signals are selective by design to reduce noise and false entries.
This version includes an optional continuation mode, allowing additional high-quality signals when trends persist, while still maintaining discipline and structure.
HOW TO LOAD AND USE (IMPORTANT)
Add the indicator to your chart.
Recommended symbols: SPY, QQQ, ES1!, NQ1! (works on stocks and futures).
Recommended timeframes:
• 5-minute (default and most balanced)
• 1-minute (faster, more active, optional)
No refresh is required each day. The script resets automatically.
RECOMMENDED DEFAULT SETTINGS
• 9:25 Bias Filter: ON
• Continuation Signals: ON
• TP Ladder: ON
• Keep Only Most Recent TP Ladder: ON
• Execute on Candle Close: optional (ON = safer, OFF = faster)
These defaults provide the best balance between discipline and opportunity.
HOW THE RIBBON WORKS (CORE TREND FILTER)
The ribbon is the foundation of the system.
• Teal ribbon = bullish trend
• Red ribbon = bearish trend
• Gray ribbon = no-trade zone
The system avoids signals in gray conditions to reduce chop. Only trade in the direction of the ribbon.
BULL AND BEAR DOTS
Bull and Bear dots mark confirmed trend flips.
• Bull dot = trend has flipped bullish
• Bear dot = trend has flipped bearish
These are not trades by themselves. They are early awareness signals that help you prepare for potential entries.
BUY AND SELL ARROWS (TRADE SIGNALS)
BUY and SELL arrows appear only when:
• Ribbon direction is aligned
• Trend structure confirms
• Momentum and volume agree
• Market conditions are favorable
These arrows represent high-probability trade opportunities, not constant signals.
TAKE PROFIT & STOP LEVELS
When a BUY or SELL arrow prints:
• TP1, TP2, TP3 levels appear automatically
• A STOP level is plotted automatically
• Levels are based on volatility and adjust to market conditions
Only the most recent trade plan is shown to keep the chart clean.
CONTINUATION MODE (WHAT’S DIFFERENT)
Compared to the original version:
• This version can take more than one trade per day
• It allows new trades when trends reset and realign
• It does NOT chase every candle
• It still requires full confirmation before each signal
Think of this as adaptive trend participation, not aggressive scalping.
1-MINUTE VS 5-MINUTE USE
• 5-minute: fewer signals, higher confidence, best for most users
• 1-minute: earlier entries, more activity, requires discipline
You do NOT need to switch back and forth constantly. Pick one timeframe and stay consistent.
IMPORTANT NOTES FOR NEW USERS
• Fewer signals is a feature, not a flaw
• Missing a move is better than forcing a bad trade
• Always manage risk and position size
• This indicator assists decision-making — it does not predict the future
DISCLAIMER
This indicator is for educational purposes only. It is not financial advice. Trading involves risk, and you are responsible for all trading decisions. Use proper risk management and only trade with capital you can afford to lose.

Clean Market Structure & Trend Confirmation(Continuation 24H)CLEAN MARKET STRUCTURE & TREND CONFIRMATION — 24H CONTINUATION EDITION
This indicator is designed to help traders identify clear market direction, confirm trend strength, and manage trades with structured take-profit and stop levels. It works by aligning trend, momentum, and structure before showing any BUY or SELL signal. Signals are selective by design to reduce noise and false entries.
This version includes an optional continuation mode, allowing additional high-quality signals when trends persist, while still maintaining discipline and structure.
HOW TO LOAD AND USE (IMPORTANT)
Add the indicator to your chart.
Recommended symbols: SPY, QQQ, ES1!, NQ1! (works on stocks and futures).
Recommended timeframes:
• 5-minute (default and most balanced)
• 1-minute (faster, more active, optional)
No refresh is required each day. The script resets automatically.
RECOMMENDED DEFAULT SETTINGS
• 9:25 Bias Filter: ON
• Continuation Signals: ON
• TP Ladder: ON
• Keep Only Most Recent TP Ladder: ON
• Execute on Candle Close: optional (ON = safer, OFF = faster)
These defaults provide the best balance between discipline and opportunity.
HOW THE RIBBON WORKS (CORE TREND FILTER)
The ribbon is the foundation of the system.
• Teal ribbon = bullish trend
• Red ribbon = bearish trend
• Gray ribbon = no-trade zone
The system avoids signals in gray conditions to reduce chop. Only trade in the direction of the ribbon.
BULL AND BEAR DOTS
Bull and Bear dots mark confirmed trend flips.
• Bull dot = trend has flipped bullish
• Bear dot = trend has flipped bearish
These are not trades by themselves. They are early awareness signals that help you prepare for potential entries.
BUY AND SELL ARROWS (TRADE SIGNALS)
BUY and SELL arrows appear only when:
• Ribbon direction is aligned
• Trend structure confirms
• Momentum and volume agree
• Market conditions are favorable
These arrows represent high-probability trade opportunities, not constant signals.
TAKE PROFIT & STOP LEVELS
When a BUY or SELL arrow prints:
• TP1, TP2, TP3 levels appear automatically
• A STOP level is plotted automatically
• Levels are based on volatility and adjust to market conditions
Only the most recent trade plan is shown to keep the chart clean.
CONTINUATION MODE (WHAT’S DIFFERENT)
Compared to the original version:
• This version can take more than one trade per day
• It allows new trades when trends reset and realign
• It does NOT chase every candle
• It still requires full confirmation before each signal
Think of this as adaptive trend participation, not aggressive scalping.
1-MINUTE VS 5-MINUTE USE
• 5-minute: fewer signals, higher confidence, best for most users
• 1-minute: earlier entries, more activity, requires discipline
You do NOT need to switch back and forth constantly. Pick one timeframe and stay consistent.
IMPORTANT NOTES FOR NEW USERS
• Fewer signals is a feature, not a flaw
• Missing a move is better than forcing a bad trade
• Always manage risk and position size
• This indicator assists decision-making — it does not predict the future
DISCLAIMER
This indicator is for educational purposes only. It is not financial advice. Trading involves risk, and you are responsible for all trading decisions. Use proper risk management and only trade with capital you can afford to lose.

UK Public Oneside V2This strategy combines RSI, Stochastic Oscillator, and a 50 EMA trend filter to identify moderate-risk trading opportunities in trending markets.
How it works:
Long entries occur when RSI and Stochastic are in oversold conditions while price is above the 50 EMA.
Short entries occur when RSI and Stochastic are in overbought conditions while price is below the 50 EMA.
Trades are confirmed on the previous candle, avoiding premature entries and exits.
Risk management is handled using fixed percentage stop-loss with configurable risk-to-reward targets.
Optional RSI-based exits close positions early during overbought or oversold conditions.
Key Features:
Trend-filtered entries using EMA 50
Non-repainting logic (confirmed candle signals)
Configurable stop-loss and reward ratio
Works well for scalping and intraday trading
Suitable for crypto, forex, and indices
Recommended Timeframes:
5m, 15m, 30m
Note:
This strategy is designed for educational and research purposes. Always forward-test and apply proper risk management before using in live trading.

Quantum Algo Matrix Quantum Algo Matrix
Multi-Layer Market Intelligence
🔹 Overview
Quantum Algo Matrix is a multi-dimensional market analysis system designed to identify high-probability reversal and continuation zones by combining momentum, volatility, trend structure, multi-timeframe correlation, and AI-based confirmation into a single, coherent framework.
Instead of relying on a single indicator, this script cross-validates signals across independent methodologies, significantly reducing noise and false positives.
It is best suited for active traders, swing traders, and systematic traders who value confirmation, structure, and context over single-trigger signals.
🧠 Core Components & How They Work Together
1️⃣ WaveTrend Engine (Market Structure & Extremes)
At the heart of the system lies a WaveTrend oscillator, which identifies overbought and oversold market conditions with multiple graded levels:
Level 1 (L1) → Primary extreme zones
Level 2 (L2) → Secondary confirmation zones
Level 0 (L0) → Extended exhaustion zones beyond normal extremes
Signals are only considered when WaveTrend momentum confirms a structural extreme, ensuring trades are taken where risk-reward is asymmetric, not mid-range.
Visual differentiation (lines, dots, and crosses) clearly communicates signal strength and hierarchy.
2️⃣ WVF – Volatility Reversal Detection
The WVF module tracks volatility expansion and contraction relative to historical extremes:
Identifies panic selling and emotional spikes
Uses percentile-based thresholds, not fixed values
Optional standard deviation & range filters reduce noise
WVF reversal signals are gated by WaveTrend zones, meaning volatility alone is never enough — price must also be in a statistically significant location.
This avoids the common pitfall of chasing volatility in trending or neutral conditions.
3️⃣ Squeeze Momentum (SQZ) – Pressure & Energy Release
The Squeeze Momentum module measures volatility compression vs expansion, highlighting when the market is:
Building pressure (compression)
Releasing energy (expansion)
Unlike traditional implementations, SQZ is scaled to the WaveTrend range, allowing it to visually integrate with the rest of the system.
The result is a clear momentum context that confirms whether a signal occurs:
Into expansion (higher probability)
Or during decay (lower probability)
4️⃣ Multi-Timeframe Correlation (MTF Filter)
One of the most powerful features of Quantum Algo Matrix is its Multi-Timeframe WaveTrend Correlation Filter.
When enabled, the script checks WaveTrend conditions across multiple higher timeframes (user-selectable):
45m
60m
120m
(optional lower / higher frames)
A signal is only validated when current timeframe conditions align with higher-timeframe momentum, ensuring:
Trades are with the broader market context
Lower-timeframe noise is filtered out
Counter-trend signals are reduced
This is especially effective in volatile or choppy markets.
5️⃣ AI SuperTrend Clustering (Advanced Confirmation Layer)
The AI module introduces a machine-learning-inspired clustering approach:
Multiple SuperTrend variations are generated
Their behavior is clustered using K-means logic
Bullish, bearish, and neutral consensus streams are extracted
Output is normalized and scaled to the WaveTrend environment
Rather than predicting price, the AI acts as a confidence validator:
Confirms strength
Filters weak setups
Prevents entries during indecision
This layer dramatically improves signal quality consistency, especially during transitions and regime changes.
🎯 Final Signal Logic (Why It’s Accurate)
A final LONG or SHORT signal is only produced when:
✔ WaveTrend confirms a valid extreme
✔ Volatility (WVF) shows a qualified reversal or memory condition
✔ Momentum (SQZ) supports expansion or pressure release
✔ Multi-Timeframe structure is aligned (optional)
✔ AI consensus confirms directional confidence (optional)
Because each component is independent, the probability of random alignment is low — this is what makes the system robust and statistically sound.
🧩 Customization & Flexibility
Every module can be enabled or disabled
Visuals are clean and user-controlled
Works on all markets (crypto, forex, indices, stocks)
Optimized for intraday to swing timeframes
No repainting logic in signal generation
⚠️ Important Notes
This script is a decision-support system, not a prediction tool.
It is designed to help traders identify high-quality opportunities, manage risk more effectively, and avoid emotional trading.
Always combine with:
Proper risk management
Market structure awareness
Personal trading rules
⭐ Summary
Quantum Algo Matrix is not a single indicator —
it is a complete market intelligence framework.
By blending structure, volatility, momentum, correlation, and AI-based confirmation, it delivers clearer signals, fewer false positives, and stronger contextual awareness across all timeframes.

Opening Range Breakout & Targets [Strategy] (Fixed + Alerts)This strategy backtests a classic Opening Range Breakout approach using a configurable opening range window (time-based OR or custom session). Once the opening range is completed, the strategy waits for price to break above ORH (Opening Range High) or below ORL (Opening Range Low) and enters in the direction of the breakout.
Targets are derived directly from the opening range width:
OR Width = ORH − ORL
Target Step = OR Width × Target %
Take-profit is placed at the selected Target # (T1, T2, etc.)
An optional Daily Bias filter can be enabled to reduce false breakouts by comparing today’s opening range midpoint (ORM) to the previous session’s ORM. When bias is active, breakouts against the bias can require a stronger confirmation (break beyond the first target step).
Risk management is configurable via multiple stop options:
Stop at Opposite OR
Stop at OR Midpoint
Stop at 1× Target Step
Or disable stops for custom management
Includes support for:
Long/Short/Both modes
One trade per session option
Optional exit on opposite breakout
Separate alert conditions (when used with the companion indicator)
Note: This is a backtesting tool. Always validate results across symbols/timeframes and account for slippage/commissions before live use.

NQ Price band 5065/100CME_MINI:NQ1! CME_MINI:MNQ1!
this is a indicator that puts lines 50 points above and below price, 65.5 points above and below price and 100 points above and below price for the Nasdaq Futures.

MR.Mix Market Context
MR.Mix هو نظام تحليل سياقي مبني على الجلسات، تم تطويره لدعم منهجية تداول خاصة تحمل نفس الاسم (MR.Mix).
لا يُعد هذا المؤشر دمجًا لمؤشرات مستقلة، بل إطارًا تحليليًا واحدًا يتم فيه تنسيق عدة مكوّنات داخلية للعمل معًا وفق منطق موحّد يعتمد على بنية الجلسات، سلوك السعر، واستجابة الزخم.
يعمل المؤشر كأداة تحليلية مساعدة للاستراتيجية، حيث يركّز على قراءة سياق السوق وتأكيد الحالات التي تعتمد عليها المنهجية، دون توليد إشارات تداول مباشرة أو وعود أداء.
الوظائف الرئيسية:
• تحديد افتتاح جلسة نيويورك ورسم مستويات مرجعية مشتقة من الجلسة
• تصور نطاق ما قبل الافتتاح مع تتبع القمم والقيعان بشكل تراكمي
• عرض هياكل RSI والفوليوم مدمجة داخل الشارت ومقاسة نسبةً إلى النطاق السعري الظاهر
• متوسط متحرك EMA مع خيارات تنعيم تكيفية ونطاقات تذبذب اختيارية
• جميع العناصر البصرية تُعرض بناءً على شروط سياقية وليست مرسومة بشكل ثابت
تمت حماية كود المؤشر لاعتماده على تنسيق داخلي خاص بين توقيت الجلسات، التحجيم التكيفي، ومنطق العرض الشرطي، وهو تصميم لا يمكن إعادة إنتاجه بدقة باستخدام مؤشرات Pine المفتوحة دون كشف البنية الداخلية.
شرح العناصر على الرسم البياني:
• الخطوط الأفقية تمثل مستويات مرجعية مشتقة من الجلسات
• الخطوط العمودية تشير إلى انتقالات الجلسات
• المناطق المظللة توضح نطاقات ما قبل الافتتاح
• صناديق RSI والفوليوم المدمجة تعكس الزخم والمشاركة ضمن النطاق السعري الظاهر فقط
────────────────────────────────
MR.Mix is a session-based market context system developed to support a proprietary trading methodology under the same name (MR.Mix).
This script is not a compilation of standalone indicators. It is a unified analytical framework where multiple internal components are coordinated to operate under a single logic focused on session structure, price behavior, and momentum response.
The indicator functions as a supportive analytical tool for the methodology by providing market context and condition confirmation, without generating direct trading signals or performance claims.
Key features:
• New York session open detection with session-derived reference levels
• Pre-market range visualization with cumulative high/low tracking
• Embedded RSI and Volume structures rendered directly on the price chart and scaled relative to the visible price range
• EMA with optional adaptive smoothing and volatility bands
• All visual elements are condition-driven and context-aware rather than continuously plotted
The script is protected because it relies on proprietary coordination between session timing, adaptive scaling, and conditional rendering logic that cannot be accurately replicated using standard open-source Pine indicators without exposing internal structure.
Chart elements:
• Horizontal lines represent session-derived reference prices
• Vertical lines mark session transitions
• Shaded areas define pre-market price boundaries
• Embedded RSI and Volume boxes reflect momentum and participation within the visible range only

MR.MixMarket Context
MR.Mix هو نظام تحليل سياقي مبني على الجلسات، تم تطويره لدعم منهجية تداول خاصة تحمل نفس الاسم (MR.Mix).
لا يُعد هذا المؤشر دمجًا لمؤشرات مستقلة، بل إطارًا تحليليًا واحدًا يتم فيه تنسيق عدة مكوّنات داخلية للعمل معًا وفق منطق موحّد يعتمد على بنية الجلسات، سلوك السعر، واستجابة الزخم.
يعمل المؤشر كأداة تحليلية مساعدة للاستراتيجية، حيث يركّز على قراءة سياق السوق وتأكيد الحالات التي تعتمد عليها المنهجية، دون توليد إشارات تداول مباشرة أو وعود أداء.
الوظائف الرئيسية:
• تحديد افتتاح جلسة نيويورك ورسم مستويات مرجعية مشتقة من الجلسة
• تصور نطاق ما قبل الافتتاح مع تتبع القمم والقيعان بشكل تراكمي
• عرض هياكل RSI والفوليوم مدمجة داخل الشارت ومقاسة نسبةً إلى النطاق السعري الظاهر
• متوسط متحرك EMA مع خيارات تنعيم تكيفية ونطاقات تذبذب اختيارية
• جميع العناصر البصرية تُعرض بناءً على شروط سياقية وليست مرسومة بشكل ثابت
تمت حماية كود المؤشر لاعتماده على تنسيق داخلي خاص بين توقيت الجلسات، التحجيم التكيفي، ومنطق العرض الشرطي، وهو تصميم لا يمكن إعادة إنتاجه بدقة باستخدام مؤشرات Pine المفتوحة دون كشف البنية الداخلية.
شرح العناصر على الرسم البياني:
• الخطوط الأفقية تمثل مستويات مرجعية مشتقة من الجلسات
• الخطوط العمودية تشير إلى انتقالات الجلسات
• المناطق المظللة توضح نطاقات ما قبل الافتتاح
• صناديق RSI والفوليوم المدمجة تعكس الزخم والمشاركة ضمن النطاق السعري الظاهر فقط
────────────────────────────────
MR.Mix is a session-based market context system developed to support a proprietary trading methodology under the same name (MR.Mix).
This script is not a compilation of standalone indicators. It is a unified analytical framework where multiple internal components are coordinated to operate under a single logic focused on session structure, price behavior, and momentum response.
The indicator functions as a supportive analytical tool for the methodology by providing market context and condition confirmation, without generating direct trading signals or performance claims.
Key features:
• New York session open detection with session-derived reference levels
• Pre-market range visualization with cumulative high/low tracking
• Embedded RSI and Volume structures rendered directly on the price chart and scaled relative to the visible price range
• EMA with optional adaptive smoothing and volatility bands
• All visual elements are condition-driven and context-aware rather than continuously plotted
The script is protected because it relies on proprietary coordination between session timing, adaptive scaling, and conditional rendering logic that cannot be accurately replicated using standard open-source Pine indicators without exposing internal structure.
Chart elements:
• Horizontal lines represent session-derived reference prices
• Vertical lines mark session transitions
• Shaded areas define pre-market price boundaries
• Embedded RSI and Volume boxes reflect momentum and participation within the visible range only

CoreHedge: Structure Channels + Pivot S/R (v6, Perfect Parallel)
Main Support and Resistance
- You Can adjust on any timeframe

Kozmik Belirme v1.3: Ontolojik Bulut (Mizan Refined)### 🌌 Cosmic Manifestation: The Ontological Cloud (Psi_U v1.3)
**"The market is not a random walk; it is a manifestation of collective consciousness bending spacetime."**
This indicator, part of the **Mizan Refined** architecture, moves beyond traditional technical analysis. It treats price action as a physical event subject to **Quantum Mechanics** and **General Relativity**.
Instead of simple moving averages, it visualizes the **Probabilistic Cloud** of the asset's future path.
---
### 🧠 The Mathematical Core (How It Works)
The script operates on three proprietary engines designed by Murat Kavak:
#### 1. The Psi_U Field (Market Consciousness)
Calculates the "Intent" of the market by fusing Momentum, Volatility Compression, and Money Flow.
* **High Psi:** The market has "Crystallized" (Decided on a direction).
* **Low Psi:** The market is in "Superposition" (Chaos/Uncertainty).
#### 2. Gravitational Engine ( CAPITALCOM:G_M $)
Based on Einstein's curvature of spacetime:
* **Mass:** Calculated via Volume intensity relative to price range.
* **Spacetime:** Represented by the VWAP anchor.
* **Result:** The indicator calculates a gravitational force ( CAPITALCOM:G_M $) that pulls the price. The stronger the gravity, the brighter the cloud colors becomes (Dynamic Gradients).
#### 3. Heisenberg Cloud Geometry
The width of the cloud is not static; it obeys the **Uncertainty Principle**.
* If Market Consciousness (Psi_U) drops, the cloud expands (Entropy increases), showing high risk.
* If Consciousness rises, the cloud narrows, revealing a precise path.
---
### 🎨 Visual Language
* **Turquoise/Green Glow:** Strong Bullish Gravity (Future projection).
* **Red/Maroon Glow:** Strong Bearish Gravity (Heavy resistance).
* **The Cloud:** Represents the "Event Horizon" where price is most likely to manifest.
### ⚠️ Disclaimer
This tool is an experimental model of market physics and ontology. It is intended for analytical visualization of trends and volatility, not as financial advice. Trading involves significant risk.
---
**ACCESS:**
This is a proprietary **Invite-Only** script. The source code is closed to protect the underlying algorithm. To request access, please contact the author via private message.

PDH/PDL by ShreyanshThis TradingView indicator is a technical analysis tool designed to plot the Previous Day High (PDH) and Previous Day Low (PDL) levels with high accuracy. It is specifically engineered for traders who require market boundaries calculated based on the Indian Standard Time (IST) session, ensuring that day breaks are identified precisely at 12:00 AM IST regardless of the exchange's native timezone.
UK Public OnesideRSI + Stochastic V1 (Moderate) Strategy
This strategy combines RSI, Stochastic Oscillator, and a 50 EMA trend filter to identify moderate-risk trading opportunities in trending markets.
How it works:
Long entries occur when RSI and Stochastic are in oversold conditions while price is above the 50 EMA.
Short entries occur when RSI and Stochastic are in overbought conditions while price is below the 50 EMA.
Trades are confirmed on the previous candle, avoiding premature entries and exits.
Risk management is handled using fixed percentage stop-loss with configurable risk-to-reward targets.
Optional RSI-based exits close positions early during overbought or oversold conditions.
Key Features:
Trend-filtered entries using EMA 50
Non-repainting logic (confirmed candle signals)
Configurable stop-loss and reward ratio
Works well for scalping and intraday trading
Suitable for crypto, forex, and indices
Recommended Timeframes:
5m, 15m, 30m
Note:
This strategy is designed for educational and research purposes. Always forward-test and apply proper risk management before using in live trading.

Follow the "Smart Money" to Capture Altcoin Super-Trends這不是一套普通的趨勢策略。大多數山寨幣 (Altcoins) 的突破策略之所以失效,是因為它們忽略了市場的真實驅動力——比特幣的機構資金流向。 ITAS (Institutional Triggered Alpha System) 是一套結合了「跨市場分析」與「波動率自適應」的量化系統。
核心運作邏輯:
機構資金濾網 (Institutional Filter): 我們監控比特幣 (BTC) 在頂級合規交易所(如 Coinbase)與全球流動性池之間的資金溢價 (Premium)。這是一個領先指標,用來判斷華爾街機構是在「吸籌」還是「派發」。
精準狙擊 (Precision Trigger): 只有當監測到**「機構資金正在買入 BTC」**的時刻,系統才會解鎖山寨幣的交易權限。
拒絕假突破 (False Breakout Rejection): 透過這個濾網,我們能過濾掉市場中 80% 由散戶情緒引起的「假突破」。如果比特幣沒有機構支撐,就算山寨幣漲得再兇,本策略也會判定為雜訊而拒絕進場。
波動率適配 (Volatility Adaptation): 針對高波動資產 (High Beta Assets) 優化的動態通道,確保在劇烈洗盤中能拿住單子,吃到完整的波段利潤。
This is not an ordinary trend-following strategy. Most Altcoin breakout strategies fail because they ignore the true driver of the market—Institutional Money Flow in Bitcoin. ITAS (Institutional Triggered Alpha System) is a quantitative system that combines "Inter-market Analysis" with "Volatility Adaptation."
How It Works:
Institutional Filter: We monitor the Premium Gap of Bitcoin (BTC) between top-tier regulated exchanges (like Coinbase) and global liquidity pools. This serves as a leading indicator to determine whether Wall Street institutions are "Accumulating" or "Distributing."
Precision Trigger: The system only unlocks trading permissions for Altcoins when it detects "Institutional Buying in BTC."
False Breakout Rejection: Through this filter, we effectively filter out 80% of "False Breakouts" driven solely by retail sentiment. If there is no institutional support behind Bitcoin, the strategy will identify any Altcoin pump as noise and refuse to enter.
Volatility Adaptation: Features a dynamic channel optimized for High Beta Assets, ensuring positions are held through aggressive shakeouts to capture the full trend.
免責聲明 (Disclaimer)
補充說明: 以上策略績效源自歷史數據回測,不代表對未來獲利的保證。加密貨幣市場風險極高,本策略僅供量化研究與邏輯分享,使用者應自行評估風險並自負盈虧,本人不承擔任何交易損失。
Disclaimer: The performance above is based on historical backtesting and does not guarantee future results. Cryptocurrency trading involves high risk. This strategy is shared for quantitative research and educational purposes only. Users are solely responsible for their own risk assessment and PnL. I assume no liability for any trading losses incurred.

Coinbase Institutional Flow Alpha1. 核心概念 (The Core Concept)
這不是一套傳統看圖形(如 RSI 或 MACD)的技術指標策略,而是一套基於**「籌碼面」與「市場微結構」的量化系統。 比特幣市場存在兩個平行世界:美國機構投資者(主要使用 Coinbase 美元對)與全球散戶**(主要使用 Binance USDT 對)。這套策略的核心邏輯在於捕捉這兩者之間的**「定價效率落差」**。
This is not a traditional technical analysis strategy based on lagging indicators like RSI or MACD. Instead, it is a quantitative system based on Order Flow and Market Microstructure. The Bitcoin market consists of two parallel worlds: US Institutional Investors (trading on Coinbase USD pairs) and Global Retail Investors (trading on Binance USDT pairs). The core logic of this strategy is to capture the pricing inefficiency gap between these two liquidity pools.
2. 運作原理 (How It Works)
Smart Money 追蹤: 當機構開始大舉買入時,Coinbase 的價格往往會比 Binance 出現短暫且顯著的「溢價(Premium)」。這通常是行情的領先指標。
統計套利模型: 我們開發了一套獨家的演算法,24 小時監控這個溢價缺口的變化。只有當溢價偏離程度達到特定的**統計學異常值(Statistical Anomaly)**時,系統才會判定為「機構進場信號」並執行交易。
過濾雜訊: 我們只抓取真正由資金推動的大趨勢,過濾掉市場上 80% 的無效波動。
Smart Money Tracking: When institutions accumulate heavily, the price on Coinbase often trades at a significant "Premium" compared to Binance. This serves as a powerful leading indicator for price trends.
Statistical Arbitrage Model: We utilize a proprietary algorithm that monitors this premium gap 24/7. Only when the gap deviation hits a specific Statistical Anomaly, does the system identify it as an "Institutional Entry Signal" and execute the trade.
Noise Filtering: The strategy is designed to capture significant trends driven by real capital flow, effectively filtering out 80% of random market noise.
免責聲明 (Disclaimer)
補充說明: 以上策略不保證獲利,僅提供量化交易的想法與實驗數據參考。請注意,市場沒有聖杯,交易結果盈虧自負,本人不承擔任何因使用此策略而產生的資金損失。
Disclaimer: The above strategy does not guarantee profits and is provided solely for sharing quantitative ideas and experimental data. Please note that there is no "Holy Grail" in trading. You are solely responsible for your own PnL, and I assume no liability for any financial losses incurred.

Wisenode QuantThis indicator uses a combination of DMI, ADX and ATR% to give quick easy visual representation of trend strength, trend direction and price action volatility.
This helps to quickly visually identify market environment for trade execution using quantifiable data.
Direction
Red LED = Bearish Market conditions
Green LED = Bullish Market conditions
Trend (Strength)
Red = 0-20 on the ADX (Ranging)
Green = 20-30 on the ADX (Emerging)
Green = 30-50 on the ADX (Momentum)
Volatility
Uses ATR% on a dynamic scale from top to bottom is low to high intensity. Colour will transition from green to red as the bar moves higher.
Trade Execution
Integration of a custom Murray math values to build entry, stop loss protection and take profit zones.
This is still a working progress to fine tune default settings but can be used for market environment identification for any sort of discretionary trading

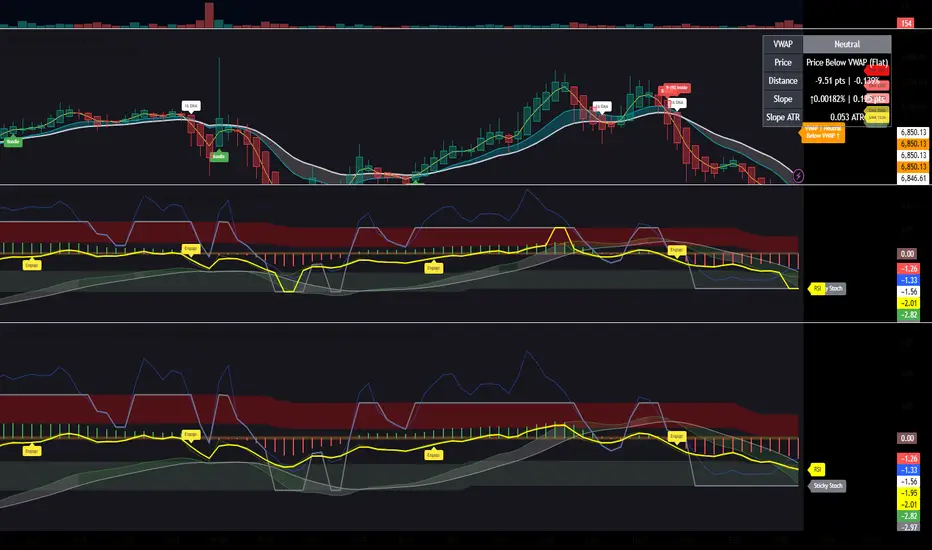
Master Moving Averages PlusThe Master Moving Averages indicator is a full-session, moving-average–driven market structure engine that combines 1) Heiken Ashi Candlesticks, 2)Exponential Moving Averages, 3)Session Backgrounds, 4)VWAP, 5)EMA Streams, 6)EMA Crossing Labels, 7)All-Inside EMA Labels, 8)Price Control Logic (Bundles, Momentum, Reversals), and 9)Heavy EMA anchors into a single chart framework. The indicator provides access to toggle these features on and off in the settings gear icon to the right of the indicator name in the screen panel.
1)Because this chart uses Heikin Ashi candlesticks, the behavior is slightly different from standard candles. Heiken Ashi candles are smoothed, meaning each candle is influenced by the previous one. This reduces noise and makes trends easier to see. In practice, long sequences of same-color candles with small or no opposite wicks indicate strong, sustained movement, while smaller bodies or the appearance of opposite wicks signal slowing or transition. Opposite wicks are wicks that appear against the current direction of the move. In an upward move, an opposite wick is a wick on top of the candle. It shows that upward progress is no longer clean and momentum is starting to slow. In a downward move, an opposite wick is a wick on the bottom of the candle. It shows that downward progress is slowing.
With Heiken Ashi candles, opposite wicks are especially important because they do not appear easily. When one shows up, it often marks loss of trend quality, a pause, or the beginning of a transition rather than a random fluctuation. Ashi wicks still matter, but they emphasize trend quality rather than single-bar reactions, making them especially useful for staying in moves longer and avoiding premature exits caused by random price spikes. Candlesticks are a visual record of price behavior over one bar, showing where price opened, traded, and closed. The body shows the meaningful part of the move—the distance between open and close—and tells whether price made progress during that bar. Large bodies indicate clean movement and follow-through, while small bodies indicate slowing or uncertainty. The wicks show where price traveled but did not stay. Wicks in the direction of the move are normal and usually appear during healthy trends, while wicks against the move signal slowing, hesitation, or loss of momentum. A candle with a large body and small wicks reflects strong continuation, whereas long wicks with a small body suggest pause, balance, or transition. Candlesticks are not signals by themselves; they are read bar-to-bar to judge whether a move is continuing, slowing, or stalling, helping decide whether to stay in a trade, manage risk, or wait for clearer structure.
For example, suppose price is moving higher and already in a long trade. Several candles print with solid bodies and small lower wicks, showing steady upward progress. This is healthy continuation, so staying in the trade makes sense. Then a candle prints with a small body and a long upper wick. Price pushed higher during the bar but could not hold those levels by the close. That candle does not mean reverse now, but it does mean momentum is slowing. The practical response is to stay in but be alert—do not expect the same speed of continuation. If the next candle prints another upper wick or a small body, the move is likely stalling. If instead the next candle closes strong with a large body, the trend has resumed.
2)An Exponential Moving Average (EMA) is a moving average that tracks price but gives more weight to the most recent bars. In plain terms: it reacts faster to what price is doing right now than a simple average (SMA) does. Here’s what that means in practice: Every EMA is an average of price over a set number of bars The "exponential" part means the newest candles matter more than older ones. Because of that weighting, an EMA turns sooner, crosses sooner, and shows shifts in directional control sooner. On the chart specifically: Short EMAs (like 4, 9, 16) respond quickly → they show immediate pressure. Mid EMAs (24, 36, 48) show follow-through or failure. Long EMAs (72 and up) change slowly → they define structure and context, often showing the explosive nature of building pressure signaling entries.
3)Session Background gives context to which part of the trading day the current bar or candlestick belongs to. The script separates the day into: Pre-Session, After-Hours and Regular Trading Hours (RTH). Price acts differently depending on the session. Session context is shown on the chart by 1️⃣ Background shading. The lighter background → Pre-session or Pre-Market (PM) and After-hours (AH). The darker background → RTH (Regular Trading Hours). One glance tells you where you are in the day. 2️⃣ Different sessions build different levels of highs and lows: Pre-Session High and Low is built only during After Hours (AH) and pre-market hours (PM). Session High and Low is built only during RTH. Previous Day Session High and Low is carried forward into today. These provide perspective during the session. Sometimes price respects pre-session highs and lows and even previous day session highs and lows— especially immediately following opening in the initial move and retracement. Session context just means knowing whether a particular candlestick bar was or is pre-market, regular hours, or after-hours — because the rules change. It's just a check on where you are.
4)VWAP stands for Volume Weighted Average Price. It is the session’s true average price — weighted by where the volume actually traded. Not yesterday, not overnight, only during Regular Trading Hours. Every share traded during Reg Trading Hours (RTH) pulls VWAP toward it. The VWAP on this chart resets at the RTH open. VWAP uses the average price of each bar, then lets the bars with real volume count more. The calculation is High+ Low+ Close/3. High, Low, Close are added together and averaged. So instead of picking just the close or just the high, it uses the middle of where price actually traded during that bar. The equation looks like this: hlc3 × volume. It only updates during the day session. Overnight and pre-market do not contaminate it. So VWAP belongs to today’s fight only. On the chart it looks like a thick orange line outlined in white. There is a right-side label that reads: VWAP | Bullish / Bearish / Neutral.
In practice VWAP is a 1️⃣ Fair price reference that shows where the bulk of business has been done because if Price is above it → trading is happening at higher-than-average prices. If Price is below it → trading is happening at lower-than-average prices. Fair price is the price level where the most of the trading has actually occurred during the session. It's not a prediction.
It's not a target. It's not a value judgment. It's just where buyers and sellers have been most active. 2️⃣ VWAP slope is smoothed and classified: Rising → Bullish, Falling → Bearish, Flat → Neutral. This doesn’t fire signals — it confirms pressure. VWAP shows where today’s real money has traded and whether that price is drifting up, down, or going nowhere.
The right-side VWAP label summarizes everything in one place: trend state, price distance from VWAP (percentage), and slope strength with direction arrows, allowing quick assessment without clutter. Practically, VWAP is used as a fair-value anchor and intraday control reference—price holding above a rising VWAP supports continuation, price below a falling VWAP supports downside pressure, and flat VWAP conditions warn of rotation or chop rather than trend.
5)EMA (Exponential Moving Average) Streams in this script are a visual state. They are the shaded bands between specific EMA pairs that show: direction, pressure, and alignment. The stream shows the relationship of the pairs. In the script the streams are: 4–9, 9–16, 16–24, 24–36 EMA'S. Each one can be turned on or off. On the chart they look like two EMAs with soft shaded fill between them and color changes based on up or down movement. The stream mechanically is telling 1️⃣ Direction. If the pair is above price they push down, if below price they push up. Each stream is made of two EMAs: One reacts faster, one reacts slower, but they’re doing the same thing. For Example a 4 EMA takes the last 4 candlesticks and averages them; likewise a 9 EMA takes the last 9 candlesticks and averages them yielding two lines, one that moves quicker and one that moves slower. When a slower EMA crosses above a faster EMA it drives price down. When a slower EMA crosses below a faster EMA it drives price up. 2️⃣ Pressure: EMA streams show pressure leaning on price. Wide stream → pressure is expanding. Tight stream → pressure is compressing. Compression matters because it precedes movement.
6)EMA Crossing Labels (Pivots, EMA9, EMA16, EMA24) mark an actual EMA crossover event. The Crossing Labels are white labels attached below or above the candlestick showing price direction. They print only when one EMA physically crosses the price control line. The price control line is a default on the chart and is constant. The priceControlLine = (open + close) / 2. The crossing is confirmed on bar close. If, for example, EMA-16 rolls over the priceControlLine and crosses downward, the label fires indicating that price has stalled or shifted, buyers have lost control, sellers are in control, and the market is trending short. If EMA-24 and EMA-36 follow, pressure is stacking, multiple timeframes confirm, pullbacks become weaker, and price is more likely to continue in the same direction.
7)An Inside EMA label can represent two very different conditions, and context matters. When shorter ranges (such as 9–36, 9-48, or 9–72) compress inside a candle during sideways or low-energy price action, it often reflects chop or rotation, and no immediate expansion is required. In contrast, when deeper ranges (9–106, 9–139, 9–192) collapse inside a single candle—especially near the open or during active sessions—it usually occurs because price is moving faster than the EMAs can respond, signaling elevated energy and the potential for rapid continuation or transition. Practically, Inside labels are conditional triggers: shallow compression can persist, while deep compression demands attention because resolution, when it comes, tends to be decisive.
Example 1: Fast open, real urgency— The market opens and within the first few candles a 9–139 Inside label prints. Price has already moved aggressively, and all EMAs are trapped inside one candle body. In real terms, this means structure has been run over. The practical response is immediate attention: do not hesitate, do not wait for EMAs to fan out. Expect either a fast continuation (often followed quickly by a Bundle or Momentum label) or a sharp stall if momentum fails. Speed matters because the next decision point arrives quickly.
Example 2: Mid-day chop, no urgency—Later in the session, price is rotating sideways and a 9–72 Inside label appears. Price has not traveled far, candles overlap, and no expansion follows. In this case, the label simply confirms compression without pressure. The correct action is no action—continue waiting. No urgency, no expectation of immediate resolution.
Example 3: Transition point—After a trend, a 9–106 Inside prints as bodies shrink. Momentum is already slowing. Here the label marks a transition zone. The practical move is to stop expecting continuation and watch closely: a Momentum or Bundle label confirms continuation, while a Reversal label confirms control change.
8)Price Control Logic is determined by three things working together and the Bundle, Momentum, and Reversal labels are expressions of that control:
1️⃣ Price vs the Price Control Line: The Price Control Line is the midpoint of the candle body. When Price is above it → buyers are controlling closes. When Price is below it → sellers are controlling closes.
2️⃣ EMA Position Relative to Control: When EMAs cross the Price Control Line: EMA crosses up through control → momentum is shifting to buyers. EMA crosses down through control → momentum is shifting to sellers. That’s why labels fire only on those crosses. It marks real control shifts, not wicks.
3️⃣ EMA Stack & Compression: Tight EMA bundles inside the candle body means no one has control yet. EMAs expanding upward means buyers are gaining control. EMAs expanding downward means sellers are gaining control. This is pressure building vs pressure releasing.
Bundle, Momentum, and Reversal labels are confirmation markers, not prediction signals. A Bundle label prints when a compressed EMA cluster (16/24/36/48) resolves back into price with real body momentum and EMA-16 already trending, signaling stored pressure releasing. A Momentum label prints only on sharp expansion, where the candle body is significantly larger than the prior bar, confirming acceleration in the existing direction. A Reversal label marks a true short-term control shift, where EMA-16 flips slope with a momentum candle, signaling buyers and sellers have swapped control—not a wick reaction. Because all labels require body dominance and EMA agreement, they often appear after movement begins, making them reliable tools for confirming pressure, continuation, or control change rather than early entry timing. Visually, each label reinforces direction at a glance. Bullish labels are green, placed below the candle, and use an upward-pointing shape to indicate rising pressure. Bearish labels are red, placed above the candle, and use a downward-pointing shape to indicate falling pressure. Labels sit just off the candle body so price remains clear, and their color, placement, and shape always align with the direction of control.
9) Heavy EMA anchors are the big EMAs. They act like fixed reference points while everything else whips around them. The heavy EMA anchors in this chart are EMA 768,1024, 1250, 1536, 2048, 2700, 3300, 4096. They are displayed only as right-side tags at their current price levels, not as plotted lines. These tags sit on the far right edge of the chart, aligned with the price scale, and are color-matched to their respective EMAs. Their purpose is to show where slow, heavy pressure exists without cluttering price action with lines. When these EMA tags are bundled together and price is trading inside that cluster, the market is compressed and choppy. When the tags separate and price holds above or below the group, structure is returning and directional movement becomes easier. Keeping the tags visible provides instant awareness of whether price is trapped or free, helping filter noise and align the rest of the indicator with the larger structure at all times.

Kairos Bands [v1.1]Overview
The Kairos Bands Strategy is a highly modular trading system designed to identify high probability entry points based on volatility exhaustion and momentum shifts... It is built with a proprietary core algorithm that detects when price has extended too far from its mean, but it is wrapped in a Confluence Cloud that allows the user to filter these signals through nine different secondary indicators...
This is not just a static strategy... It is a framework that allows you to build your own edge by toggling specific filters on and off to match current market conditions...
1... The Chameleon Feature (Trend or Reversal)
One of the most powerful features of Kairos Bands is the Inverse Trades logic...
Reversal Mode (Default): By default, the strategy looks for price exhaustion... It buys when the market is oversold and sells when the market is overbought... This is ideal for ranging markets or catching tops and bottoms...
Trend Following Mode (Inversed): By checking the Inverse Trades box in the settings, the logic flips completely... A Buy signal becomes a Sell and vice versa... This transforms the strategy into a breakout or trend following system, entering trades in the direction of the momentum rather than against it...
2... The Confluence Cloud
While the core trigger is based on proprietary volatility calculations, the user has full control over how strictly those trades are filtered... You can toggle any of the following 9 momentum filters independently for both Long and Short setups...
RSI (Relative Strength Index)
Stochastic Oscillator
CCI (Commodity Channel Index)
Williams %R
MFI (Money Flow Index)
CMO (Chande Momentum Oscillator)
Fisher Transform
Ultimate Oscillator
ROC (Rate of Change)
For example, you can require RSI and MFI to agree with the main signal for Longs, but only require Stochastic for Shorts... This allows for granular tuning...
3... Trend Bias & Time Management
To further refine entries, the strategy includes:
EMA Trend Filter: An optional dual EMA system (Fast vs Slow) that forces the strategy to only trade in the direction of the dominant trend...
Precision Time Filtering: You can define exact start and end times (down to the minute) for entries...
No Trade Zone (NTZ): A specific time window where the strategy is forbidden from holding positions... If a trade is open when the NTZ begins, it is immediately force closed to avoid volatility events or market closes...
4... Risk Management
The strategy moves away from vague percentage based stops and uses precision point based targeting...
Fixed Points: Set your Take Profit and Stop Loss in exact price points...
Signal Skipping: An optional feature to cool down the strategy after a trade closes, forcing it to skip a set number of subsequent signals to avoid over trading...
5... Professional Analytics Dashboard
The visual overlay provides a detailed Heads Up Display (HUD) containing institutional grade metrics...
Strategy Grade: An automatic A through F grading system based on the Win Rate Differential (how much better the strategy performs compared to a breakeven coin flip)...
Streak Analysis: Tracks the maximum and average consecutive wins and losses to help you understand the psychological drawdown risk...
Rolling PnL: A secondary dashboard tracks your hypothetical Net PnL over the last 7 trading days and the last 12 months, giving you a clear view of short term and long term performance...
