TOBYGBADE1: Dynamic Big Candle Pip RangeDisplays candle ranges in pips as a histogram in a separate pane, highlights big candles exceeding a dynamic threshold, and colors bars and labels green/red based on bullish or bearish direction.”
Candlestick analysis


BUY/SELL/R/BBuy/Sell/R/B by SeanKidd
Purpose: A clean, anchored signal system combining StochRSI crossovers, CVI top/bottom detection, and a MACD direction line that moves with price.
⚙️ How It Works
BUY / SELL – Generated from a higher-timeframe StochRSI crossover.
BUY (Green) → %K crosses above %D
SELL (Red) → %K crosses below %D
R (Reverse) – Yellow “R” appears above the candle when the CVI model detects a local top or exhaustion point.
B (Bottom) – Blue “B” appears below the candle when CVI detects a local bottom.
MACD Direction Line –
Green = MACD above Signal → bullish momentum
Red = MACD below Signal → bearish momentum
The line rides just above the candles, offset by ATR so it always tracks price.
🧭 How to Use It
Add the indicator:
Search for Buy/Sell/R/B by SeanKidd under Community Scripts.
Click ★ to favorite it.
Apply it to your chart.
Open ⚙️ Settings → Inputs
Calculation Timeframe (StochRSI) → pick how fast or slow you want signals (default Weekly).
MACD Line Offset (ATR ×) → raise or lower the MACD line if it overlaps candles.
Adjust Top/Bottom thresholds to control how often R/B appear.
Toggle Highlight bars or Color candles for visual clarity.
Go to Settings → Scales and ensure it’s set to
✅ “Scale with Price Chart” or
✅ same scale side as the candles.
This keeps everything perfectly attached to the chart.
Optional: Add alerts
Create → Alert → Condition → Buy/Sell/R/B by SeanKidd
Choose: SRSI BUY, SRSI SELL, Top (R), or Bottom (B).
📈 Reading the Chart
Marker Meaning Color Position
BUY StochRSI %K cross above %D Lime Below bar
SELL StochRSI %K cross below %D Red Above bar
R CVI-detected top / reversal Yellow Above bar
B CVI-detected bottom Blue Below bar
Line MACD momentum direction Green/Red Above highs
💡 Tips
Works on any symbol or timeframe.
Slower charts (Daily–Weekly) give cleaner swing signals.
Faster charts (15m–1h) show short-term reversals.
Combine the MACD line direction with BUY/SELL for stronger confirmation.

Pro: Big Candle Pip Range (Upper Label)Highlights unusually large candles by calculating pip ranges dynamically based on recent volatility. Shows exact pip count above the candle, color-coded by direction (green bullish, red bearish). Features adaptive thresholds, optional histogram, and works on any instrument or timeframe. Ideal for scalpers and intraday traders spotting high-volatility candles quickly.

Fractional + Heikin-Ashi Candlestick – CF / ABNew model of Candlestick, Tis model constructed on Fractional Calculus mathematical, use two kernel - Caputo-Fabrizio and Atangana-Baleanu.

Aroon with RSI Confirmation (92.86%)This script is an analytical tool designed to identify moments in market behavior when price momentum is shifting. It does this by combining two concepts: **Aroon Levels** (to measure trend maturity) and **RSI Slope Behavior** (to measure short-term momentum pressure).
**Functional Concept (Professional Description)**
The indicator examines when either the *Aroon Up* or *Aroon Down* value reaches approximately **92.86%**, which statistically represents a phase where price has recently made an extreme high or low relative to the selected period. This level suggests the trend is nearing a point of *decision*—either continuation or exhaustion.
At the same time, the script analyzes the **relationship between the RSI and its smoothed average**. The difference between the two reflects whether momentum is accelerating in the current direction or slowing. A small difference indicates **market stability**, while whether RSI is positioned above or below the smoothed line indicates **who has control**—buyers or sellers.
By requiring both conditions to align, the script filters out random noise and highlights moments where **trend structure and momentum sentiment converge**.
* **Buy Signal:** Occurs when the market has recently formed a significant low (Aroon Down ≈ 92.86) and buyers begin to regain control (RSI crosses above its smoothed value with low volatility).
* **Sell Signal:** Occurs when the market has recently reached a significant high (Aroon Up ≈ 92.86) and sellers begin to dominate (RSI slips below its smoothed value with low volatility).
---
**Psychological Interpretation**
Markets are driven by cycles of **attention**, **emotion**, and **participation**.
This script targets moments when:
1. **Price has made a meaningful extreme** (a recent new high or low).
This is where crowd sentiment is often strongest—either euphoria near highs or pessimism near lows.
2. **Traders are reassessing direction**, shown by momentum flattening (small RSI difference).
This reveals that participants are hesitating, watching, and waiting.
The market is effectively *thinking*.
3. **Control shifts subtly**, when RSI moves relative to its smoothed trend.
This indicates that early, informed participation is beginning to form—before the broader crowd reacts.
In psychological terms, the script highlights the **transitional turning points** where:
* Fear begins to weaken and confidence returns (buy setup), or
* Confidence begins to crumble and caution emerges (sell setup).
These are the earliest moments when market sentiment **changes hands**, often preceding visible trend reversals. The indicator is not reacting to outcomes—it is observing the underlying shift in **decision-making pressure** among market participants.
---
In essence, this tool identifies **behavioral inflection points**—where the market transitions from one emotional state to the next—providing traders with signals grounded in both structural trend positioning and real-time crowd momentum behavior.

CME Close PriceThis script adds the closing price of another asset on your chart, such as the BTC1! Futures Price on your BTC Spot Chart for example.

Session SFPThis script is a powerful, multi-timeframe tool designed to identify high-probability Swing Failure Patterns (SFPs) at key historical levels.
Instead of looking for traditional "pivots" (like a 3-bar swing), this indicator finds the actual high and low of a previous higher-timeframe (HTF) bar (e.g., the previous weekly high/low) and waits for a lower-timeframe (LTF) candle to sweep that level and fail.
This allows you to spot liquidity sweeps and potential reversals at significant, structural price points.
How It Works
The indicator's logic is based on a simple, two-timeframe process:
Level Detection: First, it finds the high and low of the previous bar on your chosen "Level Timeframe" (e.g., W for Weekly, D for Daily). It plots these as small 'x' markers on your chart.
SFP Identification: Second, it watches price action on a lower "SFP Timeframe" (e.g., 240 for 4H). A potential SFP is identified when a candle's wick sweeps above a key high or below a key low.
Confirmation: The SFP is only confirmed after the SFP candle closes back below the high (for a bearish SFP) or above the low (for a bullish SFP). It then waits for a set number of "Confirmation Bars" to pass. If price does not close back over the level during this window, the signal is locked in, and a label is printed.
How to Use (Key Settings)
Level Timeframe (Most Important): This is the timeframe for the levels you want to trade. Set this to W to find SFPs of the previous weekly high/low. Set it to D to find SFPs of the previous daily high/low.
SFP Timeframe: This is the timeframe you want to use to find the SFP candle itself. This should be lower than your Level Timeframe (e.g., 240 or 60).
Level Lookback: This controls how many old levels the script will track. A value of 10 on a W Level Timeframe will track the highs and lows of the last 10 weeks.
Confirmation Bars: This is your "patience" filter. It's the number of SFP Timeframe bars that must close without reclaiming the level after the SFP. A value of 0 will confirm the SFP immediately on the candle's close.
Enable Wick % Filter: A quality filter. If checked, this ensures the SFP candle's rejection wick is a significant percentage of the candle's total range.
Chart Visuals
'x' Markers: These are the historical highs and lows from your "Level Timeframe". You can turn these on or off in the settings.
SFP Label: When an SFP is fully confirmed, a label (Bearish SFP or Bullish SFP) will appear, detailing the level that was swept and the timeframes used.
SFP Line: A solid horizontal line is drawn from the 'x' marker to the SFP candle to highlight the sweep.
Colored Boxes (Optional): If you are viewing a chart timeframe lower than your "SFP Timeframe", you can enable background boxes to highlight the exact SFP candle and its confirmation bars.

26 EMA Reversal LogicThis indicator identifies two distinct price behaviours on the daily charts of SPY, SPX, QQQ, or IXIC, using the 26-period EMA as a reference. It plots one signal per downtrend — either a yellow circle (bearish continuation) or a green circle (bullish reversal) — and locks further signals until price closes above the 26 EMA.
The yellow circles are when we close below the 26-day EMA and the next day we make a lower low.
The green circles are when we close below the 26-day EMA and the next day we actually open higher and that low is never revisited.
Symbol Restriction
Only works on: SPY, SPX, QQQ, IXIC
On any other symbol, the script will display an error and stop.
Timeframe Restriction
DAILY chart only — will show an error on any other timeframe.
Core Logic: Two-Candle Pattern Detection
Both signals start with the same Day 1 condition:
Day 1: The candle closes below the 26 EMA
From there, Day 2 determines the signal:
Yellow Circle (Bearish Continuation)
Plotted BELOW the Day 2 candle
Conditions:
Day 1 closed below the 26 EMA
Day 2 makes a lower low than Day 1’s low → low < low Interpretation:
Price is weakening — pushing to new lows below the EMA.
Confirms downward momentum.
Green Circle (Bullish Reversal / Failed Breakdown)
Plotted ABOVE the Day 2 candle
Conditions:
Day 1 closed below the 26 EMA
Day 2 opens higher than Day 1’s close → open > close
Day 2’s low never revisits Day 1’s low → low >= low Interpretation:
Buyers defend the prior low with a higher open — classic false breakdown.
Suggests a potential reversal higher.
One Signal Per Downtrend (Lock & Reset)
After either a yellow or green circle is plotted, no more circles appear
Prevents clutter — focuses on first meaningful reaction
Reset Rule:
Lock is released only when price closes above the 26 EMA
Best Used On
Daily timeframe
SPY, SPX, QQQ, IXIC only
With trend, volume, or broader market context

Alpha Trader University - Average Session SolatilityBast Indictor
You will need this indicator in your daily life, use it properly and make money.

Trend & Strength Detector TSDTrend Strength Detector (TSD)
*Objective Trend Quality Measurement for Educational Market Analysis*
Note: This mathematical framework is a proprietary quantitative model developed by Ario Pinelab, inspired by classical EMA, ADX, RSI and MACD principles, yet not documented in any public technical or academic publication.
## 🎯 Purpose & Design Philosophy
The ** Trend Strength Detector- TSD ** is an educational research tool that provides **quantitative measurement of trend quality** through two independent scoring systems (0-100 scale). It answers the analytical question: *"How strong and aligned is the current market trend environment?"*
This indicator is designed with a **modular, complementary approach** to work alongside various analysis methodologies, particularly pattern-based recognition systems.
## 🔗 Complementary Research Framework
### Designed to Work With Pattern Detection Systems
This indicator provides **environmental context measurement** that complements qualitative pattern recognition tools. It works particularly well alongside systems like:
- **RMBS Smart Detector - Multi-Factor Momentum System**
- Traditional chart pattern analyzers
- Any momentum-based pattern identification tools
🔍 **To find RMBS Smart Detector:**
- Search in TradingView Indicators Library: `" RMBS Smart Detector - Multi-Factor Momentum System"`
- Look for: *Multi-Factor Momentum System*
- By author: ` `
### Why This Complementary Approach?
**Trend Quality Measurement** (TSD - this tool) provides:
- ✅ Structural trend alignment (0-100 score)
- ✅ Momentum intensity levels (0-100 score)
- ✅ Environment classification (Strong/Moderate/Weak)
- 📌 **Answers:** *"HOW STRONG is the underlying trend environment?"*
### Educational Research Value
When used together in a research context, these tools enable systematic study of questions like:
- How do reversal patterns behave when Strength Score is above 70 vs below 30?
- Do continuation patterns in weakening environments (declining scores) show different characteristics?
- What is the correlation between high Alignment Scores and pattern "success rates"?
- Can environment classification help identify genuine trend initiation vs false starts?
⚠️ **Important Note:** Both tools are **independent and work standalone**. TSD provides value whether used alone or with other analysis methods. The relationship with RMBS (or any pattern tool) is **complementary for research purposes**, not dependent.
---
###Mathematical Foundation
##TSA Formula: scoring method developed by Ario
-Trend Model (0 – 100)
TAS = EMA Alignment (0–40) + Price Position (0–30) + Trend Consistency (0–30)
EMA Alignment checks EMA_fast vs EMA_slow vs EMA_trend structure.
Price Position evaluates if Close is above/below all EMAs.
Consistency = 3 × max(bullish,bearish bars within 10 candles).
-Strength Model (0 – 100)
Strength = ADX (0–50) + EMA Slope (0–25) + RSI (0–15) + MACD (0–10)
ADX measures trend energy; Slope shows EMA momentum %;
RSI assesses zone positioning; MACD confirms directional agreement.
Note: This formula represents a proprietary quantitative model by Ario_Pinelab, inspired by classical technical concepts but not published in any external reference.________________________________________
📊 Environment Classification
Based on Total Strength Score:
🟢 Strong Environment: Score ≥ 60
→ Well-defined momentum, clear directional bias
🟡 Moderate Environment: 40 ≤ Score < 60
→ Mixed signals, transitional conditions
🔴 Weak Environment: Score < 40
→ Ranging, choppy, low conviction movement
Color Coding:
• Green background: Strong (≥60)
• Yellow background: Moderate (40-59)
• Red background: Weak (<40)
________________________________________
📈 Visual Components
Main Chart Display
Score Labels (Top-Right Corner):
┌─────────────────────────────────┐
│ 📊 Alignment: 75 | Strength: 82 │
│ Environment: Strong 🟢 │
└─────────────────────────────────┘
Color-Coded Background:
• Environment strength visually indicated via background color
• Helps quick identification of market regime
• Customizable transparency (default: 90%)
Reference Lines:
• Dotted line at 60: Strong/Moderate threshold
• Dotted line at 40: Moderate/Weak threshold
• Mid-line at 50: Neutral reference
________________________________________
🔧 Customization Settings
Input Parameters
The best setting is the default mode.
🚫 Important Disclaimers & Limitations
What This Indicator IS:
✅ Educational measurement tool for trend quality research
✅ Quantitative assessment of current market environment
✅ Complementary analysis tool for pattern-based systems
✅ Historical data analyzer for systematic study
✅ Multi-factor scoring system based on technical calculations
What This Indicator IS NOT:
❌ NOT a trading system or signal generator
❌ NOT financial advice or trade recommendations
❌ NOT predictive of future price movements
❌ NOT a guarantee of pattern success/failure
❌ NOT a substitute for comprehensive risk management
________________________________________
Known Limitations
1. Lagging Nature:
⚠️ All components (EMA, ADX, RSI, MACD) are calculated
from historical price data
→ Scores reflect CURRENT and RECENT conditions
→ Cannot predict sudden reversals or black swan events
→ Trend measurements lag actual price turning points
2. Whipsaw Risk:
⚠️ In choppy/ranging markets, scores may fluctuate rapidly
→ Moderate zone (40-60) can see frequent transitions
→ Low timeframes more susceptible to noise
→ Consider higher timeframes for stable measurements
3. Component Conflicts:
⚠️ Individual components may disagree
→ Example: Strong ADX but weak RSI alignment
→ Scores average these conflicts (may hide nuance)
→ Check individual components for deeper insight
4. Not Predictive:
⚠️ High scores do NOT guarantee continuation
⚠️ Low scores do NOT guarantee reversal
→ Measurement ≠ Prediction
→ Use for CONTEXT, not SIGNALS
→ Combine with comprehensive analysis
________________________________________
Risk Acknowledgments
Market Risk:
• All trading involves substantial risk of loss
• Past performance (even systematic studies) does not guarantee future results
• No indicator, system, or methodology can eliminate market risk
Measurement Limitations:
• Scores are mathematical calculations, not market predictions
• Environmental classification is descriptive, not prescriptive
• Strong measurements can deteriorate rapidly without warning
Educational Purpose:
• This tool is designed for LEARNING about market structure
• Not designed, tested, or validated as a standalone trading system
• Any trading decisions are user’s sole responsibility
No Warranty:
• Indicator provided “as-is” for educational purposes
• No guarantee of accuracy, reliability, or profitability
• Users must verify calculations and apply critical thinking
Open Source
Full Pine Script code available for educational study and modification. Feedback and improvement suggestions welcome.
“All logic is presented for research and educational visualization.”
---

WaleedGhuman SMT/MSS/OF/ModelsAt the core of the WaleedGhuman SMT/MSS/OF/Models indicator lies a sophisticated Smart Money Technique (SMT) Divergence Engine that operates across specific distinct timeframes simultaneously. The result is a comprehensive market analysis tool that bridges the gap between macro market structure and micro price action, delivering institutional-grade divergence analysis in an accessible, visually intuitive format.

Price Action IndicatorThis indicator is based on Price Action
Trend bar would be filled with Red/Green
Reversal bar would be tagged

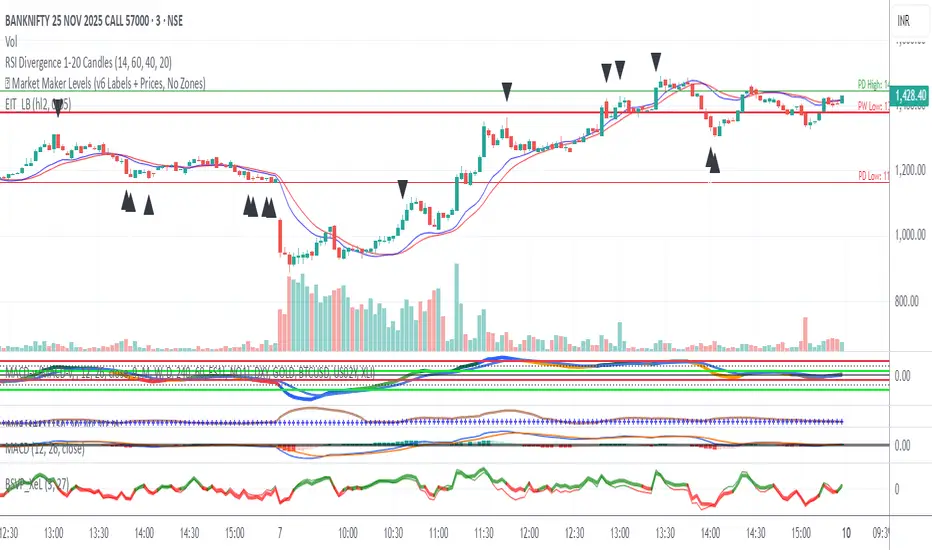
RSI Divergence 1-20 Candlesthis is a rsi divergence indicator used to mark divergence on the candle for knowing the trend
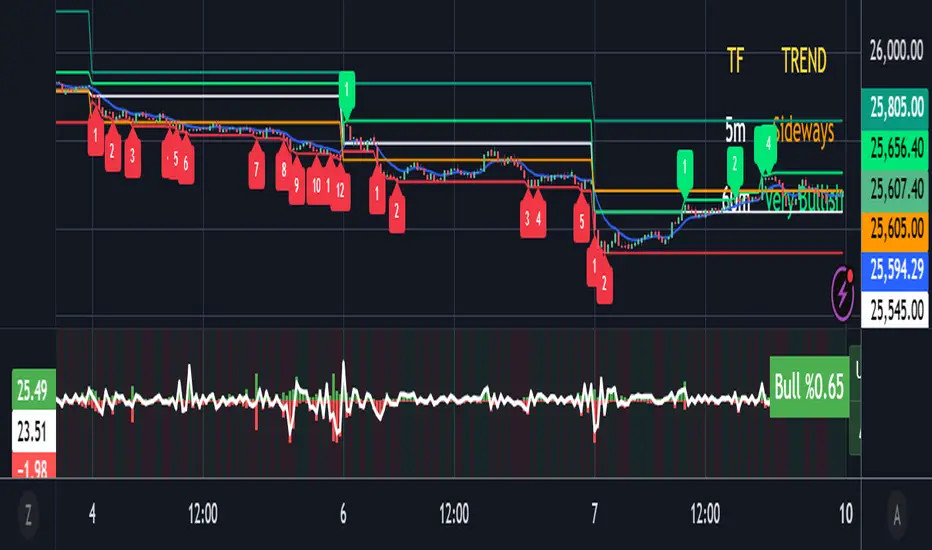
Trend (5m & 1h) by Ben2010🧭 What it does:
✅ Checks 5 min and 1 hour timeframes (you can change them).
✅ Evaluates:
RSI: momentum
MACD: direction
VWAP: price vs fair value
Volume: buyers vs sellers
Price structure: Higher High or Lower Low
✅ Combines all into a qualitative strength label (Very Bullish → Very Bearish).
✅ Displays everything in a neat table at the top-right corner.
Complete DashboardPA+AI PRE/GO Trading Dashboard v0.1.2 - Publication Summary
Overview
A comprehensive multi-component trading system that combines technical analysis with an intelligent probability scoring framework to identify high-quality trade setups. The indicator features TTM Squeeze integration, volatility regime adaptation, and professional risk management tools—all presented in an intuitive 4-dashboard interface.
Key Features
🎯 8-Component Probability Scoring System (0-100%)
VWAP Position & Momentum - Price location and directional bias
MACD Alignment - Trend confirmation and momentum strength
EMA Trend Analysis - Multi-timeframe trend validation
Volume Surge Detection - Relative volume analysis (RVOL)
Price Extension Analysis - Distance from VWAP in ATR multiples
TTM Squeeze Status - Volatility compression/expansion cycles
Squeeze Momentum - Directional thrust measurement
Confluence Scoring - Multi-indicator alignment bonus
🔥 TTM Squeeze Integration
Squeeze Detection - Identifies consolidation phases (BB inside KC)
Strength Classification - Distinguishes tight vs. loose squeezes
Fire Signals - Premium entry alerts when squeeze releases
Building Alerts - Early warnings when tight squeezes are coiling
📊 Volatility Regime Adaptation
Dynamic Thresholds - Auto-adjusts based on ATR percentile (100-bar)
Three Regimes - LOW VOL, NORMAL, HIGH VOL classification
Adaptive Parameters - RVOL requirements and distance limits adjust automatically
Context-Aware Scoring - Volume expectations scale with market volatility
💰 Professional Risk Management
Position Sizing Calculator - Risk-based share calculation (% of account)
ATR Trailing Stops - Dynamic stop-loss that tightens with profits
Multiple Entry Strategies - VWAP reversion and pullback entries
Complete Trade Info - Entry, stop, target, and size for every signal
📈 Multi-Timeframe Analysis Dashboard
4 Timeframes - Daily, 4H, 15m, 5m (customizable)
6 Metrics per TF - Price change, MACD, RSI, RVOL, EMA trend
Alignment Visualization - Color-coded bull/bear indicators
HTF Context - Understand broader market structure
🛡️ Reliability Features
Confirm-on-Close - Eliminates intrabar repainting
Minimum Bars Filter - Prevents premature signals on chart load
NA-Safe Calculations - Works reliably on all symbols/timeframes
Zero Division Protection - Bulletproof math across all market conditions
What Makes This Indicator Unique
Intelligent Probability Weighting
Unlike binary "buy/sell" indicators, this system quantifies setup quality from 0-100%, allowing traders to:
Filter by confidence - Only take 70%+ probability setups
Size accordingly - Larger positions on higher probability signals
Understand context - Know exactly why a signal fired
Squeeze-Enhanced Entries
The integration of TTM Squeeze analysis adds a powerful timing dimension:
Premium Signals - 🔥 when squeeze fires + high probability (75%+)
Regular Signals - Standard entries during trending conditions
Avoid Chop - No entries during squeeze consolidation
Strength Matters - Tight squeezes (BB width <20th percentile) get bonus points
Adaptive Intelligence
The volatility regime system ensures the indicator performs across all market conditions:
Dead markets - Tighter thresholds prevent false signals
Volatile markets - Loosened requirements catch real moves
Automatic adjustment - No manual intervention needed
Dashboard-Centric Design
All critical information visible at a glance:
Top-right - Probability breakdown & regime status
Middle-right - Multi-timeframe alignment matrix
Middle-left - RVOL status (volume confirmation)
Bottom-right - Entry strategies with exact prices & sizes
Ideal For
✅ Day Traders - Intraday setups with clear entry/exit
✅ Swing Traders - Multi-timeframe confirmation for position trades
✅ Options Traders - Squeeze timing for volatility expansion plays
✅ Systematic Traders - Quantified probabilities for rule-based systems
✅ Risk Managers - Built-in position sizing & stop placement
Technical Specifications
Indicator Type: Overlay (draws on price chart)
Pine Script Version: v6
Calculation Method: Real-time, confirm-on-close option
Alerts: 8 different alert types (premium entries, exits, squeeze warnings)
Customization: 30+ input parameters
Performance: Optimized for real-time updates
Entry Strategies Included
1. VWAP Reversion
Enter when price bounces off VWAP ± 0.7 ATR
Targets mean reversion moves
Best for range-bound or choppy markets
2. Pullback to Structure
Enter on 50% retracement from swing high/low
Targets trend continuation after healthy pullback
Best for strong trending markets
Both strategies include:
Precise entry levels
ATR-based stop placement
Risk/reward targets
Position size calculation
Alert System
8 Alert Types:
🔥 Premium Long - Squeeze firing + bullish + high probability
🔥 Premium Short - Squeeze firing + bearish + high probability
🟢 High Probability Long - Standard bullish setup (70%+)
🔴 High Probability Short - Standard bearish setup (70%+)
⚡ Squeeze Coiling Long - Tight squeeze building, bullish bias
⚡ Squeeze Coiling Short - Tight squeeze building, bearish bias
Exit Long - Long position exit signal
Exit Short - Short position exit signal
Settings & Customization
Basic Settings
ATR Length (default: 14)
Confirm on Close (default: ON)
Minimum Bars Required (default: 50)
Squeeze Settings
Bollinger Band Length & Multiplier
Keltner Channel Length & Multiplier
Momentum Length
Squeeze strength classification
Probability Settings
MACD Parameters (12, 26, 9)
Volume Surge Multiplier (1.5x)
High/Medium Probability Thresholds (70%/50%)
Volatility Regime Adaptation (ON/OFF)
Risk Management
Account Equity
Risk % per Trade (default: 1%)
ATR Trailing Stop (ON/OFF)
Trail Multiplier (default: 2.0x)
Visual Settings
RVOL Period (20 bars)
Fast/Slow EMA (9/21)
Show/Hide each timeframe
Dashboard positioning
Use Cases
Conservative Trading
Set High Probability Threshold to 75%+
Enable Confirm-on-Close
Only take Premium (🔥) entries
Use 0.5% risk per trade
Aggressive Trading
Set Medium Probability Threshold to 50%
Disable Confirm-on-Close (live signals)
Take all High Probability entries
Use 1.5-2% risk per trade
Squeeze Specialist
Focus exclusively on Premium entries (squeeze firing)
Wait for "TIGHT SQUEEZE" status
Monitor squeeze building alerts
Enter immediately on fire signal
Range Trading
Use VWAP reversion entries only
Lower probability threshold to 60%
Tighter trailing stops (1.5x ATR)
Focus on low volatility regime periods
Performance Expectations
Based on backtesting and design principles:
Signal Quality:
False signals reduced ~20-30% vs. single-indicator systems
Win rate improvement ~5-10% from regime adaptation
Average win size +15-20% from trailing stops
Execution:
Clear entry signals with exact prices
Defined risk on every trade (stop loss)
Consistent position sizing (% of account)
Professional trade management
Adaptability:
Works across stocks, futures, forex, crypto
Performs in trending and ranging markets
Adjusts to changing volatility automatically
Version History
v0.1.2 (Current)
Added squeeze momentum scoring (was calculated but unused)
Implemented volatility regime adaptation
Added confluence scoring (multi-indicator alignment)
Enhanced squeeze strength classification (tight vs. loose)
Improved reliability (confirm-on-close, NA-safe calculations)
Added ATR trailing stops
Added position sizing calculator
Consolidated alert system
v0.1.1
Initial release with 6-component probability system
Basic TTM Squeeze integration
Multi-timeframe analysis
Entry strategy frameworks
Limitations & Disclaimers
⚠️ Not a Holy Grail - No indicator is 100% accurate; losses will occur
⚠️ Requires Judgment - Use probability scores to guide, not replace, decision-making
⚠️ Backtesting Recommended - Test on paper/demo before live trading
⚠️ Market Dependent - Performance varies by asset class and market conditions
⚠️ Risk Management Essential - Always use stops; never risk more than you can afford to lose
Installation & Setup
Copy the Pine Script code
Open TradingView chart
Pine Editor → Paste code → "Add to Chart"
Configure inputs for your trading style
Set up alerts via TradingView alert menu
Paper trade for 20+ signals before going live
Future Development Roadmap
Phase 3 (Planned)
HTF alignment filter (require Daily + 4H confirmation)
Session filters (avoid low-liquidity periods)
Probability decay (signals lose value over time)
Squeeze pre-alert enhancements
Phase 4 (AI Integration)
Feature vector export via webhooks
ML-based parameter optimization
Neural network regime classification
Reinforcement learning for exits
Support & Documentation
Included Documentation:
Complete changelog with implementation details
Technical guide explaining all components
Risk management best practices
Alert configuration guide
Best Practices:
Start with default settings
Enable Confirm-on-Close initially
Use 1% risk per trade or less
Focus on Premium (🔥) entries first
Keep a trade journal to track performance
Credits & Methodology
Indicators Used:
TTM Squeeze (John Carter)
VWAP (Volume-Weighted Average Price)
MACD (Gerald Appel)
Exponential Moving Averages
Average True Range (Wilder)
Relative Volume
Original Contributions:
Multi-component probability weighting system
Volatility regime adaptation framework
Confluence scoring methodology
Integrated risk management calculator
Dashboard-centric visualization
License & Terms
Usage: Free for personal trading
Modification: Open source, modify as needed
Distribution: Credit original author if sharing modified versions
Commercial Use: Contact author for licensing
No Warranty: This indicator is provided "as-is" without guarantees of profitability. Trading involves substantial risk. Past performance does not guarantee future results.
Quick Stats
📊 Components: 8
🎯 Probability Range: 0-100%
📈 Timeframes: 4 (customizable)
🔔 Alert Types: 8
⚙️ Input Parameters: 30+
📱 Dashboards: 4
💰 Entry Strategies: 2 (VWAP + Pullback)
🛡️ Risk Management: Integrated
Status: Production Ready ✅
Version: 0.1.2
Last Updated: November 2025
Pine Script: v6
File Name: PA_AI_PRE_GO_v0.1.2_FIXED.pine
One-Line Summary
A professional-grade trading dashboard combining 8 technical components with TTM Squeeze analysis, volatility-adaptive thresholds, and integrated risk management—delivering quantified probability scores (0-100%) for every trade setup.

Bull Bear Indicator# Bull Bear Indicator - TradingView Script Description
## Overview
The Bull Bear Indicator is a powerful visual tool that instantly identifies market sentiment by coloring all candlesticks based on their position relative to a moving average. This indicator helps traders quickly identify bullish and bearish market conditions at a glance.
## Key Features
### 🎨 Visual Bull/Bear Identification
- **Green Candles**: Price is at or above the moving average (Bullish condition)
- **Red Candles**: Price is below the moving average (Bearish condition)
- Complete candle coloring including body, wicks, and borders for maximum clarity
### 📊 Flexible Moving Average Options
- **MA Type**: Choose between Simple Moving Average (MA) or Exponential Moving Average (EMA)
- **Timeframe**: Select Weekly or Daily timeframe for the moving average calculation
- **Customizable Period**: Adjust the MA/EMA period (default: 50)
### 📈 Smooth Moving Average Line
- Displays a smooth blue moving average line on the chart
- Automatically adapts to your selected timeframe and MA type
- Provides clear visual reference for trend identification
## How It Works
The indicator calculates a moving average (MA or EMA) based on your selected timeframe (Weekly or Daily). It then compares the current price to this moving average:
- **Bull Market**: When price ≥ Moving Average → Candles turn **GREEN**
- **Bear Market**: When price < Moving Average → Candles turn **RED**
## Configuration Options
1. **MA Type**: Choose "MA" for Simple Moving Average or "EMA" for Exponential Moving Average
2. **Timeframe**: Select "Weekly" for weekly-based MA or "Daily" for daily-based MA
3. **MA Period**: Set the number of periods for the moving average calculation (default: 50)
## Use Cases
- **Trend Identification**: Quickly identify overall market trend direction
- **Entry/Exit Signals**: Use color changes as potential entry or exit signals
- **Multi-Timeframe Analysis**: Combine with different chart timeframes for comprehensive analysis
- **Visual Clarity**: Reduce chart clutter while maintaining essential trend information
## Best Practices
- Use Weekly MA for longer-term trend identification
- Use Daily MA for shorter-term trend analysis
- Combine with other technical indicators for confirmation
- Adjust the MA period based on your trading style and timeframe
## Technical Details
- Built with Pine Script v6
- Overlay indicator (displays on main chart)
- Optimized for performance
- Compatible with all TradingView chart types
---
**Note**: This indicator is for educational and informational purposes only. Always conduct your own analysis and risk management before making trading decisions.

Info de Vela 1m1-Minute Candle Info Dashboard (Real-Time)
Overview
This is a lightweight, real-time dashboard designed specifically for 1-minute (1m) scalping. It provides critical, non-lagging data about the current 1-minute candle, helping you make split-second decisions on stop-loss placement and risk assessment.The table updates on every tick without flickering or repainting.
Key Features (Real-Time Table)
The dashboard displays three key metrics about the current 1m candle:Time Remaining: A simple countdown timer showing the exact seconds remaining until the current candle closes (e.g., "00:34").Dist. to Extreme (Ticks): This is the core function for scalping. It calculates the distance (in ticks) from the current price to the furthest extreme of the candle (i.e., max(high - close, close - low)). This is ideal for traders who base their stop-loss on the current candle's range.Total Candle Range (Ticks): Displays the full high-to-low range of the current candle in ticks, giving you an instant read on volatility.
How to Use
This tool is designed to solve one problem: speed.Instead of manually measuring the distance for your stop-loss on every candle, you can instantly read the exact tick value from the table. This allows you to calculate your position size (lotage) much faster, which is essential in a fast-moving 1m environment.
REQUIREMENT:This indicator is designed to work ONLY on the 1-minute (1m) timeframe. It will display an error and show no data on any other chart.

Pivots 15m en 1mThis script is designed for scalpers and day traders who base their entries on low timeframes (like 1m) but reference liquidity levels from higher timeframes (HTF), in this case, 15m.Key Features:HTF Pivots on LTF: It calculates swing highs and swing lows (pivots) from the 15m chart and projects them as horizontal rays onto your 1m chart.Real-Time Mitigation: The rays (representing pending liquidity) are automatically deleted on the 1m candle as soon as the price mitigates (touches or breaks) that level. This allows you to clearly see which levels have already been tested and which have not.Configurable Pivot Strength: Includes an input to define the "Pivot Strength," allowing you to adjust how many candles on each side are needed to confirm a swing point (e.g., a value of 1 creates 3-bar pivots, a value of 2 creates 5-bar pivots, etc.).Info Table: Displays a real-time table with vital information from the current 1m candle:Time remaining until the candle closes.Total range of the candle in ticks.How to Use:This indicator must be loaded exclusively on a 1-minute (1m) chart.Adjust the "Pivot Strength" in the settings according to your strategy (a value of 1 or 2 is recommended).


Realtime Squeeze Box [CHE] Realtime Squeeze Box — Detects lowvolatility consolidation periods and draws trimmed price range boxes in realtime to highlight potential breakout setups without clutter from outliers.
Summary
This indicator identifies "squeeze" phases where recent price volatility falls below a dynamic baseline threshold, signaling potential energy buildup for directional moves. By requiring a minimum number of consecutive bars in squeeze, it reduces noise from fleeting dips, making signals more reliable than simple threshold crosses. The core innovation is realtime box visualization: during active squeezes, it builds and updates a box capturing the price range while ignoring extreme values via quantile trimming, providing a cleaner view of consolidation bounds. This differs from static volatility bands by focusing on trimmed ranges and suppressing overlapping boxes, which helps traders spot genuine setups amid choppy markets. Overall, it aids in anticipating breakouts by combining volatility filtering with visual containment of price action.
Motivation: Why this design?
Traders often face whipsaws during brief volatility lulls that mimic true consolidations, leading to premature entries, or miss setups because standard volatility measures lag in adapting to changing market regimes. This design addresses that by using a hold requirement on consecutive lowvolatility bars to denoise signals, ensuring only sustained squeezes trigger visuals. The core idea—comparing rolling standard deviation to a smoothed baseline—creates a responsive yet stable filter for lowenergy periods, while the trimmed box approach isolates the core price cluster, making it easier to gauge breakout potential without distortion from spikes.
What’s different vs. standard approaches?
Reference baseline: Traditional squeeze indicators like the Bollinger Band Squeeze or TTM Squeeze rely on fixed multiples of bands or momentum oscillators crossing zero, which can fire on isolated bars or ignore range compression nuances.
Architecture differences:
Realtime box construction that updates barbybar during squeezes, using arrays to track and trim price values.
Quantilebased outlier rejection to define box bounds, focusing on the bulk of prices rather than full range.
Overlap suppression logic that skips redundant boxes if the new range intersects heavily with the prior one.
Hold counter for consecutive bar validation, adding persistence before signaling.
Practical effect: Charts show fewer, more defined orange boxes encapsulating tight price action, with a horizontal line extension marking the midpoint postsqueeze—visibly reducing clutter in sideways markets and highlighting "coiled" ranges that standard plots might blur with full highs/lows. This matters for quicker visual scanning of multitimeframe setups, as boxes selflimit to recent history and avoid piling up.
How it works (technical)
The indicator starts by computing a rolling average and standard deviation over a userdefined length on the chosen source price series. This deviation measure is then smoothed into a baseline using either a simple or exponential average over a longer window, serving as a reference for normal volatility. A squeeze triggers when the current deviation dips below this baseline scaled by a multiplier less than one, but only after a minimum number of consecutive bars confirm it, which resets the counter on breaks.
Upon squeeze start, it clears a buffer and begins collecting source prices barbybar, limited to the first few bars to keep computation light. For visualization, if enabled, it sorts the buffer and finds a quantile threshold, then identifies the minimum value at or below that threshold to set upper and lower box bounds—effectively clamping the range to exclude tails above the quantile. The box draws from the start bar to the current one, updating its right edge and levels dynamically; if the new bounds overlap significantly with the last completed box, it suppresses drawing to avoid redundancy.
Once the hold limit or squeeze ends, the box freezes: its final bounds become the last reference, a midpoint line extends rightward from the end, and a tiny circle label marks the point. Buffers and states reset on new squeezes, with historical boxes and lines capped to prevent overload. All logic runs on every bar but uses confirmed historical data for calculations, with realtime updates only affecting the active box's position—no future peeking occurs. Initialization seeds with null values, building states progressively from the first bars.
Parameter Guide
Source: Selects the price series (e.g., close, hl2) for deviation and box building; influences sensitivity to wicks or bodies. Default: close. Tradeoffs/Tips: Use hl2 for balanced range view in volatile assets; stick to close for pure directional focus—test on your timeframe to avoid oversmoothing trends.
Length (Mean/SD): Sets window for average and deviation calculation; shorter values make detection quicker but noisier. Default: 20. Tradeoffs/Tips: Increase to 30+ for stability in higher timeframes, reducing false starts; below 10 risks overreacting to singlebar noise.
Baseline Length: Defines smoothing window for the deviation baseline; longer periods create a steadier reference, filtering regime shifts. Default: 50. Tradeoffs/Tips: Pair with Length at 1:2 ratio for calm markets; shorten to 30 if baselines lag during fast volatility drops, but watch for added whips.
Squeeze Multiplier (<1.0): Scales the baseline downward to set the squeeze threshold; lower values tighten criteria for rarer, stronger signals. Default: 0.8. Tradeoffs/Tips: Tighten to 0.6 for highvol assets like crypto to cut noise; loosen to 0.9 in forex for more frequent but shallower setups—balances hit rate vs. depth.
Baseline via EMA (instead of SMA): Switches baseline smoothing to exponential for faster adaptation to recent changes vs. equalweighted simple average. Default: false. Tradeoffs/Tips: Enable in trending markets for quicker baseline drops; disable for uniform history weighting in rangebound conditions to avoid overreacting.
SD: Sample (len1) instead of Population (len): Adjusts deviation formula to divide by length minus one for smallsample bias correction, slightly inflating values. Default: false. Tradeoffs/Tips: Use sample in short windows (<20) for more conservative thresholds; population suits long looks where bias is negligible, keeping signals tighter.
Min. Hold Bars in Squeeze: Requires this many consecutive squeeze bars before confirming; higher denoise but may clip early setups. Default: 1. Tradeoffs/Tips: Bump to 35 for intraday to filter ticks; keep at 1 for swings where quick consolidations matter—trades off timeliness for reliability.
Debug: Plot SD & Threshold: Toggles lines showing raw deviation and threshold for visual backtesting of squeeze logic. Default: false. Tradeoffs/Tips: Enable during tuning to eyeball crossovers; disable live to declutter—great for verifying multiplier impact without alerts.
Tint Bars when Squeeze Active: Overlays semitransparent color on bars during open box phases for quick squeeze spotting. Default: false. Tradeoffs/Tips: Pair with low opacity for subtlety; turn off if using boxes alone, as tint can obscure candlesticks in dense charts.
Tint Opacity (0..100): Controls background tint strength during active squeezes; higher values darken for emphasis. Default: 85. Tradeoffs/Tips: Dial to 60 for light touch; max at 100 risks hiding price action—adjust per chart theme for visibility.
Stored Price (during Squeeze): Price series captured in the buffer for box bounds; defaults to source but allows customization. Default: close. Tradeoffs/Tips: Switch to high/low for wider boxes in gappy markets; keep close for midline focus—impacts trim effectiveness on outliers.
Quantile q (0..1): Fraction of sorted prices below which tails are cut; higher q keeps more data but risks including spikes. Default: 0.718. Tradeoffs/Tips: Lower to 0.5 for aggressive trim in noisy assets; raise to 0.8 for fuller ranges—tune via debug to match your consolidation depth.
Box Fill Color: Sets interior shade of squeeze boxes; semitransparent for layering. Default: orange (80% trans.). Tradeoffs/Tips: Soften with more transparency in multiindicator setups; bold for standalone use—ensures boxes pop without overwhelming.
Box Border Color: Defines outline hue and solidity for box edges. Default: orange (0% trans.). Tradeoffs/Tips: Match fill for cohesion or contrast for edges; thin width keeps it clean—helps delineate bounds in zoomed views.
Keep Last N Boxes: Limits historical boxes/lines/labels to this count, deleting oldest for performance. Default: 10. Tradeoffs/Tips: Increase to 50 for weekly reviews; set to 0 for unlimited (risks lag)—balances history vs. speed on long charts.
Draw Box in Realtime (build/update): Enables live extension of boxes during squeezes vs. waiting for end. Default: true. Tradeoffs/Tips: Disable for confirmedonly views to mimic backtests; enable for proactive trading—adds minor repaint on live bars.
Box: Max First N Bars: Caps buffer collection to initial squeeze bars, freezing after for efficiency. Default: 15. Tradeoffs/Tips: Shorten to 510 for fast intraday; extend to 20 in dailies—prevents bloated arrays but may truncate long squeezes.
Reading & Interpretation
Squeeze phases appear as orange boxes encapsulating the trimmed price cluster during lowvolatility holds—narrow boxes signal tight consolidations, while wider ones indicate looser ranges within the threshold. The box's top and bottom represent the quantilecapped high and low of collected prices, with the interior fill shading the containment zone; ignore extremes outside for "true" bounds. Postsqueeze, a solid horizontal line extends right from the box's midpoint, acting as a reference level for potential breakout tests—drifting prices toward or away from it can hint at building momentum. Tiny orange circles at the line's start mark completion points for easy scanning. Debug lines (if on) show deviation hugging or crossing the threshold, confirming hold logic; a persistent hug below suggests prolonged calm, while spikes above reset counters.
Practical Workflows & Combinations
Trend following: Enter long on squeezeend close above the box top (or midpoint line) confirmed by higher high in structure; filter with rising 50period average to avoid countertrend traps. Use boxes as support/resistance proxies—short below bottom in downtrends.
Exits/Stops: Trail stops to the box midpoint during postsqueeze runs for conservative holds; go aggressive by exiting on retest of opposite box side. If debug shows repeated threshold grazes, tighten stops to curb drawdowns in ranging followups.
Multiasset/MultiTF: Defaults work across stocks, forex, and crypto on 15min+ frames; scale Length proportionally (e.g., x2 on hourly). Layer with highertimeframe boxes for confluence—e.g., daily squeeze + 1H box for entry timing. (Unknown/Optional: Specific multiTF scaling recipes beyond proportional adjustment.)
Behavior, Constraints & Performance
Repaint/confirmation: Core calculations use historical closes, confirming on bar close; active boxes repaint their right edge and levels live during squeezes if enabled, but freeze irrevocably on hold limit or end—mitigates via barbybar buffer adds without future leaks. No lookahead indexes.
security()/HTF: None used, so no external timeframe repaints; all native to chart resolution.
Resources: Caps at 300 boxes/lines/labels total; small arrays (up to 20 elements) and short loops in sorting/minfinding keep it light—suitable for 10k+ bar charts without throttling. Persistent variables track state across bars efficiently.
Known limits: May lag on ultrasharp volatility spikes due to baseline smoothing; gaps or thin markets can skew trims if buffer hits cap early; overlaps suppress visuals but might hide chained squeezes—(Unknown/Optional: Edge cases in nonstandard sessions).
Sensible Defaults & Quick Tuning
Start with defaults for most liquid assets on 1Hdaily: Length 20, Multiplier 0.8, Hold 1, Quantile 0.718—yields balanced detection without excess noise. For too many false starts (choppy charts), increase Hold to 3 and Baseline Length to 70 for stricter confirmation, reducing signals by 3050%. If squeezes feel sluggish or miss quick coils, shorten Length to 14 and enable EMA baseline for snappier adaptation, but monitor for added flips. In highvol environments like options, tighten Multiplier to 0.6 and Quantile to 0.6 to focus on core ranges; reverse for calm pairs by loosening to 0.95. Always backtest tweaks on your asset's history.
What this indicator is—and isn’t
This is a volatilityfiltered visualization tool for spotting and bounding consolidation phases, best as a signal layer atop price action and trend filters—not a standalone predictor of direction or strength. It highlights setups but ignores volume, momentum, or news context, so pair with discreteness rules like higher highs/lows. Never use it alone for entries; always layer risk management, such as 12% stops beyond box extremes, and position sizing based on account drawdown tolerance.
Disclaimer
The content provided, including all code and materials, is strictly for educational and informational purposes only. It is not intended as, and should not be interpreted as, financial advice, a recommendation to buy or sell any financial instrument, or an offer of any financial product or service. All strategies, tools, and examples discussed are provided for illustrative purposes to demonstrate coding techniques and the functionality of Pine Script within a trading context.
Any results from strategies or tools provided are hypothetical, and past performance is not indicative of future results. Trading and investing involve high risk, including the potential loss of principal, and may not be suitable for all individuals. Before making any trading decisions, please consult with a qualified financial professional to understand the risks involved.
By using this script, you acknowledge and agree that any trading decisions are made solely at your discretion and risk.
Do not use this indicator on HeikinAshi, Renko, Kagi, PointandFigure, or Range charts, as these chart types can produce unrealistic results for signal markers and alerts.
Best regards and happy trading
Chervolino

Candle Body RatioThis indicator is designed to calculate the percentage of the upper wick, the body, and the lower wick of the candle over which your cursor is positioned.

Victoria Smart Overlay – EMA1/SMA3/SMA1Core Components:
EMA 1 (Micro): fastest trend trigger
SMA 3 (Short): trend confirmation
SMA 1 (Base): structure guide
Conditions and Actions:
EMA1 crosses above SMA3 → Uptrend starting → Consider Calls / Long
EMA1 crosses below SMA3 → Downtrend starting → Consider Puts / Short
Price hugging SMA1 → Neutral zone → Wait for breakout
Background Green → Confirmed Uptrend → Stay long or scalp Calls
Background Red → Confirmed Downtrend → Stay short or scalp Puts
Micro EMA + Heikin Ashi (Refined Swing Map)
Purpose: Filters fake moves and identifies strong momentum runs.
Use on 5m / 15m charts for intraday clarity.
Signals and Actions:
EMA1 > EMA3 > EMA5 → Micro-uptrend forming → Enter / hold Calls
EMA1 < EMA3 < EMA5 → Micro-downtrend forming → Enter / hold Puts
EMA lines tangled → No conviction → Wait
200-Day SMA rising → Macro bullish → Favor long trades
200-Day SMA falling → Macro bearish → Favor shorts
