OmniTraderOmniTrader — What It Does
A pragmatic intraday toolkit that keeps your chart readable while surfacing the levels traders actually use: EMAs across timeframes, VWAP, yesterday’s high/low, Asian/London/NY session ranges, and a configurable Opening Range Breakout (ORB).
Multi-Timeframe EMAs (EMA 1 & 2) — Pick any TF per EMA (e.g., 5m EMA on a 1m chart).
VWAP — Toggle on/off for quick mean/flow context.
Session High/Low (live → frozen)
Tracks Asian / London / New York in your chart/exchange timezone.
Rays auto-extend; labels optional.
Previous Day High/Low — Daily levels with optional labels; auto-resets each new day.
Opening Range Breakout (ORB)
Choose session (NY/London/Asian) and 15m or 30m window.
Levels update live during the window, then lock.
Separate colors for ORB High & ORB Low + labels.
Style & Clarity Controls — Per-group color pickers, line width/style, label size & visibility.
Designed to minimize clutter while keeping essentials visible.
Candlestick analysis


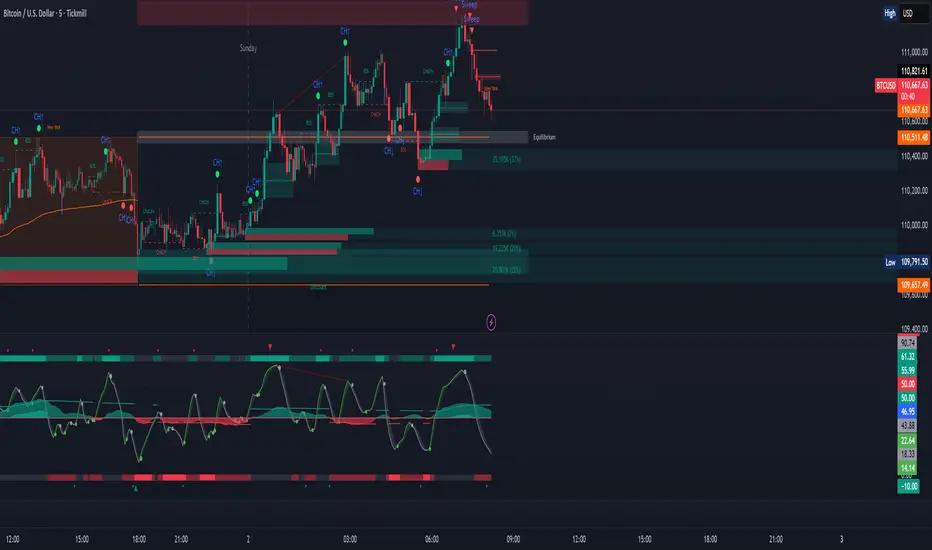
R Dominant Range [CRT] by Sergi SernaR Dominant Range identifies the most influential R range located to the left of the current price action. It highlights the dominant zone that still impacts market behavior, helping traders understand which range is controlling the current structure.

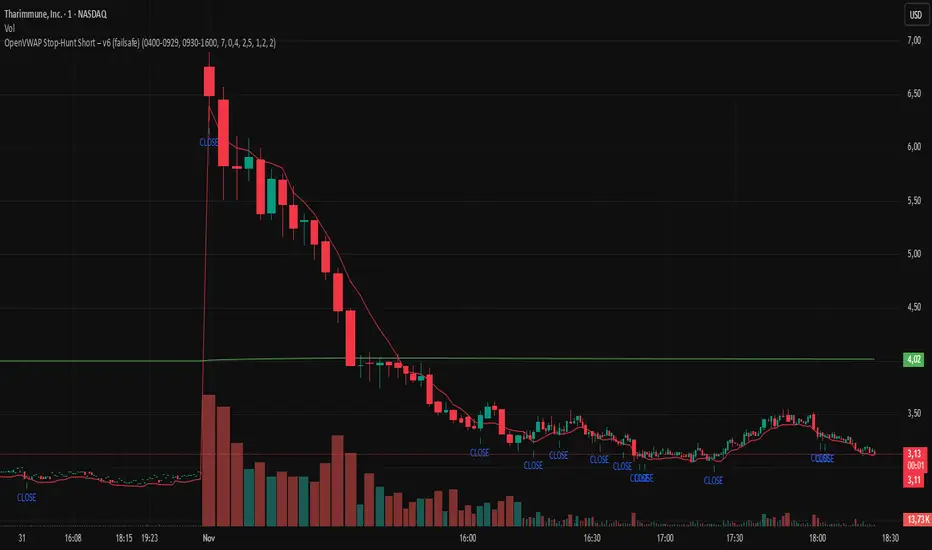
OpenVWAP Stop-Hunt Short – v6 (failsafe) ZorzOpenVWAP Stop-Hunt Short (Micro/Nano Caps)
Intraday short framework for low-float gappers (NASDAQ/NYSE), optimized for 1m (optional 15s). The script anchors VWAP to Premarket and Regular sessions, tracks PM High (PM HOD) and Open VWAP, and flags liquidity grabs.
Signal logic
SHORT when a stop-hunt above PM HOD or an Open VWAP fakeout occurs and the bar closes below Open VWAP (optional confirmation: crossunder VWMA*0.985 “long50”).
CLOSE when price reclaims Open VWAP or crosses above long50.
Inputs
Min wick%, volume spike vs SMA20, range vs ATR(1)
No-trade bars after the open (filters first noisy minutes)
Toggle ACW confirmation (VWMA*0.985)
Notes
Turn Extended Hours ON; session times are ET.
Best on micro/nano-cap gappers with high PM volume; supports alerts (“Open Short”, “Close Short”).
For research/education only; not financial advice.
Monday 1H BODY Range → End of Week (solid + levels)lines marking out monday range with fibonacci extensions

Aibuyzone Vector Strategy - Floating DashboardVector Strategy – Floating Dashboard
The Vector Strategy is a visual trading-analysis tool designed to highlight strong directional candles that may represent impulsive moves in the market. It combines candle-structure analysis, volatility expansion, volume conditions, and trend filters into a single clear visual display.
Core Logic
Identifies candles where the body makes up a significant portion of the full bar range, suggesting strong directional intent.
Uses an ATR (Average True Range) expansion filter to confirm that the current candle’s range is larger than normal volatility.
Optionally applies a wick-imbalance requirement to favor bars showing a clear directional bias.
Can include a volume spike filter, marking candles where volume exceeds a moving average multiple.
Trend and Momentum Filters
Local trend: Defined by a fast and slow EMA pair to show short-term bias.
Higher-timeframe trend: Optionally aligns with an EMA from a higher timeframe to confirm broader momentum.
Momentum: RSI filter avoids generating signals in heavily overbought or oversold conditions.
Fair Value Gap (FVG) Option
When enabled, the script checks for a simple three-bar fair-value-gap structure in the direction of the potential signal, acting as an additional confirmation filter.
Signals and Visuals
Plots fast and slow EMAs to visualize the underlying trend.
Displays up/down shapes when qualifying vector-candle conditions occur.
Optional labels show “Vector Long” or “Vector Short” at the candle where conditions align.
Includes alert conditions for both long and short setups.
Floating Dashboard
A compact floating panel summarizes the most recent signal and market context:
Current signal state (Long / Short / Neutral)
Trend bias (Bullish / Bearish / Flat)
RSI reading
Body-to-range percentage
Volume-spike confirmation
Practical Use
This tool can assist traders in identifying strong impulsive candles aligned with a trend filter.
It is meant to complement a complete trading strategy, not to be used in isolation.
Traders may adjust thresholds such as ATR multiple, body-percentage, or RSI range based on the instrument’s volatility and personal risk tolerance.
Important Notice
This script is provided for educational and analytical purposes only.
It does not provide financial advice, recommendations, or guaranteed results.
Market conditions vary, and past performance does not ensure future outcomes.
Always test and validate any configuration in a simulated environment before live trading.

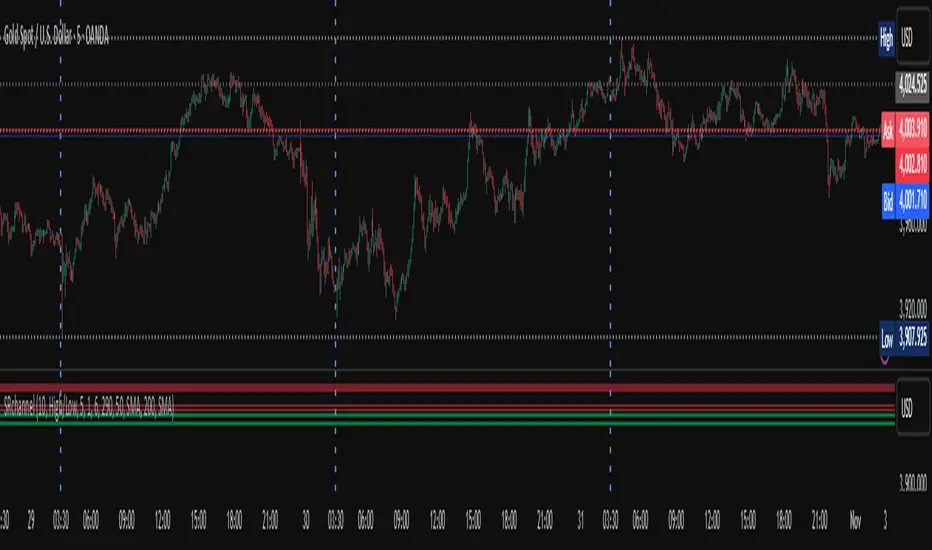
Session Dominator — Asia • London • New York Precision ZonesRule the global market sessions.
Session Dominator is a precision-engineered indicator built for traders who want total clarity across Asia, London, and New York sessions.
It automatically plots:
🔷 Dynamic Session Boxes — visually map institutional killzones in real time
⚙️ Session Mean Line — track equilibrium and liquidity shifts
📊 EMA-50 Confluence — align directional bias and intraday trend
🎯 BSL / SSL Levels — reveal active liquidity sweeps and reversals
💡 Bias Engine — evaluates structure and locks the session bias automatically
Toggle between Asia / London / New York / Overlap / Custom modes to dominate any timezone.
Designed with minimalist visuals, high precision, and ICT-based logic — this tool helps you anticipate where liquidity will be taken before it happens.
✳️ For XAUUSD traders, scalpers, and ICT-style analysts seeking sniper-level clarity.

Avg Candle Size (Ticks) – Last N Closed Barsaverage last 5 candles only useful if you are me really sorry

Short-Timeframe Volume Spike DetectorShort-Timeframe Volume Spike Detector
Description:
The Short-Timeframe Volume Spike Detector is an advanced multi-timeframe (MTF) indicator that automatically detects sudden volume surges and price expansion events on a lower timeframe and displays them on a higher (base) timeframe chart — helping traders identify hidden intraday accumulation or breakout pressure within broader candles.
⚙️ How It Works
Select a Base Timeframe (e.g., Daily, 4H, 1H).
The script automatically fetches data from a Lower Timeframe (e.g., Daily → 1H, 1H → 15m).
Within each base bar, it scans all the lower timeframe candles to find:
Volume Spikes: Volume exceeds average × multiplier or a custom threshold.
Price Strength: Candle shows upward movement beyond a minimum % change.
When both conditions are met, a spike signal is plotted on the higher timeframe chart.
🔍 Features
✅ Automatic Lower Timeframe Mapping — Dynamically selects the most relevant lower timeframe.
✅ Two Detection Modes:
Multiplier Mode: Volume spikes defined as multiple of average lower timeframe volume.
Manual Mode: Custom absolute volume threshold.
✅ Trend Filter Option: Show only signals during uptrends (configurable).
✅ Visual Markers:
Purple “X” = Volume Spike Detected
Dotted red & green lines = Candle range extension
✅ Custom Label Placement: Above High / Below Low / At Spike Price
✅ Debug Mode: Displays full diagnostic info including detected volume, threshold, and % change.
📊 Use Cases
Detect early accumulation in daily candles using hourly or 15-min data.
Identify institutional buying interest before visible breakouts.
Confirm strong continuation patterns after price compression.
Spot hidden intraday activity on swing or positional charts.
🧩 Inputs Overview
Input Description
Base Timeframe Main chart timeframe for analysis
Lookback Bars Number of recent candles to scan
Volume Mode “Multiplier” or “Manual Benchmark”
Volume Multiplier Multiplier applied to average lower timeframe volume
Manual Volume Threshold Fixed volume benchmark
Min Price Change % Minimum lower timeframe candle % move to qualify
Use Trend Filter Only show in uptrend (close > close )
Extend Bars Number of bars to extend dotted lines
Label Position Choose Above High / Below Low / At Spike Price
Debug Mode Show live internal values for calibration
🧠 Tips
Ideal for swing traders and multi-timeframe analysts.
Works best when base = Daily and lower = Hourly or 15m.
Combine with Volume Profile, VWAP, or RRG-style analysis for stronger confluence.
Use Multiplier 1.5–2.5 to fine-tune for your asset’s volatility.
⚠️ Notes
Works only when applied to the base timeframe selected in inputs.
May not display signals on non-standard intraday timeframes (like 3H).
Labels limited to max_labels_count for performance stability.

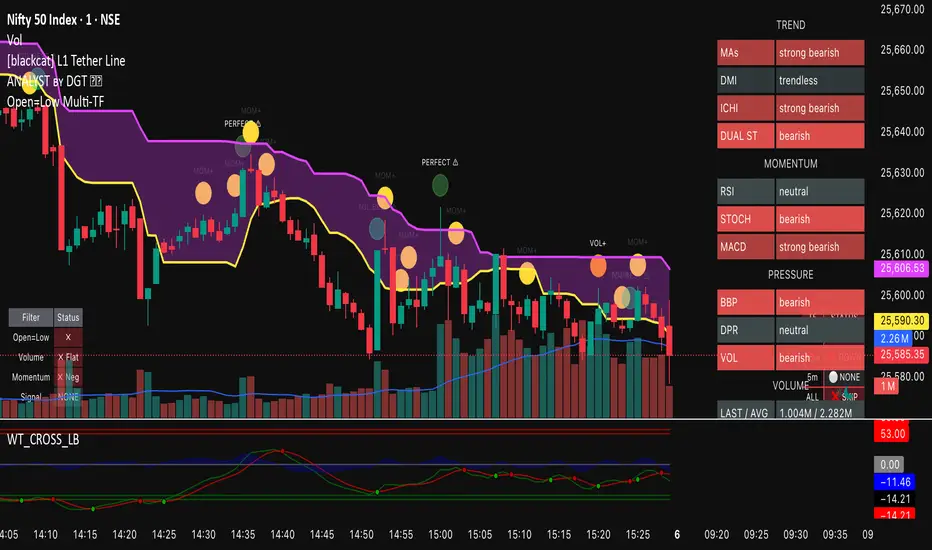
Open=Low Multi-TFHere is ultimate help for BUY side trader. Empower your trade only on signal.
Trade less but trade solid.

Monthly Color Marker V4
## 📊 Monthly Color Marker - Historical Month Highlighting
### Overview
A unique indicator that allows rapid identification of all monthly candles from a specific month across multiple years. The indicator marks candles with different colors based on their direction (bullish/bearish), enabling quick analysis of seasonal patterns and cyclical behavior of stocks or assets.
### 🎯 Purpose
- **Identify Seasonal Patterns (Seasonality)** - Discover recurring trends in specific months
- **Quick Historical Analysis** - Visual representation of monthly performance over the years
- **Direction Recognition** - Instant understanding of whether a month tends to be bullish or bearish
- **Seasonal Trading Planning** - Build strategies based on cyclical patterns
### ⚙️ Adjustable Parameters
1. **Month to Mark (1-12)**
- Select the desired month for analysis
- 1 = January, 2 = February... 12 = December
- Default: 11 (November)
2. **Years Back (1-50)**
- Determines how many years back to scan
- Recommended: 10-25 years for statistically reliable data
- Default: 25 years
3. **Bullish Candle Color**
- Color for marking bullish candles (close > open)
- Default: Green
- Customizable to your personal color scheme
4. **Bearish Candle Color**
- Color for marking bearish candles (close < open)
- Default: Red
- Customizable to your personal color scheme
5. **Show Current Year**
- Whether to include the current month in the marking
- Useful when the month hasn't finished yet
- Default: Yes
### 📈 How to Use the Indicator
#### Step 1: Adding to Chart
1. Switch to **Monthly timeframe** - Required!
2. Add the indicator to your chart
3. Select the month you want to analyze
#### Step 2: Initial Analysis
- **Count green vs red candles** - What's the ratio?
- **Look for patterns** - Are there years where the month always rises/falls?
- **Identify outliers** - Years where behavior was different
#### Step 3: Making Decisions
- **Mostly green** → Statistically, the month tends to rise
- **Mostly red** → Statistically, the month tends to fall
- **Mixed** → No clear seasonal pattern
### 💡 Usage Examples
**Example 1: "Santa Claus Rally"**
- Select month 12 (December)
- Check if there are mostly green candles
- If yes, this confirms the well-known year-end rally effect
**Example 2: "September Effect"**
- Select month 9 (September)
- Historically, September is considered a weak month
- Do the data support this for this stock?
**Example 3: Quarterly Earnings**
- Identify which month earnings are released
- Check the historical response
- Plan entry/exit accordingly
### 🔍 Combining with Other Indicators
This indicator works excellently with:
- **Historical Monthly Levels** (the first indicator) - Identify nearby price levels
- **Volume Profile** - Check volume during those months
- **RSI/MACD** - Identify momentum strength in specific months
### ⚠️ Important Notes
1. **Must use Monthly timeframe!** The indicator won't work correctly on other timeframes
2. **Statistical Sample** - More years = more reliable analysis
3. **Not a Guarantee** - Past performance doesn't guarantee future results, use additional analysis
4. **Adjust Colors** - If hard to see, change colors in settings
### 🎨 Tips for Optimal Experience
- **Zoom Out** - See more years at a glance
- **Clean Chart** - Remove unnecessary indicators for clear analysis
- **Compare Stocks** - Check multiple stocks for the same month
- **Document Findings** - Take screenshots and save insights for future reference
### 📊 Recommended Statistics
After identifying an interesting month:
- Calculate success rate (green / total candles)
- Check average volatility
- Identify outlier years and investigate what happened
- Plan entry/exit strategy
### 🚀 Who Is This Indicator For?
✅ **Swing Traders** - Plan medium-term trades
✅ **Seasonal Investors** - Exploit cyclical patterns
✅ **Technical Analysts** - Understand historical behavior
✅ **Portfolio Managers** - Time entries and exits
---
### 📝 Summary
The Monthly Color Marker indicator is a powerful and easy-to-use tool for identifying seasonal patterns. The combination of clear visualization with flexible parameters makes it an essential tool for any trader seeking a statistical edge in the market.
**Recommendation:** Start with 25 years back, analyze 2-3 key months, and build a data-driven strategy.
---
**Version:** 4.0
**Compatibility:** Pine Script v5
**Timeframe:** Monthly only
**Author:** 954
## 📊 Monthly Color Marker - סימון חודשים היסטוריים
### תיאור כללי
אינדיקטור ייחודי המאפשר לזהות במהירות את כל הנרות החודשיים מחודש ספציפי לאורך השנים. האינדיקטור מסמן את הנרות בצבעים שונים בהתאם לכיוון התנועה (עלייה/ירידה), ומאפשר ניתוח מהיר של דפוסים עונתיים והתנהגות מחזורית של המניה או הנכס.
### 🎯 מטרת האינדיקטור
- **זיהוי דפוסים עונתיים (Seasonality)** - מציאת מגמות חוזרות בחודשים מסוימים
- **ניתוח היסטורי מהיר** - ראייה ויזואלית של ביצועי החודש לאורך השנים
- **זיהוי כיווניות** - הבנה מיידית האם החודש נוטה להיות שורי או דובי
- **תכנון מסחר עונתי** - בניית אסטרטגיות מבוססות מחזוריות
### ⚙️ פרמטרים מתכווננים
1. **חודש לסימון (1-12)**
- בחירת החודש הרצוי לניתוח
- 1 = ינואר, 2 = פברואר... 12 = דצמבר
- ברירת מחדל: 11 (נובמבר)
2. **שנים אחורה (1-50)**
- קובע כמה שנים אחורה לסרוק
- מומלץ: 10-25 שנים לקבלת תמונה סטטיסטית מהימנה
- ברירת מחדל: 25 שנים
3. **צבע נר עולה**
- צבע לסימון נרות שורים (close > open)
- ברירת מחדל: ירוק
- ניתן להתאים לסכמת הצבעים האישית
4. **צבע נר יורד**
- צבע לסימון נרות דוביים (close < open)
- ברירת מחדל: אדום
- ניתן להתאים לסכמת הצבעים האישית
5. **צבע את השנה הנוכחית**
- האם לכלול את החודש הנוכחי בסימון
- שימושי כאשר החודש טרם הסתיים
- ברירת מחדל: כן
### 📈 איך להשתמש באינדיקטור
#### שלב 1: הוספה לגרף
1. עבור לטיימפריים **חודשי (Monthly)** - חובה!
2. הוסף את האינדיקטור לגרף
3. בחר את החודש שאתה רוצה לנתח
#### שלב 2: ניתוח ראשוני
- **ספור נרות ירוקים מול אדומים** - מה היחס?
- **חפש דפוסים** - האם יש שנים שבהן החודש תמיד עולה/יורד?
- **זהה חריגים** - שנים שבהן ההתנהגות הייתה שונה
#### שלב 3: קבלת החלטות
- **רוב ירוקים** → סטטיסטית החודש נוטה לעלות
- **רוב אדומים** → סטטיסטית החודש נוטה לרדת
- **מעורב** → אין דפוס עונתי ברור
### 💡 דוגמאות שימוש
**דוגמה 1: "Santa Claus Rally"**
- בחר חודש 12 (דצמבר)
- בדוק אם יש רוב נרות ירוקים
- אם כן, זה מאשר את האפקט הידוע של עליות בסוף השנה
**דוגמה 2: "September Effect"**
- בחר חודש 9 (ספטמבר)
- היסטורית, ספטמבר נחשב לחודש חלש
- האם הנתונים תומכים בכך במניה זו?
**דוגמה 3: דיווחים רבעוניים**
- זהה בחודש אילו נפרסמים דיווחים
- בדוק את התגובה ההיסטורית
- תכנן כניסה/יציאה בהתאם
### 🔍 שילוב עם אינדיקטורים אחרים
האינדיקטור עובד מצוין בשילוב עם:
- **Historical Monthly Levels** (האינדיקטור הראשון) - זיהוי רמות מחיר קרובות
- **Volume Profile** - בדיקת ווליום באותם חודשים
- **RSI/MACD** - זיהוי כוח המומנטום בחודשים ספציפיים
### ⚠️ הערות חשובות
1. **חובה להשתמש בטיימפריים חודשי!** האינדיקטור לא יעבוד נכון בטיימפריים אחרים
2. **מדגם סטטיסטי** - ככל שיש יותר שנים, הניתוח מהימן יותר
3. **לא ערובה** - עבר לא מבטיח עתיד, השתמש בניתוח נוסף
4. **התאם צבעים** - אם קשה לראות, שנה את הצבעים בהגדרות
### 🎨 טיפים לחוויית שימוש מיטבית
- **זום אאוט** - ראה יותר שנים במבט אחד
- **נקה גרף** - הסר אינדיקטורים מיותרים לניתוח ברור
- **השווה מניות** - בדוק מספר מניות לאותו חודש
- **תעד ממצאים** - צלם מסך ושמור תובנות לעתיד
### 📊 סטטיסטיקה מומלצת
לאחר שזיהית חודש מעניין:
- חשב אחוז הצלחה (ירוקים / כל הנרות)
- בדוק תנודתיות ממוצעת
- זהה שנים חריגות ובדוק מה קרה אז
- תכנן אסטרטגיית כניסה/יציאה
### 🚀 למי מתאים האינדיקטור?
✅ **סווינג טריידרים** - תכנון עסקאות לטווח בינוני
✅ **משקיעים עונתיים** - ניצול דפוסים מחזוריים
✅ **אנליסטים טכניים** - הבנת התנהגות היסטורית
✅ **מנהלי תיקים** - תזמון כניסות ויציאות
---
### 📝 סיכום
אינדיקטור Monthly Color Marker הוא כלי חזק וקל לשימוש לזיהוי דפוסים עונתיים. השילוב של ויזואליזציה ברורה עם פרמטרים גמישים הופך אותו לכלי חיוני לכל טריידר המחפש יתרון סטטיסטי בשוק.
**המלצה:** התחל עם 25 שנים אחורה, נתח 2-3 חודשים מרכזיים, ובנה אסטרטגיה מבוססת נתונים.
---
**גרסה:** 4.0
**תאימות:** Pine Script v5
**טיימפריים:** חודשי בלבד
**מחבר:** [954
---

Previous and Penultimate Swings (Single Timeframe • 4 lines)Using chat GPT I've created a swing high and swing low horizontal indicator that helps me personally visualize significant levels.
In particular penultimate swing highs and penultimate swing lows. Hopefully this can help another trader or many! You can add or remove any of the 4 levels. Adjust the lookback period. And extend each line individually to the right of price action.

Mum Formasyonları TespitiIt is used to detect candles.
It is designed to analyze all the candles that form.
The most frequently formed candles are displayed on the price chart.

Avg Candle Size Table (Ticks) The average of the last N candles in ticks shown on a table in the top right of the chart


Pinbar MTF - No Repaint# Pinbar MTF - No Repaint Indicator
## Complete Technical Documentation
---
## 📊 Overview
**Pinbar MTF (Multi-Timeframe) - No Repaint** is a professional-grade TradingView Pine Script indicator designed to detect high-probability pinbar reversal patterns with advanced filtering systems. The indicator is specifically engineered to be **100% non-repainting**, making it reliable for both live trading and backtesting.
### Key Features
✅ **Non-Repainting** - Signals only appear AFTER bar closes, never disappear
✅ **Three-Layer Filter System** - ATR, SWING, and RSI filters
✅ **Automatic SL/TP Calculation** - Based on risk:reward ratios
✅ **Real-time Alerts** - TradingView notifications for all signals
✅ **Visual Trade Management** - Lines, labels, and areas for entries, stops, and targets
✅ **Backtesting Ready** - Reliable historical data for strategy testing
---
## 🎯 What is a Pinbar?
A **Pinbar (Pin Bar/Pinocchio Bar)** is a single candlestick pattern that indicates a potential price reversal:
### Bullish Pinbar (BUY Signal)
- **Long lower wick** (rejection of lower prices)
- **Small body at the top** of the candle
- Shows buyers rejected sellers' attempt to push price down
- Forms at support levels or swing lows
- Entry signal for LONG positions
### Bearish Pinbar (SELL Signal)
- **Long upper wick** (rejection of higher prices)
- **Small body at the bottom** of the candle
- Shows sellers rejected buyers' attempt to push price up
- Forms at resistance levels or swing highs
- Entry signal for SHORT positions
---
## 🔧 How the Indicator Works
### 1. **Pinbar Detection Logic**
The indicator analyzes the **previous closed bar ** to identify pinbar patterns:
```
Bullish Pinbar Requirements:
- Lower wick > 72% of total candle range (adjustable)
- Upper wick < 28% of total candle range
- Close > Open (bullish candle body)
Bearish Pinbar Requirements:
- Upper wick > 72% of total candle range (adjustable)
- Lower wick < 28% of total candle range
- Close < Open (bearish candle body)
```
**Why check ?** By analyzing the previous completed bar, we ensure the pattern is fully formed and won't change, preventing repainting.
---
### 2. **Three-Layer Filter System**
#### 🔍 **Filter #1: ATR (Average True Range) Filter**
- **Purpose**: Ensures the pinbar has significant size
- **Function**: Only signals if pinbar range ≥ ATR value
- **Benefit**: Filters out small, insignificant pinbars
- **Settings**:
- Enable/Disable toggle
- ATR Period (default: 7)
**Example**: If ATR = 50 pips, only pinbars with 50+ pip range will signal.
---
#### 🔍 **Filter #2: SWING Filter** (Always Active)
- **Purpose**: Confirms pinbar forms at swing highs/lows
- **Function**: Validates the pinbar is an absolute high/low
- **Benefit**: Identifies true reversal points
- **Settings**:
- Swing Candles (default: 3)
**How it works**:
- For bullish pinbar: Checks if low is lowest of past 3 bars
- For bearish pinbar: Checks if high is highest of past 3 bars
**Example**: With 3 swing candles, a bullish pinbar must have the lowest low among the last 3 bars.
---
#### 🔍 **Filter #3: RSI (Relative Strength Index) Filter**
- **Purpose**: Confirms momentum conditions
- **Function**: Prevents signals in extreme momentum zones
- **Benefit**: Avoids counter-trend trades
- **Settings**:
- Enable/Disable toggle
- RSI Period (default: 7)
- RSI Source (Close, Open, High, Low, HL2, HLC3, OHLC4)
- Overbought Level (default: 70)
- Oversold Level (default: 30)
**Logic**:
- Bullish Pinbar: Only signals if RSI < 70 (not overbought)
- Bearish Pinbar: Only signals if RSI > 30 (not oversold)
---
### 3. **Stop Loss Calculation**
Two methods available:
#### Method A: ATR-Based Stop Loss (Recommended)
```
Bullish Pinbar:
SL = Pinbar Low - (1 × ATR)
Bearish Pinbar:
SL = Pinbar High + (1 × ATR)
```
**Benefit**: Dynamic stops that adapt to market volatility
#### Method B: Fixed Pips Stop Loss
```
Bullish Pinbar:
SL = Pinbar Low - (Fixed Pips)
Bearish Pinbar:
SL = Pinbar High + (Fixed Pips)
```
**Settings**:
- Calculate Stop with ATR (toggle)
- Stop Pips without ATR (default: 5)
---
### 4. **Take Profit Calculation**
Take Profit is calculated based on Risk:Reward ratio:
```
Bullish Trade:
TP = Entry + (Entry - SL) × Risk:Reward Ratio
Bearish Trade:
TP = Entry - (SL - Entry) × Risk:Reward Ratio
```
**Example**:
- Entry: 1.2000
- SL: 1.1950 (50 pip risk)
- RR: 2:1
- TP: 1.2100 (100 pip reward = 50 × 2)
**Settings**:
- Risk:Reward Ratio (default: 1.0, range: 0.1 to 10.0)
---
## 📈 Visual Elements
### On-Chart Displays
1. **Signal Markers**
- 🟢 **Green Triangle Up** = Bullish Pinbar (BUY)
- 🔴 **Red Triangle Down** = Bearish Pinbar (SELL)
- Placed directly on the pinbar candle
2. **Entry Labels**
- Green "BUY" label with entry price
- Red "SELL" label with entry price
- Shows exact entry level
3. **Stop Loss Lines**
- 🔴 Red horizontal line
- "SL" label
- Extends 20 bars forward
4. **Take Profit Lines**
- 🟢 Green horizontal line
- "TP" label
- Extends 20 bars forward
5. **Risk/Reward Areas** (Optional)
- Red shaded box = Risk zone (Entry to SL)
- Green shaded box = Reward zone (Entry to TP)
- Visual risk:reward visualization
6. **Info Table** (Top Right)
- Displays current settings
- Shows filter status (ON/OFF)
- Real-time RSI value
- Quick reference panel
---
## 🔔 Alert System
Three alert types available:
### 1. Combined Alert: "Pinbar Signal (Any Direction)"
- Fires for BOTH bullish and bearish pinbars
- **Best for**: General monitoring
- **Message**: "Pinbar Signal Detected on {TICKER} at {PRICE}"
### 2. Bullish Alert: "Bullish Pinbar Alert"
- Fires ONLY for BUY signals
- **Best for**: Long-only strategies
- **Message**: "BUY Signal on {TICKER} at {PRICE}"
### 3. Bearish Alert: "Bearish Pinbar Alert"
- Fires ONLY for SELL signals
- **Best for**: Short-only strategies
- **Message**: "SELL Signal on {TICKER} at {PRICE}"
---
## ⚙️ Input Parameters Reference
### **Filters Group**
| Parameter | Default | Range | Description |
|-----------|---------|-------|-------------|
| ATR Filter on Pinbar Range? | ✅ ON | Boolean | Enable/disable ATR filter |
| ATR Period | 7 | 1+ | Lookback period for ATR calculation |
| Swing Candles | 3 | 1+ | Bars to check for swing high/low |
| RSI Filter on Pinbar? | ❌ OFF | Boolean | Enable/disable RSI filter |
| RSI Period | 7 | 2+ | Lookback period for RSI calculation |
| RSI Source | Close | Multiple | Price data for RSI (Close/Open/High/Low/etc) |
| RSI Overbought Level | 70 | 50-100 | Upper threshold for RSI filter |
| RSI Oversold Level | 30 | 0-50 | Lower threshold for RSI filter |
### **Pinbar Detection Group**
| Parameter | Default | Range | Description |
|-----------|---------|-------|-------------|
| Shadow % vs Body | 72 | 50-95 | Minimum wick size as % of total range |
### **Visualization Group**
| Parameter | Default | Range | Description |
|-----------|---------|-------|-------------|
| Show SL and TP Lines? | ✅ ON | Boolean | Display stop loss and take profit lines |
| Show SL and TP Area? | ❌ OFF | Boolean | Show shaded risk/reward boxes |
### **Risk Management Group**
| Parameter | Default | Range | Description |
|-----------|---------|-------|-------------|
| Risk:Reward Ratio | 1.0 | 0.1-10.0 | Target profit vs risk (1.0 = 1:1, 2.0 = 1:2) |
| Calculate Stop with ATR? | ✅ ON | Boolean | Use ATR for stop calculation |
| Stop Pips without ATR | 5 | 1+ | Fixed pip stop when ATR disabled |
---
## 🚫 Non-Repainting Architecture
### What is Repainting?
**Repainting** occurs when an indicator's historical signals differ from what appeared in real-time. This makes backtesting unreliable and can lead to false confidence in a strategy.
### How This Indicator Prevents Repainting
1. **Closed Bar Analysis**
- All calculations use ` ` offset (previous bar)
- Only analyzes COMPLETED candles
- Signals appear on the bar AFTER the pinbar closes
2. **Confirmed Swing Points**
- Waits for sufficient bar history before signaling
- Only checks historical bars that cannot change
- Prevents premature swing detection
3. **Static Alert Timing**
- Alerts fire only after bar completion
- No conditional logic that changes historically
- Same results in replay mode and live trading
### Verification Method
To verify non-repainting behavior:
1. Apply indicator to chart
2. Note signal locations and prices
3. Refresh browser / reload chart
4. **Signals remain in exact same locations**
---
## 💼 Trading Strategy Guidelines
### Entry Rules
**For Bullish Pinbar (LONG):**
1. Wait for green triangle to appear
2. Enter at close of pinbar (shown in label)
3. Alternative: Enter on break of pinbar high
4. Place stop loss at red SL line
5. Set target at green TP line
**For Bearish Pinbar (SHORT):**
1. Wait for red triangle to appear
2. Enter at close of pinbar (shown in label)
3. Alternative: Enter on break of pinbar low
4. Place stop loss at red SL line
5. Set target at green TP line
### Risk Management
- **Position Sizing**: Risk only 1-2% of account per trade
- **Stop Loss**: Always use the calculated SL (never move it wider)
- **Take Profit**: Use calculated TP or trail stop after 1:1 RR
- **Multiple Timeframes**: Confirm signals on higher timeframe
### Best Practices
✅ **DO:**
- Wait for bar to close before entering
- Trade in direction of higher timeframe trend
- Use on liquid markets with clear support/resistance
- Combine with price action analysis
- Keep a trading journal
❌ **DON'T:**
- Enter before bar closes (prevents seeing full pattern)
- Trade against strong trends
- Ignore the filters (they improve win rate)
- Risk more than 2% per trade
- Trade every signal (be selective)
---
## 📊 Backtesting & Data Export
### Available Data Points
The indicator exports these values for strategy development:
| Output | Description |
|--------|-------------|
| Bullish Signal | 1 = BUY signal, 0 = No signal |
| Bearish Signal | 1 = SELL signal, 0 = No signal |
| Bull SL | Stop loss level for long trades |
| Bull TP | Take profit level for long trades |
| Bull Entry | Entry price for long trades |
| Bear SL | Stop loss level for short trades |
| Bear TP | Take profit level for short trades |
| Bear Entry | Entry price for short trades |
### How to Use in Strategy
These values can be accessed by Pine Script strategies using:
```pine
indicator_values = request.security(syminfo.tickerid, timeframe.period,
)
```
---
## 🎓 Understanding the Filters
### Why Use Multiple Filters?
Single-indicator systems often generate too many false signals. This indicator uses a **confluence approach**:
1. **Pinbar Pattern** = Price rejection detected
2. **+ SWING Filter** = Rejection at key level
3. **+ ATR Filter** = Significant move
4. **+ RSI Filter** = Favorable momentum
**Result**: Higher probability setups with better risk:reward
### Filter Optimization
**Conservative Settings** (Fewer, Higher Quality Signals):
- ATR Filter: ON
- Swing Candles: 5
- RSI Filter: ON
- Shadow %: 75%
**Aggressive Settings** (More Signals, More Noise):
- ATR Filter: OFF
- Swing Candles: 2
- RSI Filter: OFF
- Shadow %: 65%
**Balanced Settings** (Recommended):
- ATR Filter: ON
- Swing Candles: 3
- RSI Filter: OFF (or ON for trending markets)
- Shadow %: 72%
---
## 🔍 Troubleshooting
### "No Signals Appearing"
**Possible Causes:**
1. Filters are too strict
2. No pinbars forming on chart
3. Insufficient bar history
**Solutions:**
- Reduce Shadow % to 65%
- Reduce Swing Candles to 2
- Disable ATR or RSI filters temporarily
- Check that chart has enough data loaded
### "Too Many Signals"
**Solutions:**
- Enable ATR filter
- Increase Swing Candles to 4-5
- Enable RSI filter
- Increase Shadow % to 75-80%
### "Signals Appearing Late"
**This is normal behavior!** The indicator:
- Analyzes previous closed bar
- Signals appear on the bar AFTER the pinbar
- This is what prevents repainting
- Signal latency is 1 bar (by design)
---
## 📝 Technical Specifications
**Indicator Type:** Overlay (displays on price chart)
**Pine Script Version:** 5
**Max Labels:** 500
**Max Lines:** 500
**Repainting:** None (100% non-repainting)
**Data Window Values:** 8 exported values
**Alert Types:** 3 (Combined, Bullish, Bearish)
**Performance:**
- Lightweight script (fast execution)
- Works on all timeframes
- Compatible with all markets (Forex, Crypto, Stocks, Futures)
- No data snooping bias
---
## 🎯 Use Cases
### 1. **Swing Trading**
- Timeframe: Daily, 4H
- Filter Settings: All enabled
- Best for: Catching major reversals
### 2. **Day Trading**
- Timeframe: 15m, 1H
- Filter Settings: ATR + SWING only
- Best for: Intraday reversals
### 3. **Scalping**
- Timeframe: 5m, 15m
- Filter Settings: SWING only (aggressive)
- Best for: Quick reversals (requires experience)
### 4. **Position Trading**
- Timeframe: Weekly, Daily
- Filter Settings: All enabled + high RR (2:1 or 3:1)
- Best for: Long-term trend reversal catches
---
## 🏆 Advantages Over Other Pinbar Indicators
✅ **Guaranteed Non-Repainting** - Many pinbar indicators repaint; this one never does
✅ **Automatic SL/TP** - No manual calculation needed
✅ **Multi-Layer Filtering** - Reduces false signals significantly
✅ **Visual Trade Management** - Clear entry, stop, and target levels
✅ **Flexible Configuration** - Adaptable to any trading style
✅ **Alert System** - Never miss a setup
✅ **Backtesting Ready** - Reliable historical data
✅ **Professional Grade** - Suitable for live trading
---
## 📚 Educational Resources
### Recommended Reading on Pinbars
- "The Pin Bar Trading Strategy" by Nial Fuller
- "Price Action Trading" by Al Brooks
- TradingView Education: Price Action Patterns
### Practice Recommendations
1. Paper trade signals for 20+ trades before live trading
2. Backtest on different timeframes and markets
3. Keep detailed records of all trades
4. Analyze winning vs losing setups
5. Refine filter settings based on results
---
## ⚖️ Disclaimer
This indicator is a tool for technical analysis and does not guarantee profits. Trading involves substantial risk of loss. Past performance is not indicative of future results.
- Always use proper risk management
- Never risk more than you can afford to lose
- Consider your trading experience and objectives
- Seek independent financial advice if needed
---
## 📧 Version Information
**Current Version:** 1.0
**Last Updated:** 2024
**Compatibility:** TradingView Pine Script v5
**Status:** Production Ready
---
## 🔄 Future Enhancements (Potential)
Possible future additions:
- Multi-timeframe confirmation option
- Volume filter integration
- Customizable color schemes
- Win rate statistics display
- Partial profit taking levels
- Trailing stop functionality
---
## 📖 Quick Start Guide
### 5-Minute Setup
1. **Add to Chart**
- Open TradingView
- Go to Pine Editor
- Paste the code
- Click "Add to Chart"
2. **Configure Settings**
- Open indicator settings (gear icon)
- Start with default settings
- Enable "Show SL and TP Lines"
3. **Set Alert**
- Right-click indicator name
- Click "Add Alert"
- Select "Pinbar Signal (Any Direction)"
- Configure notification method
4. **Test**
- Scroll back on chart
- Verify signals make sense
- Check that signals don't repaint
5. **Trade** (After Practice!)
- Wait for alert
- Verify signal quality
- Enter, place SL/TP
- Manage trade
---
## 🎯 Final Thoughts
The **Pinbar MTF - No Repaint** indicator is designed for serious traders who value:
- **Reliability** over flashy signals
- **Quality** over quantity
- **Honesty** over false promises
This indicator will NOT:
- Make you rich overnight
- Win every trade
- Replace proper trading education
This indicator WILL:
- Identify high-probability reversal setups
- Save you analysis time
- Provide consistent, non-repainting signals
- Help you develop a systematic trading approach
**Success in trading comes from:**
1. Proper education (60%)
2. Risk management (30%)
3. Technical tools like this indicator (10%)
Use this tool as part of a complete trading plan, not as a standalone solution.

Lord Mathew ATSThe Smart Money Structure & Pattern Analyzer is a complete, all-in-one visual trading system that brings together every essential element of Smart Money Concepts (SMC), ICT methodology, and candlestick psychology into one powerful indicator.
It is designed to help traders instantly understand the market’s structure, liquidity flow, and potential turning points without switching tools or manually marking charts. Whether you trade forex, indices, crypto, or commodities, this indicator automatically identifies where institutional activity, imbalances, and price inefficiencies occur in real time.
With its advanced algorithm, it plots market structure shifts, equal highs and lows, liquidity zones, order blocks, fair value gaps (FVGs), and previous week and day levels (PWO, PWH, PWL, PWC, PDO, PDH, PDL, PDO). It also integrates a deep candlestick recognition engine that detects over ten classic and advanced candle formations including engulfing patterns, dojis, hammers, shooting stars, morning/evening stars, and spinning tops to provide precise confirmation at critical points of interest.
This indicator isn’t just a tool it’s a complete market map that helps traders visualize how institutional order flow and candlestick sentiment interact.
Core Features
📊 Market Structure Detection:
Automatically marks swing highs/lows, Break of Structure (BOS), and Change of Character (CHOCH) in real time.
💧 Liquidity Mapping:
Highlights equal highs/lows and liquidity grabs, showing where price is likely to target before a reversal or continuation.
🧱 Order Block Visualization:
Displays the last bullish or bearish candle before an impulsive displacement, acting as a potential institutional entry zone.
⚡ Fair Value Gap (FVG) Scanner:
Detects and highlights imbalances where price moved too fast, helping you identify high-probability retracement areas.
🕯️ Candlestick Pattern Recognition:
Recognizes key reversal and continuation patterns (engulfing, hammer, shooting star, doji, morning/evening star, etc.) in real time.
📅 Institutional Reference Points:
Plots previous week & day open (PWO, PDO), previous week & day high (PWH, PWH), previous week & day low (PWL, PDL), previous week & day close (PWC, PDC) and optionally previous day levels to help frame bias.
🎨 Customizable Design:
Toggle any feature, change colors, and set alerts when multiple Smart Money signals align for cleaner, faster decision-making.
How It Works
Add the indicator to your chart on any timeframe or market.
The algorithm automatically detects structure, liquidity, and imbalance zones.
Candlestick patterns are highlighted when they form near high-probability areas (like OBs or FVGs).
When confluence occurs such as a liquidity grab, FVG fill, and bullish engulfing candle—the indicator provides a visual signal zone for your confirmation-based entries.
You can refine your trades using higher-timeframe bias (HTF order flow) and lower-timeframe execution (LTF confirmation).
Best For
Traders using ICT, Smart Money Concepts, or price-action systems.
Intraday and swing traders looking for clear, data-driven chart structure.
Traders who want to simplify confluence analysis and focus on precision execution.
Why It Stands Out
Unlike standard candlestick or pattern scanners, this indicator merges institutional market logic with technical candle behavior, allowing traders to see where smart money might be entering or exiting positions.
It’s not about random signals it’s about context, structure, and confirmation.
Every feature in this indicator is built around the principle of liquidity engineering:
price creates liquidity, grabs it, and moves toward imbalance or order flow efficiency.
By merging that institutional logic with candlestick patterns, this tool gives traders an edge in recognizing not only where to trade but why price is reacting in that exact area.
Disclaimer
This indicator is intended for educational and analytical use. It does not provide financial advice or guaranteed trading results. Always backtest and manage your risk responsibly.

ICT Sweep + CHoCH + FVG Alerts
### 🔥 ICT Sweep + CHoCH + FVG Alerts
Script designed to automate ICT entry confirmations using:
• Liquidity Sweep (Buy/Sell Stops taken)
• Change of Character (CHoCH)
• Fair Value Gap (FVG) confirmation
### ✅ Conditions
**Long signal when:**
1. Bearish liquidity sweep
2. Bullish CHoCH
3. Bullish FVG forms and gets respected
**Short signal when:**
1. Bullish liquidity sweep
2. Bearish CHoCH
3. Bearish FVG forms and gets respected
### 🎯 Purpose
This script helps traders detect smart-money setup entries based on ICT logic and receive alerts in real time.
### 📡 Alerts
Supports webhook automation for bots, signal servers, or trading platforms.
*This script does not place trades automatically, alerts only.*
### ⚠️ Disclaimer
This tool is for educational purposes.
Always backtest and use proper risk management.
DRACO Tomas Delta (Custom/Monthly)🐉 DRACO Delta SessionBox (Custom / Monthly)
Overview
The DRACO Delta SessionBox is an advanced visual and analytical tool designed to measure and display cumulative buying and selling pressure (Δ — delta) within a user-defined time window, such as a specific custom date range, a recurring monthly period, or the entire current month.
It visually represents market accumulation or distribution phases by calculating an approximate delta — the imbalance between bullish and bearish volume — and then aggregates it inside a dynamic “box” that spans only the selected time window.
Core Concept
Delta in this context is an approximation of the real order-flow delta (buy vs sell volume difference).
Since TradingView doesn’t provide raw tick-by-tick trade direction data, this indicator uses a proxy formula based on OHLC and volume data:
Δ per bar
=
Volume
×
(
Close
−
Open
)
max
(
High
−
Low
,
Tick Size
)
Δ per bar=Volume×
max(High−Low,Tick Size)
(Close−Open)
This gives a very effective approximation of intrabar directional pressure — whether volume was dominated by buyers (Δ > 0) or sellers (Δ < 0).
Modes
The indicator can operate in three distinct modes:
🕒 Custom DateTime
The user manually sets an exact date & time range (From – To).
The box only measures delta and volume accumulation within this window.
Ideal for analyzing specific events, like FOMC weeks, quarterly earnings, or macro periods.
📆 Monthly Window
The user selects start and end days of the month (e.g. 5–20).
The same window repeats automatically every month.
Useful for identifying recurring accumulation or distribution cycles within months.
🧭 Whole Month
Automatically measures and visualizes delta for the entire current calendar month.
The box resets when a new month begins.
Provides a macro-level view of monthly directional bias.


Rita Swings •Impulses and Setbacks (Banana Trader)🚀 I just created an indicator that automatically shows market impulses and pullbacks 📊
With this indicator, you'll be able to see where the price is really moving and where the market pauses before the next move 💪
A simple yet powerful tool to improve your chart reading 🔥

SMC INDICATORMoney Concepts (SMC) toolkit and issues buy / sell signals. It includes:
Structure (market structure shifts via pivots)
Order Blocks (last bearish/bullish candle before a structure shift)
Fair Value Gaps (3-bar gap detection)
Simple liquidity sweep detection
Buy / Sell signal generation & alert conditions
Rectangle drawings and on-chart arrows
This is a practical, best-effort SMC indicator suitable for 15m/30m/1H/etc. — feel free to tweak lookbacks and filters in inputs.