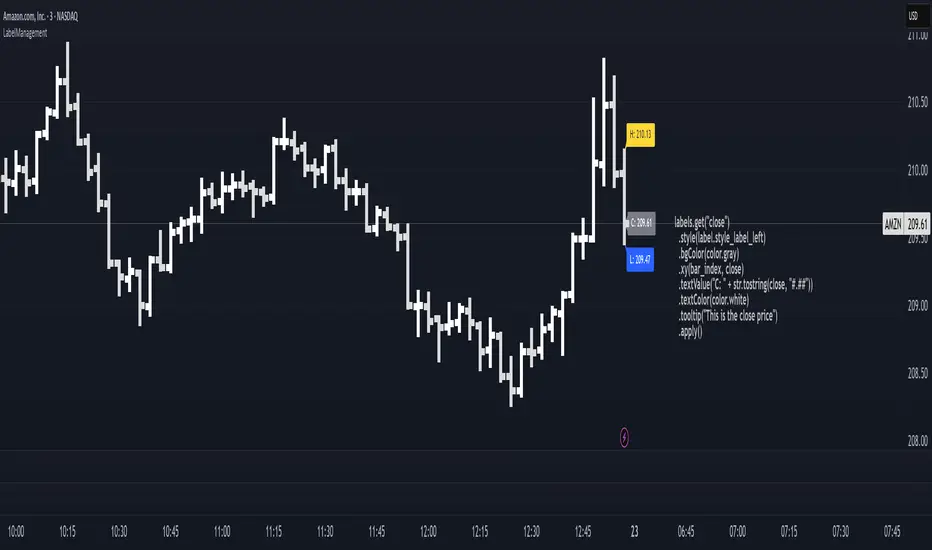
LabelManagementLabel management with fluent configuration, change tracking, and named registry
LabelManagement is a Pine Script library for creating and managing dynamic chart labels. Built with a fluent-style API , it simplifies label creation, styling, positioning, and content updates through method chaining and centralized control.
Manage 'sticky' labels easily across bars with expressive, readable code that reduces clutter and improves code clarity.
Example usage:
// Close label – to the right of the last bar
labels.get("close")
.style(label.style_label_left)
.bgColor(color.gray)
.xy(bar_index, close)
.textValue("C: " + str.tostring(close, "#.##"))
.textColor(color.white)
.tooltip("This is the close price")
.apply()
Key features:
Fluent API – Build and update labels using a chainable configuration flow
Named label registry – Access and manage labels by name, e.g., "entry", "stop", "target"
Change tracking – Update only when necessary to reduce redraws
Deferred application – Apply all changes in one efficient operation
Centralized control – Works well in modular or multi-label environments
This library is designed for Pine developers who want more control and less boilerplate when managing visual elements on the chart.
method clone(this)
Creates a new LabelConfig by copying all properties from this instance
Namespace types: LabelConfig
Parameters:
this (LabelConfig) : (LabelConfig) The LabelConfig instance
Returns: (LabelConfig) New LabelConfig instance with identical properties
method applyTo(this, target)
Applies configuration to specified label (required parameter)
Namespace types: LabelConfig
Parameters:
this (LabelConfig) : (LabelConfig) The LabelConfig instance
target (label) : (label) Label to apply config to
Returns: (LabelConfig) Self-reference for method chaining
method update(this, updates)
Creates a new LabelUpdater with change tracking for this label
Namespace types: series label
Parameters:
this (label) : (label) The label instance
updates (LabelConfig) : (LabelConfig) Optional existing config to apply and reuse (if provided, applies to label first)
Returns: (LabelUpdater) New LabelUpdater with blank configs for change tracking
method x(this, value)
Sets the X coordinate with change tracking (fluent interface)
Namespace types: LabelUpdater
Parameters:
this (LabelUpdater) : (LabelUpdater) The LabelUpdater instance
value (int) : (int) New X coordinate
Returns: (LabelUpdater) Self-reference for method chaining
method y(this, value)
Sets the Y coordinate with change tracking (fluent interface)
Namespace types: LabelUpdater
Parameters:
this (LabelUpdater) : (LabelUpdater) The LabelUpdater instance
value (float) : (float) New Y coordinate
Returns: (LabelUpdater) Self-reference for method chaining
method xy(this, x, y)
Sets both X and Y coordinates with change tracking (fluent interface)
Namespace types: LabelUpdater
Parameters:
this (LabelUpdater) : (LabelUpdater) The LabelUpdater instance
x (int) : (int) New X coordinate
y (float) : (float) New Y coordinate
Returns: (LabelUpdater) Self-reference for method chaining
method textValue(this, value)
Sets the text content with change tracking (fluent interface)
Namespace types: LabelUpdater
Parameters:
this (LabelUpdater) : (LabelUpdater) The LabelUpdater instance
value (string) : (string) New text content
Returns: (LabelUpdater) Self-reference for method chaining
method textColor(this, value)
Sets the text color with change tracking (fluent interface)
Namespace types: LabelUpdater
Parameters:
this (LabelUpdater) : (LabelUpdater) The LabelUpdater instance
value (color) : (color) New text color
Returns: (LabelUpdater) Self-reference for method chaining
method textSize(this, value)
Sets the text size with change tracking (fluent interface)
Namespace types: LabelUpdater
Parameters:
this (LabelUpdater) : (LabelUpdater) The LabelUpdater instance
value (string) : (string) New text size
Returns: (LabelUpdater) Self-reference for method chaining
method bgColor(this, value)
Sets the background color with change tracking (fluent interface)
Namespace types: LabelUpdater
Parameters:
this (LabelUpdater) : (LabelUpdater) The LabelUpdater instance
value (color) : (color) New background color
Returns: (LabelUpdater) Self-reference for method chaining
method style(this, value)
Sets the label style with change tracking (fluent interface)
Namespace types: LabelUpdater
Parameters:
this (LabelUpdater) : (LabelUpdater) The LabelUpdater instance
value (string) : (string) New style
Returns: (LabelUpdater) Self-reference for method chaining
method yloc(this, value)
Sets the Y location mode with change tracking (fluent interface)
Namespace types: LabelUpdater
Parameters:
this (LabelUpdater) : (LabelUpdater) The LabelUpdater instance
value (string) : (string) New yloc
Returns: (LabelUpdater) Self-reference for method chaining
method xloc(this, value)
Sets the X location mode with change tracking (fluent interface)
Namespace types: LabelUpdater
Parameters:
this (LabelUpdater) : (LabelUpdater) The LabelUpdater instance
value (string) : (string) New xloc
Returns: (LabelUpdater) Self-reference for method chaining
method tooltip(this, value)
Sets the tooltip content with change tracking (fluent interface)
Namespace types: LabelUpdater
Parameters:
this (LabelUpdater) : (LabelUpdater) The LabelUpdater instance
value (string) : (string) New tooltip content
Returns: (LabelUpdater) Self-reference for method chaining
method size(this, value)
Sets the text size with change tracking (fluent interface) - alias for textSize
Namespace types: LabelUpdater
Parameters:
this (LabelUpdater) : (LabelUpdater) The LabelUpdater instance
value (string) : (string) New text size
Returns: (LabelUpdater) Self-reference for method chaining
method size(this)
Gets the count of registered labels
Namespace types: LabelManager
Parameters:
this (LabelManager) : (LabelManager) The LabelManager instance
Returns: (int) Number of labels in the registry
method apply(this)
Applies pending changes to linked label and updates tracking
Namespace types: LabelUpdater
Parameters:
this (LabelUpdater) : (LabelUpdater) The LabelUpdater instance
Returns: (LabelUpdater) Self-reference for method chaining
method get(this, name)
Gets or creates a LabelUpdater for the specified name
Namespace types: LabelManager
Parameters:
this (LabelManager) : (LabelManager) The LabelManager instance
name (string) : (string) Unique identifier for the label
Returns: (LabelUpdater) Existing or newly created LabelUpdater for the name
method has(this, name)
Checks if a label with the specified name exists
Namespace types: LabelManager
Parameters:
this (LabelManager) : (LabelManager) The LabelManager instance
name (string) : (string) Name to check for existence
Returns: (bool) True if label exists, false otherwise
method remove(this, name)
Removes a label from the registry and deletes the underlying Pine Script label
Namespace types: LabelManager
Parameters:
this (LabelManager) : (LabelManager) The LabelManager instance
name (string) : (string) Name of the label to remove
Returns: (LabelManager) Self-reference for method chaining
method clear(this)
Removes all labels from registry and deletes all underlying Pine Script labels
Namespace types: LabelManager
Parameters:
this (LabelManager) : (LabelManager) The LabelManager instance
Returns: (LabelManager) Self-reference for method chaining
newManager()
Creates a new LabelManager with empty registry
Returns: (LabelManager) New LabelManager instance ready for use
LabelConfig
LabelConfig Configuration object for label appearance and positioning
Fields:
x (series int) : (series int) X-coordinate (na = unchanged)
y (series float) : (series float) Y-coordinate (na = unchanged)
style (series string) : (series string) Label style (na = unchanged)
yloc (series string) : (series string) Y-location type (na = unchanged)
xloc (series string) : (series string) X-location type (na = unchanged)
bgColor (series color) : (series color) Background color (na = unchanged)
textValue (series string) : (series string) Label text content (na = unchanged)
textSize (series string) : (series string) Text size (na = unchanged)
textColor (series color) : (series color) Text color (na = unchanged)
tooltip (series string) : (series string) Tooltip text (na = unchanged)
LabelUpdater
LabelUpdater Smart label updater with change tracking and minimal updates
Fields:
label (series label) : (label) Reference to the label being updated
latest (LabelConfig) : (LabelConfig) Current known state of the label
updates (LabelConfig) : (LabelConfig) Pending changes to apply
LabelManager
LabelManager Central registry for managing named labels with automatic creation
Fields:
registry (map) : (map) Internal storage mapping names to LabelUpdater instances
Display
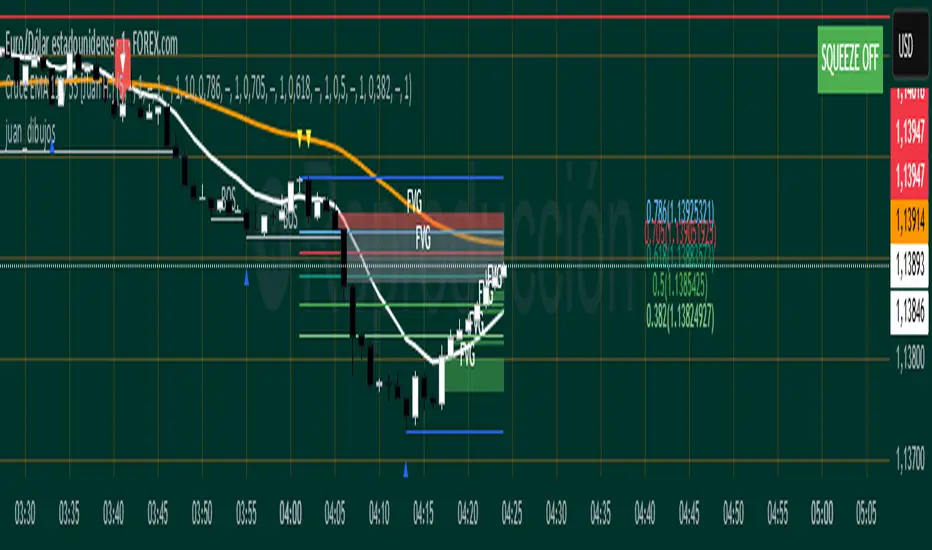
juan_dibujosLibrary "juan_dibujos"
extend_line(lineId, labelId)
: Extend specific line with its label
Parameters:
lineId (line)
labelId (label)
update_line_coordinates(lineId, labelId, x1, y1, x2, y2)
: Update specific line coordinates with its label
Parameters:
lineId (line)
labelId (label)
x1 (int)
y1 (float)
x2 (int)
y2 (float)
update_label_coordinates(labelId, value)
: Update coordinates of a label
Parameters:
labelId (label)
value (float)
delete_line(lineId, labelId)
: Delete specific line with its label
Parameters:
lineId (line)
labelId (label)
update_box_coordinates(boxId, labelId, left, top, right, bottom)
: Update specific box coordinates with its label
Parameters:
boxId (box)
labelId (label)
left (int)
top (float)
right (int)
bottom (float)
delete_box(boxId, labelId)
: Delete specific box with its label
Parameters:
boxId (box)
labelId (label)
lib_core_utilsLibrary "lib_core_utils"
Core utility functions for Pine Script strategies
Provides safe mathematical operations, array management, and basic helpers
Version: 1.0.0
Author: NQ Hybrid Strategy Team
Last Updated: 2025-06-18
===================================================================
safe_division(numerator, denominator)
safe_division
@description Performs division with safety checks for zero denominators and invalid values
Parameters:
numerator (float) : (float) The numerator value
denominator (float) : (float) The denominator value
Returns: (float) Result of division, or 0.0 if invalid
safe_division_detailed(numerator, denominator)
safe_division_detailed
@description Enhanced division with detailed result information
Parameters:
numerator (float) : (float) The numerator value
denominator (float) : (float) The denominator value
Returns: (SafeCalculationResult) Detailed calculation result
safe_multiply(a, b)
safe_multiply
@description Performs multiplication with safety checks for overflow and invalid values
Parameters:
a (float) : (float) First multiplier
b (float) : (float) Second multiplier
Returns: (float) Result of multiplication, or 0.0 if invalid
safe_add(a, b)
safe_add
@description Performs addition with safety checks
Parameters:
a (float) : (float) First addend
b (float) : (float) Second addend
Returns: (float) Result of addition, or 0.0 if invalid
safe_subtract(a, b)
safe_subtract
@description Performs subtraction with safety checks
Parameters:
a (float) : (float) Minuend
b (float) : (float) Subtrahend
Returns: (float) Result of subtraction, or 0.0 if invalid
safe_abs(value)
safe_abs
@description Safe absolute value calculation
Parameters:
value (float) : (float) Input value
Returns: (float) Absolute value, or 0.0 if invalid
safe_max(a, b)
safe_max
@description Safe maximum value calculation
Parameters:
a (float) : (float) First value
b (float) : (float) Second value
Returns: (float) Maximum value, handling NA cases
safe_min(a, b)
safe_min
@description Safe minimum value calculation
Parameters:
a (float) : (float) First value
b (float) : (float) Second value
Returns: (float) Minimum value, handling NA cases
safe_array_get(arr, index)
safe_array_get
@description Safely retrieves value from array with bounds checking
Parameters:
arr (array) : (array) The array to access
index (int) : (int) Index to retrieve
Returns: (float) Value at index, or na if invalid
safe_array_push(arr, value, max_size)
safe_array_push
@description Safely pushes value to array with size management
Parameters:
arr (array) : (array) The array to modify
value (float) : (float) Value to push
max_size (int) : (int) Maximum array size
Returns: (bool) True if push was successful
safe_array_unshift(arr, value, max_size)
safe_array_unshift
@description Safely adds value to beginning of array with size management
Parameters:
arr (array) : (array) The array to modify
value (float) : (float) Value to add at beginning
max_size (int) : (int) Maximum array size
Returns: (bool) True if unshift was successful
get_array_stats(arr, max_size)
get_array_stats
@description Gets statistics about an array
Parameters:
arr (array) : (array) The array to analyze
max_size (int) : (int) The maximum allowed size
Returns: (ArrayStats) Statistics about the array
cleanup_array(arr, target_size)
cleanup_array
@description Cleans up array by removing old elements if it's too large
Parameters:
arr (array) : (array) The array to cleanup
target_size (int) : (int) Target size after cleanup
Returns: (int) Number of elements removed
is_valid_price(price)
is_valid_price
@description Checks if a price value is valid for trading calculations
Parameters:
price (float) : (float) Price to validate
Returns: (bool) True if price is valid
is_valid_volume(vol)
is_valid_volume
@description Checks if a volume value is valid
Parameters:
vol (float) : (float) Volume to validate
Returns: (bool) True if volume is valid
sanitize_price(price, default_value)
sanitize_price
@description Sanitizes price value to ensure it's within valid range
Parameters:
price (float) : (float) Price to sanitize
default_value (float) : (float) Default value if price is invalid
Returns: (float) Sanitized price value
sanitize_percentage(pct)
sanitize_percentage
@description Sanitizes percentage value to 0-100 range
Parameters:
pct (float) : (float) Percentage to sanitize
Returns: (float) Sanitized percentage (0-100)
is_session_active(session_string, timezone)
Parameters:
session_string (string)
timezone (string)
get_session_progress(session_string, timezone)
Parameters:
session_string (string)
timezone (string)
format_price(price, decimals)
Parameters:
price (float)
decimals (int)
format_percentage(pct, decimals)
Parameters:
pct (float)
decimals (int)
bool_to_emoji(condition, true_emoji, false_emoji)
Parameters:
condition (bool)
true_emoji (string)
false_emoji (string)
log_debug(message, level)
Parameters:
message (string)
level (string)
benchmark_start()
benchmark_end(start_time)
Parameters:
start_time (int)
get_library_info()
get_library_version()
SafeCalculationResult
SafeCalculationResult
Fields:
value (series float) : (float) The calculated value
is_valid (series bool) : (bool) Whether the calculation was successful
error_message (series string) : (string) Error description if calculation failed
ArrayStats
ArrayStats
Fields:
size (series int) : (int) Current array size
max_size (series int) : (int) Maximum allowed size
is_full (series bool) : (bool) Whether array has reached max capacity

CGMALibrary "CGMA"
This library provides a function to calculate a moving average based on Chebyshev-Gauss Quadrature. This method samples price data more intensely from the beginning and end of the lookback window, giving it a unique character that responds quickly to recent changes while also having a long "memory" of the trend's start. Inspired by reading rohangautam.github.io
What is Chebyshev-Gauss Quadrature?
It's a numerical method to approximate the integral of a function f(x) that is weighted by 1/sqrt(1-x^2) over the interval . The approximation is a simple sum: ∫ f(x)/sqrt(1-x^2) dx ≈ (π/n) * Σ f(xᵢ) where xᵢ are special points called Chebyshev nodes.
How is this applied to a Moving Average?
A moving average can be seen as the "mean value" of the price over a lookback window. The mean value of a function with the Chebyshev weight is calculated as:
Mean = /
The math simplifies beautifully, resulting in the mean being the simple arithmetic average of the function evaluated at the Chebyshev nodes:
Mean = (1/n) * Σ f(xᵢ)
What's unique about this MA?
The Chebyshev nodes xᵢ are not evenly spaced. They are clustered towards the ends of the interval . We map this interval to our lookback period. This means the moving average samples prices more intensely from the beginning and the end of the lookback window, and less intensely from the middle. This gives it a unique character, responding quickly to recent changes while also having a long "memory" of the start of the trend.

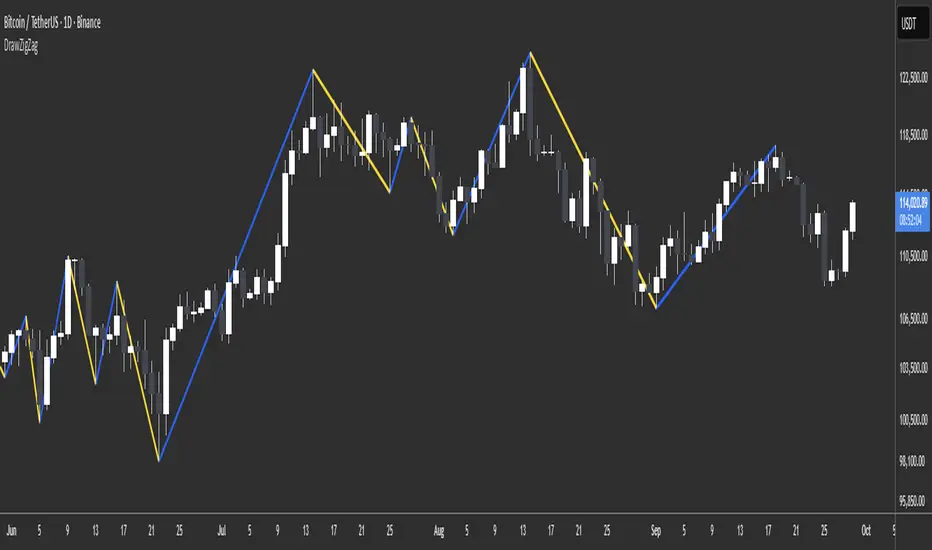
DrawZigZag🟩 OVERVIEW
This library draws zigzag lines for existing pivots. It is designed to be simple to use. If your script creates pivots and you want to join them up while handling edge cases, this library does that quickly and efficiently. If you want your pivots created for you, choose one of the many other zigzag libraries that do that.
🟩 HOW TO USE
Pine Script libraries contain reusable code for importing into indicators. You do not need to copy any code out of here. Just import the library and call the function you want.
For example, for version 1 of this library, import it like this:
import SimpleCryptoLife/DrawZigZag/1
See the EXAMPLE USAGE sections within the library for examples of calling the functions.
For more information on libraries and incorporating them into your scripts, see the Libraries section of the Pine Script User Manual.
🟩 WHAT IT DOES
I looked at every zigzag library on TradingView, after finishing this one. They all seemed to fall into two groups in terms of functionality:
• Create the pivots themselves, using a combination of Williams-style pivots and sometimes price distance.
• Require an array of pivot information, often in a format that uses user-defined types.
My library takes a completely different approach.
Firstly, it only does the drawing. It doesn't calculate the pivots for you. This isn't laziness. There are so many ways to define pivots and that should be up to you. If you've followed my work on market structure you know what I think of Williams pivots.
Secondly, when you pass information about your pivots to the library function, you only need the minimum of pivot information -- whether it's a High or Low pivot, the price, and the bar index. Pass these as normal variables -- bools, ints, and floats -- on the fly as your pivots confirm. It is completely agnostic as to how you derive your pivots. If they are confirmed an arbitrary number of bars after they happen, that's fine.
So why even bother using it if all it does it draw some lines?
Turns out there is quite some logic needed in order to connect highs and lows in the right way, and to handle edge cases. This is the kind of thing one can happily outsource.
🟩 THE RULES
• Zigs and zags must alternate between Highs and Lows. We never connect a High to a High or a Low to a Low.
• If a candle has both a High and Low pivot confirmed on it, the first line is drawn to the end of the candle that is the opposite to the previous pivot. Then the next line goes vertically through the candle to the other end, and then after that continues normally.
• If we draw a line up from a Low to a High pivot, and another High pivot comes in higher, we *extend* the line up, and the same for lines down. Yes this is a form of repainting. It is in my opinion the only way to end up with a correct structure.
• We ignore lower highs on the way up and higher lows on the way down.
🟩 WHAT'S COOL ABOUT THIS LIBRARY
• It's simple and lightweight: no exported user-defined types, no helper methods, no matrices.
• It's really fast. In my profiling it runs at about ~50ms, and changing the options (e.g., trimming the array) doesn't make very much difference.
• You only need to call one function, which does all the calculations and draws all lines.
• There are two variations of this function though -- one simple function that just draws lines, and one slightly more advanced method that modifies an array containing the lines. If you don't know which one you want, use the simpler one.
🟩 GEEK STUFF
• There are no dependencies on other libraries.
• I tried to make the logic as clear as I could and comment it appropriately.
• In the `f_drawZigZags` function, the line variable is declared using the `var` keyword *inside* the function, for simplicity. For this reason, it persists between function calls *only* if the function is called from the global scope or a local if block. In general, if a function is called from inside a loop , or multiple times from different contexts, persistent variables inside that function are re-initialised on each call. In this case, this re-initialisation would mean that the function loses track of the previous line, resulting in incorrect drawings. This is why you cannot call the `f_drawZigZags` function from a loop (not that there's any reason to). The `m_drawZigZagsArray` does not use any internal `var` variables.
• The function itself takes a Boolean parameter `_showZigZag`, which turns the drawings on and off, so there is no need to call the function conditionally. In the examples, we do call the functions from an if block, purely as an illustration of how to increase performance by restricting the amount of code that needs to be run.
🟩 BRING ON THE FUNCTIONS
f_drawZigZags(_showZigZag, _isHighPivot, _isLowPivot, _highPivotPrice, _lowPivotPrice, _pivotIndex, _zigzagWidth, _lineStyle, _upZigColour, _downZagColour)
This function creates or extends the latest zigzag line. Takes real-time information about pivots and draws lines. It does not calculate the pivots. It must be called once per script and cannot be called from a loop.
Parameters:
_showZigZag (bool) : Whether to show the zigzag lines.
_isHighPivot (bool) : Whether the current bar confirms a high pivot. Note that pivots are confirmed after the bar in which they occur.
_isLowPivot (bool) : Whether the current bar confirms a low pivot.
_highPivotPrice (float) : The price of the high pivot that was confirmed this bar. It is NOT the high price of the current bar.
_lowPivotPrice (float) : The price of the low pivot that was confirmed this bar. It is NOT the low price of the current bar.
_pivotIndex (int) : The bar index of the pivot that was confirmed this bar. This is not an offset. It's the `bar_index` value of the pivot.
_zigzagWidth (int) : The width of the zigzag lines.
_lineStyle (string) : The style of the zigzag lines.
_upZigColour (color) : The colour of the up zigzag lines.
_downZagColour (color) : The colour of the down zigzag lines.
Returns: The function has no explicit returns. As a side effect, it draws or updates zigzag lines.
method m_drawZigZagsArray(_a_zigZagLines, _showZigZag, _isHighPivot, _isLowPivot, _highPivotPrice, _lowPivotPrice, _pivotIndex, _zigzagWidth, _lineStyle, _upZigColour, _downZagColour, _trimArray)
Namespace types: array
Parameters:
_a_zigZagLines (array)
_showZigZag (bool) : Whether to show the zigzag lines.
_isHighPivot (bool) : Whether the current bar confirms a high pivot. Note that pivots are usually confirmed after the bar in which they occur.
_isLowPivot (bool) : Whether the current bar confirms a low pivot.
_highPivotPrice (float) : The price of the high pivot that was confirmed this bar. It is NOT the high price of the current bar.
_lowPivotPrice (float) : The price of the low pivot that was confirmed this bar. It is NOT the low price of the current bar.
_pivotIndex (int) : The bar index of the pivot that was confirmed this bar. This is not an offset. It's the `bar_index` value of the pivot.
_zigzagWidth (int) : The width of the zigzag lines.
_lineStyle (string) : The style of the zigzag lines.
_upZigColour (color) : The colour of the up zigzag lines.
_downZagColour (color) : The colour of the down zigzag lines.
_trimArray (bool) : If true, the array of lines is kept to a maximum size of two lines (the line elements are not deleted). If false (the default), the array is kept to a maximum of 500 lines (the maximum number of line objects a single Pine script can display).
Returns: This function has no explicit returns but it modifies a global array of zigzag lines.
MirPapa_Library_ICTLibrary "MirPapa_Library_ICT"
GetHTFoffsetToLTFoffset(_offset, _chartTf, _htfTf)
GetHTFoffsetToLTFoffset
@description Adjust an HTF offset to an LTF offset by calculating the ratio of timeframes.
Parameters:
_offset (int) : int The HTF bar offset (0 means current HTF bar).
_chartTf (string) : string The current chart’s timeframe (e.g., "5", "15", "1D").
_htfTf (string) : string The High Time Frame string (e.g., "60", "1D").
@return int The corresponding LTF bar index. Returns 0 if the result is negative.
IsConditionState(_type, _isBull, _level, _open, _close, _open1, _close1, _low1, _low2, _low3, _low4, _high1, _high2, _high3, _high4)
IsConditionState
@description Evaluate a condition state based on type for COB, FVG, or FOB.
Overloaded: first signature handles COB, second handles FVG/FOB.
Parameters:
_type (string) : string Condition type ("cob", "fvg", "fob").
_isBull (bool) : bool Direction flag: true for bullish, false for bearish.
_level (int) : int Swing level (only used for COB).
_open (float) : float Current bar open price (only for COB).
_close (float) : float Current bar close price (only for COB).
_open1 (float) : float Previous bar open price (only for COB).
_close1 (float) : float Previous bar close price (only for COB).
_low1 (float) : float Low 1 bar ago (only for COB).
_low2 (float) : float Low 2 bars ago (only for COB).
_low3 (float) : float Low 3 bars ago (only for COB).
_low4 (float) : float Low 4 bars ago (only for COB).
_high1 (float) : float High 1 bar ago (only for COB).
_high2 (float) : float High 2 bars ago (only for COB).
_high3 (float) : float High 3 bars ago (only for COB).
_high4 (float) : float High 4 bars ago (only for COB).
@return bool True if the specified condition is met, false otherwise.
IsConditionState(_type, _isBull, _pricePrev, _priceNow)
IsConditionState
@description Evaluate FVG or FOB condition based on price movement.
Parameters:
_type (string) : string Condition type ("fvg", "fob").
_isBull (bool) : bool Direction flag: true for bullish, false for bearish.
_pricePrev (float) : float Previous price (for FVG/FOB).
_priceNow (float) : float Current price (for FVG/FOB).
@return bool True if the specified condition is met, false otherwise.
IsSwingHighLow(_isBull, _level, _open, _close, _open1, _close1, _low1, _low2, _low3, _low4, _high1, _high2, _high3, _high4)
IsSwingHighLow
@description Public wrapper for isSwingHighLow.
Parameters:
_isBull (bool) : bool Direction flag: true for bullish, false for bearish.
_level (int) : int Swing level (1 or 2).
_open (float) : float Current bar open price.
_close (float) : float Current bar close price.
_open1 (float) : float Previous bar open price.
_close1 (float) : float Previous bar close price.
_low1 (float) : float Low 1 bar ago.
_low2 (float) : float Low 2 bars ago.
_low3 (float) : float Low 3 bars ago.
_low4 (float) : float Low 4 bars ago.
_high1 (float) : float High 1 bar ago.
_high2 (float) : float High 2 bars ago.
_high3 (float) : float High 3 bars ago.
_high4 (float) : float High 4 bars ago.
@return bool True if swing condition is met, false otherwise.
AddBox(_left, _right, _top, _bot, _xloc, _colorBG, _colorBD)
AddBox
@description Draw a rectangular box on the chart with specified coordinates and colors.
Parameters:
_left (int) : int Left bar index for the box.
_right (int) : int Right bar index for the box.
_top (float) : float Top price coordinate for the box.
_bot (float) : float Bottom price coordinate for the box.
_xloc (string) : string X-axis location type (e.g., xloc.bar_index).
_colorBG (color) : color Background color for the box.
_colorBD (color) : color Border color for the box.
@return box Returns the created box object.
Addline(_x, _y, _xloc, _color, _width)
Addline
@description Draw a vertical or horizontal line at specified coordinates.
Parameters:
_x (int) : int X-coordinate for start (bar index).
_y (int) : float Y-coordinate for start (price).
_xloc (string) : string X-axis location type (e.g., xloc.bar_index).
_color (color) : color Line color.
_width (int) : int Line width.
@return line Returns the created line object.
Addline(_x, _y, _xloc, _color, _width)
Parameters:
_x (int)
_y (float)
_xloc (string)
_color (color)
_width (int)
Addline(_x1, _y1, _x2, _y2, _xloc, _color, _width)
Parameters:
_x1 (int)
_y1 (int)
_x2 (int)
_y2 (int)
_xloc (string)
_color (color)
_width (int)
Addline(_x1, _y1, _x2, _y2, _xloc, _color, _width)
Parameters:
_x1 (int)
_y1 (int)
_x2 (int)
_y2 (float)
_xloc (string)
_color (color)
_width (int)
Addline(_x1, _y1, _x2, _y2, _xloc, _color, _width)
Parameters:
_x1 (int)
_y1 (float)
_x2 (int)
_y2 (int)
_xloc (string)
_color (color)
_width (int)
Addline(_x1, _y1, _x2, _y2, _xloc, _color, _width)
Parameters:
_x1 (int)
_y1 (float)
_x2 (int)
_y2 (float)
_xloc (string)
_color (color)
_width (int)
AddlineMid(_type, _left, _right, _top, _bot, _xloc, _color, _width)
AddlineMid
@description Draw a midline between top and bottom for FVG or FOB types.
Parameters:
_type (string) : string Type identifier: "fvg" or "fob".
_left (int) : int Left bar index for midline start.
_right (int) : int Right bar index for midline end.
_top (float) : float Top price of the region.
_bot (float) : float Bottom price of the region.
_xloc (string) : string X-axis location type (e.g., xloc.bar_index).
_color (color) : color Line color.
_width (int) : int Line width.
@return line or na Returns the created line or na if type is not recognized.
GetHtfFromLabel(_label)
GetHtfFromLabel
@description Convert a Korean HTF label into a Pine Script timeframe string via handler library.
Parameters:
_label (string) : string The Korean label (e.g., "5분", "1시간").
@return string Returns the corresponding Pine Script timeframe (e.g., "5", "60").
IsChartTFcomparisonHTF(_chartTf, _htfTf)
IsChartTFcomparisonHTF
@description Determine whether a given HTF is greater than or equal to the current chart timeframe.
Parameters:
_chartTf (string) : string Current chart timeframe (e.g., "5", "15", "1D").
_htfTf (string) : string HTF timeframe (e.g., "60", "1D").
@return bool True if HTF ≥ chartTF, false otherwise.
CreateBoxData(_type, _isBull, _useLine, _top, _bot, _xloc, _colorBG, _colorBD, _offset, _htfTf, htfBarIdx, _basePoint)
CreateBoxData
@description Create and draw a box and optional midline for given type and parameters. Returns success flag and BoxData.
Parameters:
_type (string) : string Type identifier: "fvg", "fob", "cob", or "sweep".
_isBull (bool) : bool Direction flag: true for bullish, false for bearish.
_useLine (bool) : bool Whether to draw a midline inside the box.
_top (float) : float Top price of the box region.
_bot (float) : float Bottom price of the box region.
_xloc (string) : string X-axis location type (e.g., xloc.bar_index).
_colorBG (color) : color Background color for the box.
_colorBD (color) : color Border color for the box.
_offset (int) : int HTF bar offset (0 means current HTF bar).
_htfTf (string) : string HTF timeframe string (e.g., "60", "1D").
htfBarIdx (int) : int HTF bar_index (passed from HTF request).
_basePoint (float) : float Base point for breakout checks.
@return tuple(bool, BoxData) Returns a boolean indicating success and the created BoxData struct.
ProcessBoxDatas(_datas, _useMidLine, _closeCount, _colorClose)
ProcessBoxDatas
@description Process an array of BoxData structs: extend, record volume, update stage, and finalize boxes.
Parameters:
_datas (array) : array Array of BoxData objects to process.
_useMidLine (bool) : bool Whether to update the midline endpoint.
_closeCount (int) : int Number of touches required to close the box.
_colorClose (color) : color Color to apply when a box closes.
@return void No return value; updates are in-place.
BoxData
Fields:
_isActive (series bool)
_isBull (series bool)
_box (series box)
_line (series line)
_basePoint (series float)
_boxTop (series float)
_boxBot (series float)
_stage (series int)
_isStay (series bool)
_volBuy (series float)
_volSell (series float)
_result (series string)
LineData
Fields:
_isActive (series bool)
_isBull (series bool)
_line (series line)
_basePoint (series float)
_stage (series int)
_isStay (series bool)
_result (series string)

FvgPanel█ OVERVIEW
This library provides functionalities for creating and managing a display panel within a Pine Script™ indicator. Its primary purpose is to offer a structured way to present Fair Value Gap (FVG) information, specifically the nearest bullish and bearish FVG levels across different timeframes (Current, MTF, HTF), directly on the chart. The library handles the table's structure, header initialization, and dynamic cell content updates.
█ CONCEPTS
The core of this library revolves around presenting summarized FVG data in a clear, tabular format. Key concepts include:
FVG Data Aggregation and Display
The panel is designed to show at-a-glance information about the closest active FVG mitigation levels. It doesn't calculate these FVGs itself but relies on the main script to provide this data. The panel is structured with columns for timeframes (TF), Bullish FVGs, and Bearish FVGs, and rows for "Current" (LTF), "MTF" (Medium Timeframe), and "HTF" (High Timeframe).
The `panelData` User-Defined Type (UDT)
To facilitate the transfer of information to be displayed, the library defines a UDT named `panelData`. This structure is central to the library's operation and is designed to hold all necessary values for populating the panel's data cells for each relevant FVG. Its fields include:
Price levels for the nearest bullish and bearish FVGs for LTF, MTF, and HTF (e.g., `nearestBullMitLvl`, `nearestMtfBearMitLvl`).
Boolean flags to indicate if these FVGs are classified as "Large Volume" (LV) (e.g., `isNearestBullLV`, `isNearestMtfBearLV`).
Color information for the background and text of each data cell, allowing for conditional styling based on the FVG's status or proximity (e.g., `ltfBullBgColor`, `mtfBearTextColor`).
The design of `panelData` allows the main script to prepare all display-related data and styling cues in one object, which is then passed to the `updatePanel` function for rendering. This separation of data preparation and display logic keeps the library focused on its presentation task.
Visual Cues and Formatting
Price Formatting: Price levels are formatted to match the instrument's minimum tick size using an internal `formatPrice` helper function, ensuring consistent and accurate display.
Large FVG Icon: If an FVG is marked as a "Large Volume" FVG in the `panelData` object, a user-specified icon (e.g., an emoji) is prepended to its price level in the panel, providing an immediate visual distinction.
Conditional Styling: The background and text colors for each FVG level displayed in the panel can be individually controlled via the `panelData` object, enabling the main script to implement custom styling rules (e.g., highlighting the overall nearest FVG across all timeframes).
Handling Missing Data: If no FVG data is available for a particular cell (i.e., the corresponding level in `panelData` is `na`), the panel displays "---" and uses a specified background color for "Not Available" cells.
█ CALCULATIONS AND USE
Using the `FvgPanel` typically involves a two-stage process: initialization and dynamic updates.
Step 1: Panel Creation
First, an instance of the panel table is created once, usually during the script's initial setup. This is done using the `createPanel` function.
Call `createPanel()` with parameters defining its position on the chart, border color, border width, header background color, header text color, and header text size.
This function initializes the table with three columns ("TF", "Bull FVG", "Bear FVG") and three data rows labeled "Current", "MTF", and "HTF", plus a header row.
Store the returned `table` object in a `var` variable to persist it across bars.
// Example:
var table infoPanel = na
if barstate.isfirst
infoPanel := panel.createPanel(
position.top_right,
color.gray,
1,
color.new(color.gray, 50),
color.white,
size.small
)
Step 2: Panel Updates
On each bar, or whenever the FVG data changes (typically on `barstate.islast` or `barstate.isrealtime` for efficiency), the panel's content needs to be refreshed. This is done using the `updatePanel` function.
Populate an instance of the `panelData` UDT with the latest FVG information. This includes setting the nearest bullish/bearish mitigation levels for LTF, MTF, and HTF, their LV status, and their desired background and text colors.
Call `updatePanel()`, passing the persistent `table` object (from Step 1), the populated `panelData` object, the icon string for LV FVGs, the default text color for FVG levels, the background color for "N/A" cells, and the general text size for the data cells.
The `updatePanel` function will then clear previous data and fill the table cells with the new values and styles provided in the `panelData` object.
// Example (inside a conditional block like 'if barstate.islast'):
var panelData fvgDisplayData = panelData.new()
// ... (logic to populate fvgDisplayData fields) ...
// fvgDisplayData.nearestBullMitLvl = ...
// fvgDisplayData.ltfBullBgColor = ...
// ... etc.
if not na(infoPanel)
panel.updatePanel(
infoPanel,
fvgDisplayData,
"🔥", // LV FVG Icon
color.white,
color.new(color.gray, 70), // NA Cell Color
size.small
)
This workflow ensures that the panel is drawn only once and its cells are efficiently updated as new data becomes available.
█ NOTES
Data Source: This library is solely responsible for the visual presentation of FVG data in a table. It does not perform any FVG detection or calculation. The calling script must compute or retrieve the FVG levels, LV status, and desired styling to populate the `panelData` object.
Styling Responsibility: While `updatePanel` applies colors passed via the `panelData` object, the logic for *determining* those colors (e.g., highlighting the closest FVG to the current price) resides in the calling script.
Performance: The library uses `table.cell()` to update individual cells, which is generally more efficient than deleting and recreating the table on each update. However, the frequency of `updatePanel` calls should be managed by the main script (e.g., using `barstate.islast` or `barstate.isrealtime`) to avoid excessive processing on historical bars.
`series float` Handling: The price level fields within the `panelData` UDT (e.g., `nearestBullMitLvl`) can accept `series float` values, as these are typically derived from price data. The internal `formatPrice` function correctly handles `series float` for display.
Dependencies: The `FvgPanel` itself is self-contained and does not import other user libraries. It uses standard Pine Script™ table and string functionalities.
█ EXPORTED TYPES
panelData
Represents the data structure for populating the FVG information panel.
Fields:
nearestBullMitLvl (series float) : The price level of the nearest bullish FVG's mitigation point (bottom for bull) on the LTF.
isNearestBullLV (series bool) : True if the nearest bullish FVG on the LTF is a Large Volume FVG.
ltfBullBgColor (series color) : Background color for the LTF bullish FVG cell in the panel.
ltfBullTextColor (series color) : Text color for the LTF bullish FVG cell in the panel.
nearestBearMitLvl (series float) : The price level of the nearest bearish FVG's mitigation point (top for bear) on the LTF.
isNearestBearLV (series bool) : True if the nearest bearish FVG on the LTF is a Large Volume FVG.
ltfBearBgColor (series color) : Background color for the LTF bearish FVG cell in the panel.
ltfBearTextColor (series color) : Text color for the LTF bearish FVG cell in the panel.
nearestMtfBullMitLvl (series float) : The price level of the nearest bullish FVG's mitigation point on the MTF.
isNearestMtfBullLV (series bool) : True if the nearest bullish FVG on the MTF is a Large Volume FVG.
mtfBullBgColor (series color) : Background color for the MTF bullish FVG cell.
mtfBullTextColor (series color) : Text color for the MTF bullish FVG cell.
nearestMtfBearMitLvl (series float) : The price level of the nearest bearish FVG's mitigation point on the MTF.
isNearestMtfBearLV (series bool) : True if the nearest bearish FVG on the MTF is a Large Volume FVG.
mtfBearBgColor (series color) : Background color for the MTF bearish FVG cell.
mtfBearTextColor (series color) : Text color for the MTF bearish FVG cell.
nearestHtfBullMitLvl (series float) : The price level of the nearest bullish FVG's mitigation point on the HTF.
isNearestHtfBullLV (series bool) : True if the nearest bullish FVG on the HTF is a Large Volume FVG.
htfBullBgColor (series color) : Background color for the HTF bullish FVG cell.
htfBullTextColor (series color) : Text color for the HTF bullish FVG cell.
nearestHtfBearMitLvl (series float) : The price level of the nearest bearish FVG's mitigation point on the HTF.
isNearestHtfBearLV (series bool) : True if the nearest bearish FVG on the HTF is a Large Volume FVG.
htfBearBgColor (series color) : Background color for the HTF bearish FVG cell.
htfBearTextColor (series color) : Text color for the HTF bearish FVG cell.
█ EXPORTED FUNCTIONS
createPanel(position, borderColor, borderWidth, headerBgColor, headerTextColor, headerTextSize)
Creates and initializes the FVG information panel (table). Sets up the header rows and timeframe labels.
Parameters:
position (simple string) : The position of the panel on the chart (e.g., position.top_right). Uses position.* constants.
borderColor (simple color) : The color of the panel's border.
borderWidth (simple int) : The width of the panel's border.
headerBgColor (simple color) : The background color for the header cells.
headerTextColor (simple color) : The text color for the header cells.
headerTextSize (simple string) : The text size for the header cells (e.g., size.small). Uses size.* constants.
Returns: The newly created table object representing the panel.
updatePanel(panelTable, data, lvIcon, defaultTextColor, naCellColor, textSize)
Updates the content of the FVG information panel with the latest FVG data.
Parameters:
panelTable (table) : The table object representing the panel to be updated.
data (panelData) : An object containing the FVG data to display.
lvIcon (simple string) : The icon (e.g., emoji) to display next to Large Volume FVGs.
defaultTextColor (simple color) : The default text color for FVG levels if not highlighted.
naCellColor (simple color) : The background color for cells where no FVG data is available ("---").
textSize (simple string) : The text size for the FVG level data (e.g., size.small).
Returns: _void

FvgObject█ OVERVIEW
This library provides a suite of methods designed to manage the visual representation and lifecycle of Fair Value Gap (FVG) objects on a Pine Script™ chart. It extends the `fvgObject` User-Defined Type (UDT) by attaching object-oriented functionalities for drawing, updating, and deleting FVG-related graphical elements. The primary goal is to encapsulate complex drawing logic, making the main indicator script cleaner and more focused on FVG detection and state management.
█ CONCEPTS
This library is built around the idea of treating each Fair Value Gap as an "object" with its own visual lifecycle on the chart. This is achieved by defining methods that operate directly on instances of the `fvgObject` UDT.
Object-Oriented Approach for FVGs
Pine Script™ v6 introduced the ability to define methods for User-Defined Types (UDTs). This library leverages this feature by attaching specific drawing and state management functions (methods) directly to the `fvgObject` type. This means that instead of calling global functions with an FVG object as a parameter, you call methods *on* the FVG object itself (e.g., `myFvg.updateDrawings(...)`). This approach promotes better code organization and a more intuitive way to interact with FVG data.
FVG Visual Lifecycle Management
The core purpose of this library is to manage the complete visual journey of an FVG on the chart. This lifecycle includes:
Initial Drawing: Creating the first visual representation of a newly detected FVG, including its main box and optionally its midline and labels.
State Updates & Partial Fills: Modifying the FVG's appearance as it gets partially filled by price. This involves drawing a "mitigated" portion of the box and adjusting the `currentTop` or `currentBottom` of the remaining FVG.
Full Mitigation & Tested State: Handling how an FVG is displayed once fully mitigated. Depending on user settings, it might be hidden, or its box might change color/style to indicate it has been "tested." Mitigation lines can also be managed (kept or deleted).
Midline Interaction: Visually tracking if the price has touched the FVG's 50% equilibrium level (midline).
Visibility Control: Dynamically showing or hiding FVG drawings based on various criteria, such as user settings (e.g., hide mitigated FVGs, timeframe-specific visibility) or external filters (e.g., proximity to current price).
Deletion: Cleaning up all drawing objects associated with an FVG when it's no longer needed or when settings dictate its removal.
Centralized Drawing Logic
By encapsulating all drawing-related operations within the methods of this library, the main indicator script is significantly simplified. The main script can focus on detecting FVGs and managing their state (e.g., in arrays), while delegating the complex task of rendering and updating them on the chart to the methods herein.
Interaction with `fvgObject` and `drawSettings` UDTs
All methods within this library operate on an instance of the `fvgObject` UDT. This `fvgObject` holds not only the FVG's price/time data and state (like `isMitigated`, `currentTop`) but also the IDs of its associated drawing elements (e.g., `boxId`, `midLineId`).
The appearance of these drawings (colors, styles, visibility, etc.) is dictated by a `drawSettings` UDT instance, which is passed as a parameter to most drawing-related methods. This `drawSettings` object is typically populated from user inputs in the main script, allowing for extensive customization.
Stateful Drawing Object Management
The library's methods manage Pine Script™ drawing objects (boxes, lines, labels) by storing their IDs within the `fvgObject` itself (e.g., `fvgObject.boxId`, `fvgObject.mitigatedBoxId`, etc.). Methods like `draw()` create these objects and store their IDs, while methods like `updateDrawings()` modify them, and `deleteDrawings()` removes them using these stored IDs.
Drawing Optimization
The `updateDrawings()` method, which is the most comprehensive drawing management function, incorporates optimization logic. It uses `prev_*` fields within the `fvgObject` (e.g., `prevIsMitigated`, `prevCurrentTop`) to store the FVG's state from the previous bar. By comparing the current state with the previous state, and also considering changes in visibility or relevant drawing settings, it can avoid redundant and performance-intensive drawing operations if nothing visually significant has changed for that FVG.
█ METHOD USAGE AND WORKFLOW
The methods in this library are designed to be called in a logical sequence as an FVG progresses through its lifecycle. A crucial prerequisite for all visual methods in this library is a properly populated `drawSettings` UDT instance, which dictates every aspect of an FVG's appearance, from colors and styles to visibility and labels. This `settings` object must be carefully prepared in the main indicator script, typically based on user inputs, before being passed to these methods.
Here’s a typical workflow within a main indicator script:
1. FVG Instance Creation (External to this library)
An `fvgObject` instance is typically created by functions in another library (e.g., `FvgCalculations`) when a new FVG pattern is identified. This object will have its core properties (top, bottom, startTime, isBullish, tfType) initialized.
2. Initial Drawing (`draw` method)
Once a new `fvgObject` is created and its initial visibility is determined:
Call the `myFvg.draw(settings)` method on the new FVG object.
`settings` is an instance of the `drawSettings` UDT, containing all relevant visual configurations.
This method draws the primary FVG box, its midline (if enabled in `settings`), and any initial labels. It also initializes the `currentTop` and `currentBottom` fields of the `fvgObject` if they are `na`, and stores the IDs of the created drawing objects within the `fvgObject`.
3. Per-Bar State Updates & Interaction Checks
On each subsequent bar, for every active `fvgObject`:
Interaction Check (External Logic): It's common to first use logic (e.g., from `FvgCalculations`' `fvgInteractionCheck` function) to determine if the current bar's price interacts with the FVG.
State Field Updates (External Logic): Before calling the `FvgObjectLib` methods below, ensure that your `fvgObject`'s state fields (such as `isMitigated`, `currentTop`, `currentBottom`, `isMidlineTouched`) are updated using the current bar's price data and relevant functions from other libraries (e.g., `FvgCalculations`' `checkMitigation`, `checkPartialMitigation`, etc.). This library's methods render the FVG based on these pre-updated state fields.
If interaction occurs and the FVG is not yet fully mitigated:
Full Mitigation Update (`updateMitigation` method): Call `myFvg.updateMitigation(high, low)`. This method updates `myFvg.isMitigated` and `myFvg.mitigationTime` if full mitigation occurs, based on the interaction determined by external logic.
Partial Fill Update (`updatePartialFill` method): If not fully mitigated, call `myFvg.updatePartialFill(high, low, settings)`. This method updates `myFvg.currentTop` or `myFvg.currentBottom` and adjusts drawings to show the filled portion, again based on prior interaction checks and fill level calculations.
Midline Touch Check (`checkMidlineTouch` method): Call `myFvg.checkMidlineTouch(high, low)`. This method updates `myFvg.isMidlineTouched` if the price touches the FVG's 50% level.
4. Comprehensive Visual Update (`updateDrawings` method)
After the FVG's state fields have been potentially updated by external logic and the methods in step 3:
Call `myFvg.updateDrawings(isVisibleNow, settings)` on each FVG object.
`isVisibleNow` is a boolean indicating if the FVG should currently be visible.
`settings` is the `drawSettings` UDT instance.
This method synchronizes the FVG's visual appearance with its current state and settings, managing all drawing elements (boxes, lines, labels), their styles, and visibility. It efficiently skips redundant drawing operations if the FVG's state or visibility has not changed, thanks to its internal optimization using `prev_*` fields, which are also updated by this method.
5. Deleting Drawings (`deleteDrawings` method)
When an FVG object is no longer tracked:
Call `myFvg.deleteDrawings(deleteTestedToo)`.
This method removes all drawing objects associated with that `fvgObject`.
This workflow ensures that FVG visuals are accurately maintained throughout their existence on the chart.
█ NOTES
Dependencies: This library relies on `FvgTypes` for `fvgObject` and `drawSettings` definitions, and its methods (`updateMitigation`, `updatePartialFill`) internally call functions from `FvgCalculations`.
Drawing Object Management: Be mindful of TradingView's limits on drawing objects per script. The main script should manage the number of active FVG objects.
Performance and `updateDrawings()`: The `updateDrawings()` method is comprehensive. Its internal optimization (checking `hasStateChanged` based on `prev_*` fields) is crucial for performance. Call it judiciously.
Role of `settings.currentTime`: The `currentTime` field in `drawSettings` is key for positioning time-dependent elements like labels and the right edge of non-extended drawings.
Mutability of `fvgObject` Instances: Methods in this library directly modify the `fvgObject` instance they are called upon (e.g., its state fields and drawing IDs).
Drawing ID Checks: Methods generally check if drawing IDs are `na` before acting on them, preventing runtime errors.
█ EXPORTED FUNCTIONS
method draw(this, settings)
Draws the initial visual representation of the FVG object on the chart. This includes the main FVG box, its midline (if enabled), and a label
(if enabled for the specific timeframe). This method is typically invoked
immediately after an FVG is first detected and its initial properties are set. It uses drawing settings to customize the appearance based on the FVG's timeframe type.
Namespace types: types.fvgObject
Parameters:
this (fvgObject type from no1x/FvgTypes/1) : The FVG object instance to be drawn. Core properties (top, bottom,
startTime, isBullish, tfType) should be pre-initialized. This method will
initialize boxId, midLineId, boxLabelId (if applicable), and
currentTop/currentBottom (if currently na) on this object.
settings (drawSettings type from no1x/FvgTypes/1) : A drawSettings object providing all visual parameters. Reads display settings (colors, styles, visibility for boxes, midlines, labels,
box extension) relevant to this.tfType. settings.currentTime is used for
positioning labels and the right boundary of non-extended boxes.
method updateMitigation(this, highVal, lowVal)
Checks if the FVG has been fully mitigated by the current bar's price action.
Namespace types: types.fvgObject
Parameters:
this (fvgObject type from no1x/FvgTypes/1) : The FVG object instance. Reads this.isMitigated, this.isVisible,
this.isBullish, this.top, this.bottom. Updates this.isMitigated and
this.mitigationTime if full mitigation occurs.
highVal (float) : The high price of the current bar, used for mitigation check.
lowVal (float) : The low price of the current bar, used for mitigation check.
method updatePartialFill(this, highVal, lowVal, settings)
Checks for and processes partial fills of the FVG.
Namespace types: types.fvgObject
Parameters:
this (fvgObject type from no1x/FvgTypes/1) : The FVG object instance. Reads this.isMitigated, this.isVisible,
this.isBullish, this.currentTop, this.currentBottom, original this.top/this.bottom,
this.startTime, this.tfType, this.isLV. Updates this.currentTop or
this.currentBottom, creates/updates this.mitigatedBoxId, and may update this.boxId's
top/bottom to reflect the filled portion.
highVal (float) : The high price of the current bar, used for partial fill check.
lowVal (float) : The low price of the current bar, used for partial fill check.
settings (drawSettings type from no1x/FvgTypes/1) : The drawing settings. Reads timeframe-specific colors for mitigated
boxes (e.g., settings.mitigatedBullBoxColor, settings.mitigatedLvBullColor),
box extension settings (settings.shouldExtendBoxes, settings.shouldExtendMtfBoxes, etc.),
and settings.currentTime to style and position the mitigatedBoxId and potentially adjust the main boxId.
method checkMidlineTouch(this, highVal, lowVal)
Checks if the FVG's midline (50% level or Equilibrium) has been touched.
Namespace types: types.fvgObject
Parameters:
this (fvgObject type from no1x/FvgTypes/1) : The FVG object instance. Reads this.midLineId, this.isMidlineTouched,
this.top, this.bottom. Updates this.isMidlineTouched if a touch occurs.
highVal (float) : The high price of the current bar, used for midline touch check.
lowVal (float) : The low price of the current bar, used for midline touch check.
method deleteDrawings(this, deleteTestedToo)
Deletes all visual drawing objects associated with this FVG object.
Namespace types: types.fvgObject
Parameters:
this (fvgObject type from no1x/FvgTypes/1) : The FVG object instance. Deletes drawings referenced by boxId,
mitigatedBoxId, midLineId, mitLineId, boxLabelId, mitLineLabelId,
and potentially testedBoxId, keptMitLineId. Sets these ID fields to na.
deleteTestedToo (simple bool) : If true, also deletes drawings for "tested" FVGs
(i.e., testedBoxId and keptMitLineId).
method updateDrawings(this, isVisibleNow, settings)
Manages the comprehensive update of all visual elements of an FVG object
based on its current state (e.g., active, mitigated, partially filled) and visibility. It handles the drawing, updating, or deletion of FVG boxes (main and mitigated part),
midlines, mitigation lines, and their associated labels. Visibility is determined by the isVisibleNow parameter and relevant settings
(like settings.shouldHideMitigated or timeframe-specific show flags). This method is central to the FVG's visual lifecycle and includes optimization
to avoid redundant drawing operations if the FVG's relevant state or appearance
settings have not changed since the last bar. It also updates the FVG object's internal prev_* state fields for future optimization checks.
Namespace types: types.fvgObject
Parameters:
this (fvgObject type from no1x/FvgTypes/1) : The FVG object instance to update. Reads most state fields (e.g.,
isMitigated, currentTop, tfType, etc.) and updates all drawing ID fields
(boxId, midLineId, etc.), this.isVisible, and all this.prev_* state fields.
isVisibleNow (bool) : A flag indicating whether the FVG should be currently visible. Typically determined by external logic (e.g., visual range filter). Affects
whether active FVG drawings are created/updated or deleted by this method.
settings (drawSettings type from no1x/FvgTypes/1) : A fully populated drawSettings object. This method extensively
reads its fields (colors, styles, visibility toggles, timeframe strings, etc.)
to render FVG components according to this.tfType and current state. settings.currentTime is critical for positioning elements like labels and extending drawings.

MonthlyPnLTableLibrary "MonthlyPnLTable"
monthlyPnL(currentClose, initialOpenPrice, monthsToDisplay)
Parameters:
currentClose (float)
initialOpenPrice (float)
monthsToDisplay (int)
displayPnLTable(pnls, pnlMonths, pnlYears, textSizeOption, labelColor)
Parameters:
pnls (array)
pnlMonths (array)
pnlYears (array)
textSizeOption (string)
labelColor (color)

VolumeFlowOscillatorLibVolume Flow Oscillator Library
Overview
The Volume Flow Oscillator library provides a comprehensive framework for analyzing directional volume flow in financial markets. It creates a multi-band oscillator system that transforms price and volume data into a spectrum of sensitivity bands, revealing the underlying buying and selling pressure.
Technical Approach
The library combines price direction with trading volume to generate an oscillator that fluctuates around a zero line, with positive values indicating buying pressure and negative values showing selling pressure. Using sophisticated ALMA (Arnaud Legoux Moving Average) smoothing techniques with asymmetric sensitivity, the library creates seven distinct bands that help identify various intensity levels of volume flow.
Key Features
Multi-band oscillator system with seven sensitivity levels
Directional volume flow analysis combining price movement and volume
Zero-line oscillation showing the balance between buying and selling pressure
Asymmetric ALMA smoothing for different sensitivity on positive/negative bands
Customizable lookback periods and multipliers for fine-tuning
Color-coded visualization for intuitive chart reading
Applications
This library offers developers a versatile foundation for creating volume-based indicators that go beyond simple volume measurement to reveal the directional force behind market movements. Ideal for confirming price trends, detecting divergences, identifying volume climaxes, and assessing overall market strength.

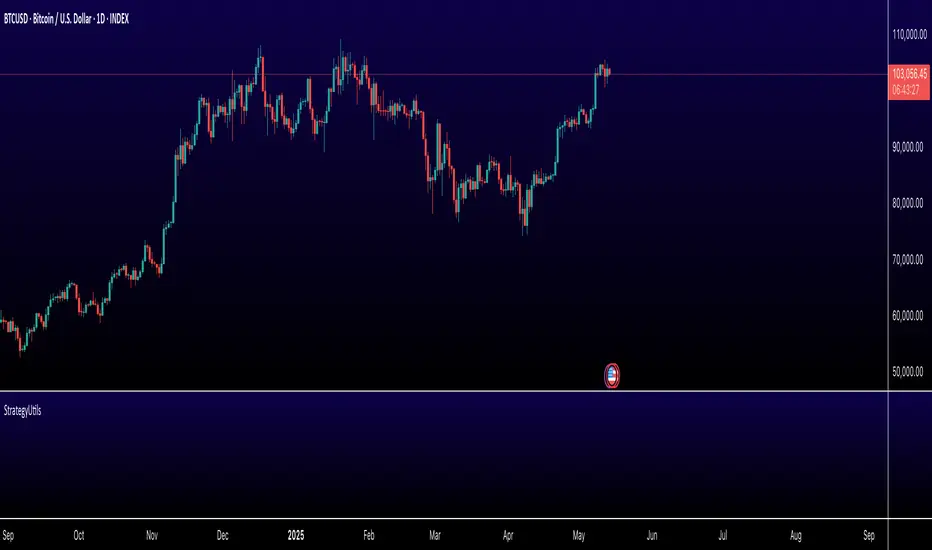
StrategyUtilsLibrary "StrategyUtils"
getHeikinAshi(open, high, low, close)
getHeikinAshi
Parameters:
open (float) : float: Raw open price
high (float) : float: Raw high price
low (float) : float: Raw low price
close (float) : float: Raw close price
Returns: tuple of haOpen, haClose, haHigh, haLow
getFibExtensions(high, low)
getFibExtensions
Parameters:
high (float) : float: Highest point before trade
low (float) : float: Lowest point before trade
Returns: tuple of extension levels
inBacktestWindow(time, start, end)
inBacktestWindow
Parameters:
time (int) : int: Current bar time
start (int) : int: Start timestamp
end (int) : int: End timestamp
Returns: bool: true if within Fbrange
getCurrentState(buy, sell)
getCurrentState
Parameters:
buy (bool) : bool: Buy signal condition
sell (bool) : bool: Sell signal condition
Returns: string: "Buy", "Sell", or "None"
formatPrice(price)
formatPrice
Parameters:
price (float) : float: Input price value
Returns: string: Formatted price string
getColorByProfit(netprofit, initial, green, red)
getColorByProfit
Parameters:
netprofit (float) : float: Strategy net profit
initial (float) : float: Initial capital
green (color) : color: Positive color
red (color) : color: Negative color
Returns: color: Display color based on PnL
UTSConvenienceToolsLibrary "UTSConvenienceTools"
Convenience tool library containing helper functions for drawing and charting.
isDarkColor(color)
Determines on base of the luminance of the given color if the color can be considered a 'dark' color. Usefull for determining the readable font color for arbitrary colored backgrounds. Credits out to:
Parameters:
color (color) : (color): The actual color value.
Returns: (bool): A boolean value.
smallLabelLowerRight(txt, yPos, bgColor)
Displays the specified `txt` in a small label at the `yPos` of the current bar. The label points to the lower right.
Parameters:
txt (string)
yPos (float) : (float): The y-position value. To have it positioned above the candle pass 'high'.
bgColor (color) : (color): The background color value.
Returns: (bool): A boolean value.
smallLabelUpperRight(txt, yPos, bgColor)
Displays the specified `txt` in a small label at the `yPos` of the current bar. The label points to the upper right.
Parameters:
txt (string)
yPos (float) : (float): The y-position value. To have it positioned below the candle pass 'low'.
bgColor (color) : (color): The background color value.
Returns: (bool): A boolean value.
smallLabelCenter(txt, yPos, bgColor)
Displays the specified `txt` in a small label at the `yPos` of the current bar. The label points to the center.
Parameters:
txt (string)
yPos (float) : (float): The y-position value. To have it positioned above the candle pass 'high'. To have it positioned below the candle pass 'low'.
bgColor (color) : (color): The background color value.
Returns: (bool): A boolean value.
smallLabelDown(txt, yPos, bgColor)
Displays the specified `txt` in a small label at the `yPos` of the current bar. The label points down.
Parameters:
txt (string)
yPos (float) : (float): The y-position value. To have it positioned above the candle pass 'high'.
bgColor (color) : (color): The background color value.
Returns: (bool): A boolean value.
smallLabelUp(txt, yPos, bgColor)
Displays the specified `txt` in a small label at the `yPos` of the current bar. The label points down.
Parameters:
txt (string)
yPos (float) : (float): The y-position value. To have it positioned below the candle pass 'low'.
bgColor (color) : (color): The background color value.
Returns: (bool): A boolean value.
normalLabelLowerRight(txt, yPos, bgColor)
Displays the specified `txt` in a normal label at the `yPos` of the current bar. The label points to the lower right.
Parameters:
txt (string)
yPos (float) : (float): The y-position value. To have it positioned above the candle pass 'high'.
bgColor (color) : (color): The background color value.
Returns: (bool): A boolean value.
normalLabelUpperRight(txt, yPos, bgColor)
Displays the specified `txt` in a normal label at the `yPos` of the current bar. The label points to the upper right.
Parameters:
txt (string)
yPos (float) : (float): The y-position value. To have it positioned below the candle pass 'low'.
bgColor (color) : (color): The background color value.
Returns: (bool): A boolean value.
normalLabelCenter(txt, yPos, bgColor)
Displays the specified `txt` in a normal label at the `yPos` of the current bar. The label points to the center.
Parameters:
txt (string)
yPos (float) : (float): The y-position value. To have it positioned above the candle pass 'high'. To have it positioned below the candle pass 'low'.
bgColor (color) : (color): The background color value.
Returns: (bool): A boolean value.
normalLabelDown(txt, yPos, bgColor)
Displays the specified `txt` in a normal label at the `yPos` of the current bar. The label points down.
Parameters:
txt (string)
yPos (float) : (float): The y-position value. To have it positioned above the candle pass 'high'.
bgColor (color) : (color): The background color value.
Returns: (bool): A boolean value.
normalLabelUp(txt, yPos, bgColor)
Displays the specified `txt` in a normal label at the `yPos` of the current bar. The label points down.
Parameters:
txt (string)
yPos (float) : (float): The y-position value. To have it positioned below the candle pass 'low'.
bgColor (color) : (color): The background color value.
Returns: (bool): A boolean value.
largeLabelLowerRight(txt, yPos, bgColor)
Displays the specified `txt` in a large label at the `yPos` of the current bar. The label points to the lower right.
Parameters:
txt (string)
yPos (float) : (float): The y-position value. To have it positioned above the candle pass 'high'.
bgColor (color) : (color): The background color value.
Returns: (bool): A boolean value.
largeLabelUpperRight(txt, yPos, bgColor)
Displays the specified `txt` in a large label at the `yPos` of the current bar. The label points to the upper right.
Parameters:
txt (string)
yPos (float) : (float): The y-position value. To have it positioned below the candle pass 'low'.
bgColor (color) : (color): The background color value.
Returns: (bool): A boolean value.
largeLabelCenter(txt, yPos, bgColor)
Displays the specified `txt` in a large label at the `yPos` of the current bar. The label points to the center.
Parameters:
txt (string)
yPos (float) : (float): The y-position value. To have it positioned above the candle pass 'high'. To have it positioned below the candle pass 'low'.
bgColor (color) : (color): The background color value.
Returns: (bool): A boolean value.
largeLabelDown(txt, yPos, bgColor)
Displays the specified `txt` in a large label at the `yPos` of the current bar. The label points down.
Parameters:
txt (string)
yPos (float) : (float): The y-position value. To have it positioned above the candle pass 'high'.
bgColor (color) : (color): The background color value.
Returns: (bool): A boolean value.
largeLabelUp(txt, yPos, bgColor)
Displays the specified `txt` in a large label at the `yPos` of the current bar. The label points down.
Parameters:
txt (string)
yPos (float) : (float): The y-position value. To have it positioned below the candle pass 'low'.
bgColor (color) : (color): The background color value.
Returns: (bool): A boolean value.
autoLabelLowerRight(txt, yPos, bgColor)
Displays the specified `txt` in a auto label at the `yPos` of the current bar. The label points to the lower right.
Parameters:
txt (string)
yPos (float) : (float): The y-position value. To have it positioned above the candle pass 'high'.
bgColor (color) : (color): The background color value.
Returns: (bool): A boolean value.
autoLabelUpperRight(txt, yPos, bgColor)
Displays the specified `txt` in a auto label at the `yPos` of the current bar. The label points to the upper right.
Parameters:
txt (string)
yPos (float) : (float): The y-position value. To have it positioned below the candle pass 'low'.
bgColor (color) : (color): The background color value.
Returns: (bool): A boolean value.
autoLabelCenter(txt, yPos, bgColor)
Displays the specified `txt` in a auto label at the `yPos` of the current bar. The label points to the center.
Parameters:
txt (string)
yPos (float) : (float): The y-position value. To have it positioned above the candle pass 'high'. To have it positioned below the candle pass 'low'.
bgColor (color) : (color): The background color value.
Returns: (bool): A boolean value.
autoLabelDown(txt, yPos, bgColor)
Displays the specified `txt` in a auto label at the `yPos` of the current bar. The label points down.
Parameters:
txt (string)
yPos (float) : (float): The y-position value. To have it positioned above the candle pass 'high'.
bgColor (color) : (color): The background color value.
Returns: (bool): A boolean value.
autoLabelUp(txt, yPos, bgColor)
Displays the specified `txt` in a auto label at the `yPos` of the current bar. The label points down.
Parameters:
txt (string)
yPos (float) : (float): The y-position value. To have it positioned below the candle pass 'low'.
bgColor (color) : (color): The background color value.
Returns: (bool): A boolean value.

visualizationLibrary "visualization"
method tagLine(message, priceLevel, showCondition, labelPosition, labelSize, offsetX, textColor, bgColor, lineWidth, lineStyle)
Creates a textLabel with line at specified price level
Namespace types: series string, simple string, input string, const string
Parameters:
message (string) : Text to display in the textLabel. If starts with '$', price included. Empty = no textLabel
priceLevel (float) : Price level for textLabel and line positioning
showCondition (bool) : Condition to display the textLabel and line
labelPosition (string) : Label position ("above", "below")
labelSize (string) : Label size
offsetX (int) : X-axis offset for textLabel and line
textColor (color) : Text color
bgColor (color) : Background color
lineWidth (int) : Line width
lineStyle (string) : Line style
Returns: void
textLabel(message, showCondition, position, textColor)
Creates dynamic labels with optional arrows
Parameters:
message (string) : Message to show (prefix with "!" to hide arrow)
showCondition (bool) : Display condition
position (string) : Label position ("above", "below")
textColor (color) : Text color
Returns: void
box(showCondition, topValue, bottomValue, barsBack, borderColor, bgColor)
Creates a box around price range
Parameters:
showCondition (bool) : Condition to draw the box
topValue (float) : Optional custom top value
bottomValue (float) : Optional custom bottom value
barsBack (int) : Number of bars to look back
borderColor (color) : Box border color
bgColor (color) : Box background color
Returns: box Box object

SMCDrawingLibrary "SMCDrawing"
drawSwingPointLabel(bar_index, price, swing_type, text_color, size)
Parameters:
bar_index (int)
price (float)
swing_type (string)
text_color (color)
size (string)
drawBOSLabel(start_bar, price, end_bar, bos_text, line_color, line_style, line_width, text_color, size)
Parameters:
start_bar (int)
price (float)
end_bar (int)
bos_text (string)
line_color (color)
line_style (string)
line_width (int)
text_color (color)
size (string)
drawRetracementLine(start_bar, price, end_bar, line_color, line_style, line_width)
Parameters:
start_bar (int)
price (float)
end_bar (int)
line_color (color)
line_style (string)
line_width (int)
drawFVG(high_time, low_time, high_price, low_price, is_bullish, line_color, line_width, bar_time)
Parameters:
high_time (int)
low_time (int)
high_price (float)
low_price (float)
is_bullish (bool)
line_color (color)
line_width (int)
bar_time (int)
drawBPRLabel(bar_time, price, is_bullish, text_color)
Parameters:
bar_time (int)
price (float)
is_bullish (bool)
text_color (color)
drawVolumeSpike(bar_time, price, percent_oi, normalized_volume, spike_color)
Parameters:
bar_time (int)
price (float)
percent_oi (float)
normalized_volume (float)
spike_color (color)
drawCandle(bar_index, open, high, low, close, up_color, down_color, wick_color, up_border_color, down_border_color)
Parameters:
bar_index (int)
open (float)
high (float)
low (float)
close (float)
up_color (color)
down_color (color)
wick_color (color)
up_border_color (color)
down_border_color (color)
VolumaticDataLibraryLibrary "VolumaticDataLibrary"
norm(src)
Normalizes a value if mean is 0
This function does not access global variables.
Parameters:
src (float)
addVolumeNodeIfSignificant(level, line_amount, node_prices, node_volumes, node_colors, color_up, color_dn, src_open, src_high, src_low, src_close, src_volume)
Processes the current bar's data to see if it represents a significant volume node,
and if so, updates the provided arrays with the node data.
This function should be called on every bar from the consuming indicator/strategy.
Parameters:
level (float) : The sensitivity level for detecting nodes.
line_amount (int) : The maximum number of nodes to store.
node_prices (array) : Array to store node prices (passed by reference).
node_volumes (array) : Array to store node absolute volumes (passed by reference).
node_colors (array) : Array to store node colors (passed by reference).
color_up (color) : The color to use for upward significant volume.
color_dn (color) : The color to use for downward significant volume.
src_open (float) : The open price series from the calling script.
src_high (float) : The high price series from the calling script.
src_low (float) : The low price series from the calling script.
src_close (float) : The close price series from the calling script.
src_volume (float) : The volume series from the calling script.
createVolumeNodeArray(node_prices, node_volumes, node_colors)
Creates an array of VolumeNode objects from the provided separate arrays.
This function can be called on the last bar from the consuming indicator/strategy
to get the current list of significant volume nodes.
Parameters:
node_prices (array) : Array containing the prices of the nodes.
node_volumes (array) : Array containing the absolute volumes of the nodes.
node_colors (array) : Array containing the colors of the nodes.
Returns: An array of VolumeNode objects representing the stored volume nodes.
VolumeNode
Fields:
price (series float)
volume (series float)
node_color (series color)
HexworksSharedUtilitiesLibrary "HexworksSharedUtilities"
Shared global utilities that can be used for
- creating bounded queues from primitives
- checking visibility of objects having Bounds on both (x, y) axes
- checking if a line is too long
method offer(history, value)
Namespace types: FloatHistory
Parameters:
history (FloatHistory)
value (simple float)
method offer(history, value)
Namespace types: IntHistory
Parameters:
history (IntHistory)
value (simple int)
method offer(history, value)
Namespace types: StringHistory
Parameters:
history (StringHistory)
value (simple string)
method offer(history, value)
Namespace types: BoolHistory
Parameters:
history (BoolHistory)
value (simple bool)
method toString(point)
Namespace types: chart.point
Parameters:
point (chart.point)
method toString(num)
Namespace types: simple float, input float, const float
Parameters:
num (simple float)
method toString(num)
Namespace types: simple int, input int, const int
Parameters:
num (simple int)
method toString(value)
Namespace types: simple bool, input bool, const bool
Parameters:
value (simple bool)
method toString(l)
Namespace types: series line
Parameters:
l (line)
method isLineTooLong(fromPoint, toPoint)
Namespace types: chart.point
Parameters:
fromPoint (chart.point)
toPoint (chart.point)
method isTooLong(l)
Namespace types: series line
Parameters:
l (line)
createVisibilityChecker()
method update(v)
Namespace types: VisibilityChecker
Parameters:
v (VisibilityChecker)
method canDraw(v)
Namespace types: VisibilityChecker
Parameters:
v (VisibilityChecker)
method isVisible(v, b)
Namespace types: VisibilityChecker
Parameters:
v (VisibilityChecker)
b (Bounds)
FloatHistory
Fields:
history (array)
maxLength (series int)
IntHistory
Fields:
history (array)
maxLength (series int)
StringHistory
Fields:
history (array)
maxLength (series int)
BoolHistory
Fields:
history (array)
maxLength (series int)
Bounds
Fields:
startIdx (series int)
endIdx (series int)
highValue (series float)
lowValue (series float)
VisibilityChecker
Fields:
leftVisibleBarIdx (series int)
rightVisibleBarIdx (series int)
maxDrawDistance (series int)
updatedAt (series int)
visibleHighest (series float)
visibleLowest (series float)

OHLCVDataOHLCV Data Power Library
Multi-Timeframe Market Data with Mathematical Precision
📌 Overview
This Pine Script library provides structured OHLCV (Open, High, Low, Close, Volume) data across multiple timeframes using mathematically significant candle counts (powers of 3). Designed for technical analysts who work with fractal market patterns and need efficient access to higher timeframe data.
✨ Key Features
6 Timeframes: 5min, 1H, 4H, 6H, 1D, and 1W data
Power-of-3 Candle Counts: 3, 9, 27, 81, and 243 bars
Structured Data: Returns clean OHLCV objects with all price/volume components
Pine Script Optimized: Complies with all security() call restrictions
📊 Timeframe Functions
pinescript
f_get5M_3() // 3 candles of 5min data
f_get1H_27() // 27 candles of 1H data
f_get1D_81() // 81 candles of daily data
// ... and 27 other combinations
🚀 Usage Example
pinescript
import YourName/OHLCVData/1 as OHLCV
weeklyData = OHLCV.f_get1W_27() // Get 27 weekly candles
latestHigh = array.get(weeklyData, 0).high
plot(latestHigh, "Weekly High")
💡 Ideal For
Multi-timeframe analysis
Volume-profile studies
Fractal pattern detection
Higher timeframe confirmation
⚠️ Note
Replace "YourName" with your publishing username
All functions return arrays of OHLCV objects
Maximum lookback = 243 candles
📜 Version History
1.0 - Initial release (2024)

position_toolLibrary "position_tool"
Trying to turn TradingView's position tool into a library from which you can draw position tools for your strategies on the chart. Not sure if this is going to work
calcBaseUnit()
Calculates the chart symbol's base unit of change in asset prices.
Returns: (float) A ticks or pips value of base units of change.
calcOrderPipsOrTicks(orderSize, unit)
Converts the `orderSize` to ticks.
Parameters:
orderSize (float) : (series float) The order size to convert to ticks.
unit (simple float) : (simple float) The basic units of change in asset prices.
Returns: (int) A tick value based on a given order size.
calcProfitLossSize(price, entryPrice, isLongPosition)
Calculates a difference between a `price` and the `entryPrice` in absolute terms.
Parameters:
price (float) : (series float) The price to calculate the difference from.
entryPrice (float) : (series float) The price of entry for the position.
isLongPosition (bool)
Returns: (float) The absolute price displacement of a price from an entry price.
calcRiskRewardRatio(profitSize, lossSize)
Calculates a risk to reward ratio given the size of profit and loss.
Parameters:
profitSize (float) : (series float) The size of the profit in absolute terms.
lossSize (float) : (series float) The size of the loss in absolute terms.
Returns: (float) The ratio between the `profitSize` to the `lossSize`
createPosition(entryPrice, entryTime, tpPrice, slPrice, entryColor, tpColor, slColor, textColor, showExtendRight)
Main function to create a position visualization with entry, TP, and SL
Parameters:
entryPrice (float) : (float) The entry price of the position
entryTime (int) : (int) The entry time of the position in bar_time format
tpPrice (float) : (float) The take profit price
slPrice (float) : (float) The stop loss price
entryColor (color) : (color) Color for entry line
tpColor (color) : (color) Color for take profit zone
slColor (color) : (color) Color for stop loss zone
textColor (color) : (color) Color for text labels
showExtendRight (bool) : (bool) Whether to extend lines to the right
Returns: (bool) Returns true when position is closed
CandlestickUtilitiesThis library provides essential functions for candlestick chart analysis and pattern recognition in Pine Script®.
It includes:
• Candle structure analysis (bodies, shadows, lengths)
• Trend detection using EMAs
• Common candlestick pattern recognition
This library is under construction.
Designed to support strategy development and improve signal accuracy for traders.
Created by @xprophetx — under MPL-2.0 license.

DoppelLibLibrary "DoppelLib"
getDailyClose(offset)
Returns the daily close for a specific offset.
For each offset value (from 1 to 21), the function uses a static request.security() call
to retrieve the daily close from the previous day at the specified offset.
Parameters:
offset (int) : (int) The offset value (from 1 to 21) representing the desired close value.
Returns: (float) The daily close for the specified offset or na if offset is out of range.
isVolumeAboveThreshold(vol, mediaPeriod, thresholdPercent)
Checks if the current volume is above the threshold based on its moving average.
The threshold is calculated as the average volume plus a percentage increment.
Parameters:
vol (float) : (series float) The volume series (e.g. the chart volume).
mediaPeriod (int) : (int) The period for calculating the moving average.
thresholdPercent (float) : (float) The percentage to add to the average for the threshold.
Returns: (bool) True if the volume exceeds the threshold, false otherwise.
calcPvsra(pvsraVolume, pvsraHigh, pvsraLow, pvsraClose, pvsraOpen, redVectorColor, greenVectorColor, violetVectorColor, blueVectorColor, darkGreyCandleColor, lightGrayCandleColor)
Calculates the PVSRA candle color, determines if a vector candle has appeared,
and returns additional support parameters (average volume, volume spread, highest volume spread).
- "High" (Climax): volume >= 200% of the average OR (volume * candle spread) >= highest spread over the previous 10 bars.
-> Bull candle: green; Bear candle: red.
- "Medium": volume >= 150% of the average.
-> Bull candle: blue; Bear candle: violet.
- Otherwise, default (non-vector) candle colors are used.
Parameters:
pvsraVolume (float) : (series float) Volume series.
pvsraHigh (float) : (series float) High price series.
pvsraLow (float) : (series float) Low price series.
pvsraClose (float) : (series float) Close price series.
pvsraOpen (float) : (series float) Open price series.
redVectorColor (simple color) : (simple color) Color for bearish candle in high scenario.
greenVectorColor (simple color) : (simple color) Color for bullish candle in high scenario.
violetVectorColor (simple color) : (simple color) Color for bearish candle in medium scenario.
blueVectorColor (simple color) : (simple color) Color for bullish candle in medium scenario.
darkGreyCandleColor (simple color) : (simple color) Color for bearish candle in non-vector situation.
lightGrayCandleColor (simple color) : (simple color) Color for bullish candle in non-vector situation.
Returns: (tuple) A tuple containing: .

drawingutilsLibrary "drawingutils"
methods used in my scripts for some basic and customized drawings and arrays.
method line(this, p1, p2, lineColor, style, width, xloc, extend)
Draws line and adds to the array
Namespace types: array
Parameters:
this (array) : array to which the created line needs to be added
p1 (chart.point) : point1 of the line
p2 (chart.point) : point2 of the line
lineColor (color) : line color
style (string) : line style
width (int) : line width
xloc (string) : xloc.bar_index or xloc.bar_time
extend (string) : default is extend.none
Returns: line created
method label(this, p, txt, tooltip, xloc, yloc, color, style, textcolor, size, textalign)
Draws label and adds to the array
Namespace types: array
Parameters:
this (array) : array to which the created label needs to be added
p (chart.point) : point at which the label needs to be drawn
txt (string) : label text
tooltip (string) : tooltip text
xloc (string) : xloc value - xloc.bar_index or xloc.bar_time
yloc (string) : y location of the label
color (color) : label color
style (string) : label style
textcolor (color) : label text color
size (string) : Size of the label
textalign (string) : text alignment
Returns: label created
method linefill(this, ln1, ln2, fillColor, transparency)
Draws linefill and adds to array
Namespace types: array
Parameters:
this (array) : array to which the created linefill needs to be added
ln1 (line) : line1 of the fill
ln2 (line) : line2 of the fill
fillColor (color) : fill Color
transparency (int) : fill transparency
Returns: linefill created
draw_labelled_line(target, lblText, linecolor, labelcolor, index, highlight, linesArray, labelsArray, highlightSize, tinySize, yloc, textalign)
Draws labelled line
Parameters:
target (float) : target price
lblText (string) : label text
linecolor (color) : line color
labelcolor (color) : label color
index (int) : index to calculate the distance offset
highlight (bool) : highlight true/false
linesArray (array) : array of lines where the created line is added
labelsArray (array) : array of labels where the created label is added
highlightSize (string) : Size of highlighted text
tinySize (string) : size of non highlighted text
yloc (string) : y location
textalign (string) : text alignment
Returns: void
draw_labelled_box(y1, y2, labelColor, labelText, index, boxArray, labelArray, borderColor, borderStyle, borderWidth, textAlign, highlight, highLightLabel)
Draws custom labelled box
Parameters:
y1 (float) : price 1 of the box
y2 (float) : price 2 of the box
labelColor (color) : label color
labelText (string) : label text
index (int) : index to calculate the offset distance
boxArray (array) : box array to which the box needs to be added
labelArray (array) : label array to which the label needs to be added
borderColor (color) : border color
borderStyle (string) : border style
borderWidth (int) : border width
textAlign (string) : text align of the label
highlight (bool) : highlight label text
highLightLabel (bool) : highlight label size
Returns: void

PivotLabelsLibrary "PivotLabels"
drawPivots(qtyLabels, leftLegs, rightLegs)
Displays a label for each of the last `qtyLabels` pivots.
Colors high pivots in green, low pivots in red, and breached pivots in gray.
Parameters:
qtyLabels (int) : (simple int) Quantity of last labels to display.
leftLegs (int) : (simple int) Left pivot legs.
rightLegs (int) : (simple int) Right pivot legs.
Returns: Nothing.
vidya_calculateLibrary "vidya_calculate"
:
Calculates the Variable Index Dynamic Average (VIDYA).
Computes the VIDYA, which adjusts the degree of smoothing based on the strength of price momentum (absolute value of CMO),
and then returns the 15-period(variable) Simple Moving Average (SMA) of that VIDYA.
VIDYA tends to follow prices more closely when price fluctuations are large, and is smoothed more when fluctuations are small.
CMO = Chande Momentum Oscillator.
vidya(src, vidyaLength, vidyaMomentum, vidyaTrendPeriod)
: Calculates the Variable Index Dynamic Average (VIDYA)
Parameters:
src (float) : : Source
vidyaLength (int) : : VIDYA Length
vidyaMomentum (int) : : VIDYA Momentum
vidyaTrendPeriod (int) : : VIDYA Trend Period (Display)
Returns: : the 15-period(variable) Simple Moving Average (SMA) of that VIDYA
