Mad_StandardpartsLibrary "Mad_Standardparts"
This are my Standardparts used in upcoming scipts
roundTo(_value, _decimals)
Round a floating point value to a specified number of decimal places.
@description This function takes a floating point value and rounds it to a specified number of decimal places.
Parameters:
_value (float) : The floating point value to be rounded.
_decimals (int) : The number of decimal places to round to. Must be a non-negative integer.
Returns: The rounded value, as a floating point number.
clear_all()
Delete all drawings on the chart.
@description This function deletes all drawings on the chart, including lines, boxes, and labels.
Returns: None.
shifting(_value)
Create a string of spaces to shift text over by a specified amount.
@description This function takes an integer value and returns a string consisting of that many spaces, which can be used to shift text over in a PineScript chart.
Parameters:
_value (int) : The number of spaces to create in the output string.
Returns: A string consisting of the specified number of spaces.
fromLog(_value)
Convert a linear value to a logarithmic value.
@description This function takes a linear value and converts it to a logarithmic value, using the formula specified in the code.
Parameters:
_value (float)
Returns: The corresponding logarithmic value, as a floating point number.
toLog(_value)
Convert a logarithmic value to a linear value.
@description This function takes a logarithmic value and converts it to a linear value, using the formula specified in the code.
Parameters:
_value (float)
Returns: The corresponding linear value, as a floating point number.
f_getbartime()
Calculate the time per bar on the chart.
@description This function calculates the time per bar on the chart based on the first 100 bars.
Returns: The time per bar, as an integer value.
Display

Cleaner Screeners LibraryLibrary "cleanscreens"
Screener Panel.
This indicator displays a panel with a list of symbols and their indications.
It can be used as a screener for multiple timess and symbols
in any timeframe and with any indication in any combination.
#### Features
Multiple timeframes
Multiple symbols
Multiple indications per group
Vertical or horizontal layouts
Acceepts External Inputs
Customizable colors with 170 presets included (dark and light)
Customizable icons
Customizable text size and font
Customizable cell size width and height
Customizable frame width and border width
Customizable position
Customizable strong and weak values
Accepts any indicator as input
Only 4 functions to call, easy to use
#### Usage
Initialize the panel with _paneel = cleanscreens.init()
Add groupd with _screener = cleanscreens.Screener(_paneel, "Group Name")
Add indicators to screeener groups with cleanscreens.Indicator(_screener, "Indicator Name", _source)
Update the panel with cleanscreens.display(_paneel)
Thanks @ PineCoders , and the Group members for setting the bar high.
# local setup for methods on our script
import kaigouthro/cleanscreen/1
method Screener ( panel p, string _name) => cleanscreens.Screener ( p, _name)
method Indicator ( screener s , string _tf, string name, float val) => cleanscreens.Indicator ( s , _tf, name, val)
method display ( panel p ) => cleanscreens.display ( p )
init(_themein, loc)
# Panel init
> init a panel for all the screens
Parameters:
_themein (string) : string: Theme Preset Name
loc (int) : int :
1 = left top,
2 = middle top,
3 = right top,
4 = left middle,
5 = middle middle,
6 = right middle,
7 = left bottom,
8 = middle bottom,
9 = right bottom
Returns: panel
method Screener(p, _name)
# Screener - Create a new screener
### Example:
cleanscreens.new(panel, 'Crpyto Screeners')
Namespace types: panel
Parameters:
p (panel)
_name (string)
method Indicator(s, _tf, name, val)
# Indicator - Create a new Indicator
### Example:
cleanscreens.Inidcator('1h', 'RSI', ta.rsi(close, 14))
Namespace types: screener
Parameters:
s (screener)
_tf (string)
name (string)
val (float)
method display(p)
# Display - Display the Panel
### Example:
cleanscreens.display(panel)
Namespace types: panel
Parameters:
p (panel)
indication
single indication for a symbol screener
Fields:
name (series string)
icon (series string)
rating (series string)
value (series float)
col (series color)
tf (series string)
tooltip (series string)
normalized (series float)
init (series bool)
screener
single symbol screener
Fields:
ticker (series string)
icon (series string)
rating (series string)
value (series float)
bg (series color)
fg (series color)
items (indication )
init (series bool)
config
screener configuration
Fields:
strong (series float)
weak (series float)
theme (series string)
vert (series bool)
cellwidth (series float)
cellheight (series float)
textsize (series string)
font (series int)
framewidth (series int)
borders (series int)
position (series string)
icons
screener Icons
Fields:
buy (series string)
sell (series string)
strong (series string)
panel
screener panel object
Fields:
items (screener )
table (series table)
config (config)
theme (theme type from kaigouthro/theme_engine/1)
icons (icons)

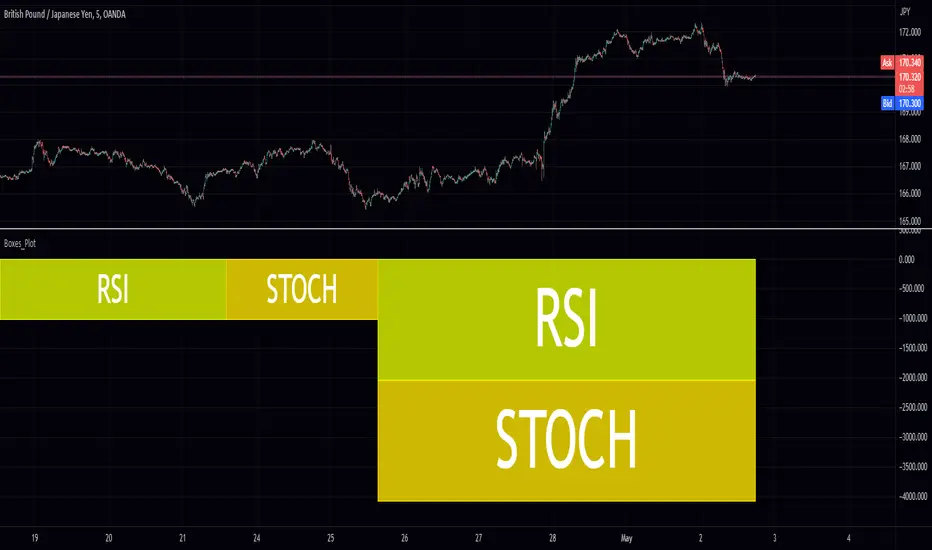
Boxes_PlotIn the world of data visualization, heatmaps are an invaluable tool for understanding complex datasets. They use color gradients to represent the values of individual data points, allowing users to quickly identify patterns, trends, and outliers in their data. In this post, we will delve into the history of heatmaps, and then discuss how its implemented.
The "Boxes_Plot" library is a powerful and versatile tool for visualizing multiple indicators on a trading chart using colored boxes, commonly known as heatmaps. These heatmaps provide a user-friendly and efficient method for analyzing the performance and trends of various indicators simultaneously. The library can be customized to display multiple charts, adjust the number of rows, and set the appropriate offset for proper spacing. This allows traders to gain insights into the market and make informed decisions.
Heatmaps with cells are interesting and useful for several reasons. Firstly, they allow for the visualization of large datasets in a compact and organized manner. This is especially beneficial when working with multiple indicators, as it enables traders to easily compare and contrast their performance. Secondly, heatmaps provide a clear and intuitive representation of the data, making it easier for traders to identify trends and patterns. Finally, heatmaps offer a visually appealing way to present complex information, which can help to engage and maintain the interest of traders.
History of Heatmaps
The concept of heatmaps can be traced back to the 19th century when French cartographer and sociologist Charles Joseph Minard used color gradients to visualize statistical data. He is well-known for his 1869 map, which depicted Napoleon's disastrous Russian campaign of 1812 using a color gradient to represent the dwindling size of Napoleon's army.
In the 20th century, heatmaps gained popularity in the fields of biology and genetics, where they were used to visualize gene expression data. In the early 2000s, heatmaps found their way into the world of finance, where they are now used to display stock market data, such as price, volume, and performance.
The boxes_plot function in the library expects a normalized value from 0 to 100 as input. Normalizing the data ensures that all values are on a consistent scale, making it easier to compare different indicators. The function also allows for easy customization, enabling users to adjust the number of rows displayed, the size of the boxes, and the offset for proper spacing.
One of the key features of the library is its ability to automatically scale the chart to the screen. This ensures that the heatmap remains clear and visible, regardless of the size or resolution of the user's monitor. This functionality is essential for traders who may be using various devices and screen sizes, as it enables them to easily access and interpret the heatmap without needing to make manual adjustments.
In order to create a heatmap using the boxes_plot function, users need to supply several parameters:
1. Source: An array of floating-point values representing the indicator values to display.
2. Name: An array of strings representing the names of the indicators.
3. Boxes_per_row: The number of boxes to display per row.
4. Offset (optional): An integer to offset the boxes horizontally (default: 0).
5. Scale (optional): A floating-point value to scale the size of the boxes (default: 1).
The library also includes a gradient function (grad) that is used to generate the colors for the heatmap. This function is responsible for determining the appropriate color based on the value of the indicator, with higher values typically represented by warmer colors such as red and lower values by cooler colors such as blue.
Implementing Heatmaps as a Pine Script Library
In this section, we'll explore how to create a Pine Script library that can be used to generate heatmaps for various indicators on the TradingView platform. The library utilizes colored boxes to represent the values of multiple indicators, making it simple to visualize complex data.
We'll now go over the key components of the code:
grad(src) function: This function takes an integer input 'src' and returns a color based on a predefined color gradient. The gradient ranges from dark blue (#1500FF) for low values to dark red (#FF0000) for high values.
boxes_plot() function: This is the main function of the library, and it takes the following parameters:
source: an array of floating-point values representing the indicator values to display
name: an array of strings representing the names of the indicators
boxes_per_row: the number of boxes to display per row
offset (optional): an integer to offset the boxes horizontally (default: 0)
scale (optional): a floating-point value to scale the size of the boxes (default: 1)
The function first calculates the screen size and unit size based on the visible chart area. Then, it creates an array of box objects representing each data point. Each box is assigned a color based on the value of the data point using the grad() function. The boxes are then plotted on the chart using the box.new() function.
Example Usage:
In the example provided in the source code, we use the Relative Strength Index (RSI) and the Stochastic Oscillator as the input data for the heatmap. We create two arrays, 'data_1' containing the RSI and Stochastic Oscillator values, and 'data_names_1' containing the names of the indicators. We then call the 'boxes_plot()' function with these arrays, specifying the desired number of boxes per row, offset, and scale.
Conclusion
Heatmaps are a versatile and powerful data visualization tool with a rich history, spanning multiple fields of study. By implementing a heatmap library in Pine Script, we can enhance the capabilities of the TradingView platform, making it easier for users to visualize and understand complex financial data. The provided library can be easily customized and extended to suit various use cases and can be a valuable addition to any trader's toolbox.
Library "Boxes_Plot"
boxes_plot(source, name, boxes_per_row, offset, scale)
Parameters:
source (float ) : - an array of floating-point values representing the indicator values to display
name (string ) : - an array of strings representing the names of the indicators
boxes_per_row (int) : - the number of boxes to display per row
offset (int) : - an optional integer to offset the boxes horizontally (default: 0)
scale (float) : - an optional floating-point value to scale the size of the boxes (default: 1)
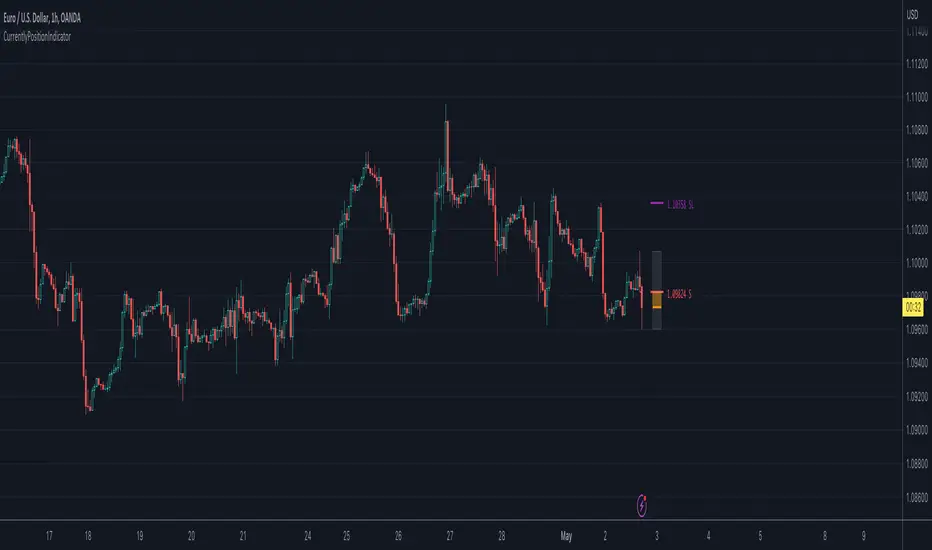
CurrentlyPositionIndicatorLibrary "CurrentlyPositionIndicator"
Currently position indicator
run(_index, _price, _stoploss, _high, _low, _side, _is_entered, _colors, _position_left, _box_width)
Currently positions indicator
Parameters:
_index (int) : entry index
_price (float) : entry price
_stoploss (float) : stoploss price
_high (float) : range high
_low (float) : range low
_side (int)
_is_entered (bool) : is entered
_colors (color ) : color array
_position_left (int) : Left position
_box_width (int) : box's width
Returns: TODO: add what function returns
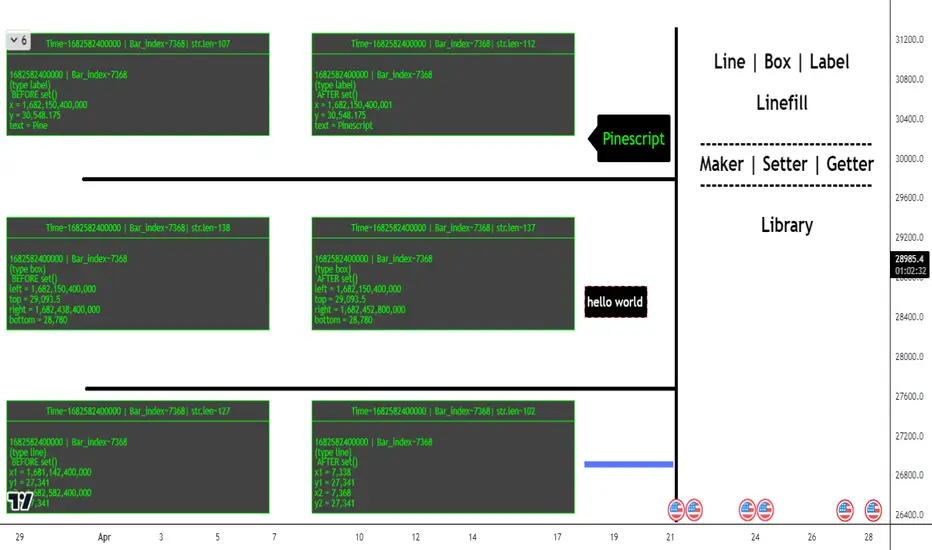
ObjectHelpersLibrary "ObjectHelpers"
Line | Box | Label | Linefill -- Maker, Setter, Getter Library
TODO: add table functionality
set(object)
set all params for `line`, `box`, `label`, `linefill` objects with 1 function
***
## Overloaded
***
```
method set(line Line, int x1=na, float y1=na, int x2=na, float y2=na,string xloc=na,string extend=na,color color=na,string style=na,int width=na,bool update=na) => line
```
### Params
- **Line** `line` - line object | `required`
- **x1** `int` - value to set x1
- **y1** `float` - value to set y1
- **x2** `int` - value to set x2
- **y2** `float` - value to set y2
- **xloc** `int` - value to set xloc
- **yloc** `int` - value to set yloc
- **extend** `string` - value to set extend
- **color** `color` - value to set color
- **style** `string` - value to set style
- **width** `int` - value to set width
- **update** `bool` - value to set update
***
```
method set(box Box,int left=na,float top=na,int right=na, float bottom=na,color bgcolor=na,color border_color=na,string border_style=na,int border_width=na,string extend=na,string txt=na,color text_color=na,string text_font_family=na,string text_halign=na,string text_valign=na,string text_wrap=na,bool update=false) => box
```
### Params
- **Box** `box` - box object
- **left** `int` - value to set left
- **top** `float` - value to set top
- **right** `int` - value to set right
- **bottom** `float` - value to set bottom
- **bgcolor** `color` - value to set bgcolor
- **border_color** `color` - value to set border_color
- **border_style** `string` - value to set border_style
- **border_width** `int` - value to set border_width
- **extend** `string` - value to set extend
- **txt** `string` - value to set _text
- **text_color** `color` - value to set text_color
- **text_font_family** `string` - value to set text_font_family
- **text_halign** `string` - value to set text_halign
- **text_valign** `string` - value to set text_valign
- **text_wrap** `string` - value to set text_wrap
- **update** `bool` - value to set update
***
```
method set(label Label,int x=na,float y=na, string txt=na,string xloc=na,color color=na,color textcolor=na,string size=na,string style=na,string textalign=na,string tooltip=na,string text_font_family=na,bool update=false) => label
```
### Paramas
- **Label** `label` - label object
- **x** `int` - value to set x
- **y** `float` - value to set y
- **txt** `string` - value to set text add`"+++"` to the _text striing to have the current label text concatenated to the location of the "+++")
- **textcolor** `color` - value to set textcolor
- **size** `string` - value to set size
- **style** `string` - value to set style (use "flip" ,as the style to have label flip to top or bottom of bar depending on if open > close and vice versa)
- **text_font_family** `string` - value to set text_font_family
- **textalign** `string` - value to set textalign
- **tooltip** `string` - value to set tooltip
- **update** `bool` - update label to next bar
***
```
method set(linefill Linefill=na,line line1=na,line line2=na,color color=na) => linefill
```
### Params
- **linefill** `linefill` - linefill object
- **line1** `line` - line object
- **line2** `line` - line object
- **color** `color` - color
Parameters:
object (obj)
Returns: `line`, `box`, `label`, `linefill`
method set(Line, x1, y1, x2, y2, xloc, extend, color, style, width, update)
set the location params of a line with 1 function auto detects time or bar_index for xloc param
Namespace types: series line
Parameters:
Line (line) : `line` - line object | `required`
x1 (int) : `int` - value to set x1
y1 (float) : `float` - value to set y1
x2 (int) : `int` - value to set x2
y2 (float) : `float` - value to set y2
xloc (string) : `int` - value to set xloc
extend (string) : `string` - value to set extend
color (color) : `color` - value to set color
style (string) : `string` - value to set style
width (int) : `int` - value to set width
update (bool) : `bool` - value to set update
Returns: `line`
method set(Box, left, top, right, bottom, bgcolor, border_color, border_style, border_width, extend, txt, text_color, text_font_family, text_halign, text_valign, text_wrap, update)
set the location params of a box with 1 function
Namespace types: series box
Parameters:
Box (box) : `box` - box object | `required`
left (int) : `int` - value to set left
top (float) : `float` - value to set top
right (int) : `int` - value to set right
bottom (float) : `float` - value to set bottom
bgcolor (color) : `color` - value to set bgcolor
border_color (color) : `color` - value to set border_color
border_style (string) : `string` - value to set border_style
border_width (int) : `int` - value to set border_width
extend (string) : `string` - value to set extend
txt (string) : `string` - value to set _text
text_color (color) : `color` - value to set text_color
text_font_family (string) : `string` - value to set text_font_family
text_halign (string) : `string` - value to set text_halign
text_valign (string) : `string` - value to set text_valign
text_wrap (string) : `string` - value to set text_wrap
update (bool) : `bool` - value to set update
Returns: `box`
method set(Label, x, y, txt, xloc, color, textcolor, size, style, textalign, tooltip, text_font_family, update)
set the location params of a label with 1 function auto detects time or bar_index for xloc param
Namespace types: series label
Parameters:
Label (label) : `label` | `required`
x (int) : `int` - value to set x
y (float) : `float` - value to set y
txt (string) : `string` - value to set text add`"+++"` to the _text striing to have the current label text concatenated to the location of the "+++")
xloc (string)
color (color)
textcolor (color) : `color` - value to set textcolor
size (string) : `string` - value to set size
style (string) : `string` - value to set style (use "flip" ,as the style to have label flip to top or bottom of bar depending on if open > close and vice versa)
textalign (string) : `string` - value to set textalign
tooltip (string) : `string` - value to set tooltip
text_font_family (string) : `string` - value to set text_font_family
update (bool) : `bool` - update label to next bar
Returns: `label`
method set(Linefill, line1, line2, color)
change the 1 or 2 of the lines in a linefill object
Namespace types: series linefill
Parameters:
Linefill (linefill)
line1 (line) : `line` - line object
line2 (line) : `line` - line object
color (color) : `color` - color
Returns: `linefill`
get(object)
get all of the location variables for `line`, `box`, `label` objects or the line objects from a `linefill`
***
## Overloaded
***
```
method get(line Line) =>
```
### Params
- **Line** `line` - line object | `required`
***
```
method get(box Box) =>
```
### Params
- **Box** `box` - box object | `required`
***
```
method get(label Label) =>
```
### Paramas
- **Label** `label` - label object | `required`
***
```
method get(linefill Linefill) =>
```
### Params
- **Linefill** `linefill` - linefill object | `required`
Parameters:
object (obj)
Returns: ` `
method get(Line)
Gets the location paramaters of a Line
Namespace types: series line
Parameters:
Line (line) : `line` - line object
Returns:
method get(Box)
Gets the location paramaters of a Box
Namespace types: series box
Parameters:
Box (box) : `box` - box object
Returns:
method get(Label)
Gets the `x`, `y`, `text` of a Label
Namespace types: series label
Parameters:
Label (label) : `label` - label object
Returns:
method get(Linefill)
Gets `line 1`, `line 2` from a Linefill
Namespace types: series linefill
Parameters:
Linefill (linefill) : `linefill` - linefill object
Returns:
method set_x(Line, x1, x2)
set the `x1`, `x2` of a line
***
### Params
- **Line** `line` - line object | `required`
- **x1** `int` - value to set x1 | `required`
- **x2** `int` - value to set x2 | `required`
Namespace types: series line
Parameters:
Line (line) : `line` - line object
x1 (int) : `int` - value to set x1
x2 (int) : `int` - value to set x2
Returns: `line`
method set_y(Line, y1, y2)
set `y1`, `y2` of a line
***
### Params
- **Line** `line` - line object | `required`
- **y1** `float` - value to set y1 | `required`
- **y2** `float` - value to set y2 | `required`
Namespace types: series line
Parameters:
Line (line) : `line` - line object
y1 (float) : `float` - value to set y1
y2 (float) : `float` - value to set y2
Returns: `line`
method Line(x1, y1, x2, y2, extend, color, style, width)
Similar to `line.new()` but can detect time or bar_index for xloc param and has defaults for all params but `x1`, `y1`, `x2`, `y2`
***
### Params
- **x1** `int` - value to set
- **y1** `float` - value to set
- **x2** `int` - value to set
- **y2** `float` - value to set
- **extend** `string` - extend value to set line
- **color** `color` - color to set line
- **style** `string` - style to set line
- **width** `int` - width to set line
Namespace types: series int, simple int, input int, const int
Parameters:
x1 (int) : `int` - value to set
y1 (float) : `float` - value to set
x2 (int) : `int` - value to set
y2 (float) : `float` - value to set
extend (string) : `string` - extend value to set line
color (color) : `color` - color to set line
style (string) : `string` - style to set line
width (int) : `int` - width to set line
Returns: `line`
method Box(left, top, right, bottom, extend, border_color, bgcolor, text_color, border_width, border_style, txt, text_halign, text_valign, text_size, text_wrap)
similar to box.new() with the but can detect xloc param and has defaults for everything but location params
***
### Params
- **left** `int` - value to set
- **top** `float` - value to set
- **right** `int` - value to set
- **bottom** `float` - value to set
- **extend** `string` - extend value to set box
- **border_color** `color` - color to set border
- **bgcolor** `color` - color to set background
- **text_color** `color` - color to set text
- **border_width** `int` - width to set border
- **border_style** `string` - style to set border
- **txt** `string` - text to set
- **text_halign** `string` - horizontal alignment to set text
- **text_valign** `string` - vertical alignment to set text
- **text_size** `string` - size to set text
- **text_wrap** `string` - wrap to set text
Namespace types: series int, simple int, input int, const int
Parameters:
left (int) : `int` - value to set
top (float) : `float` - value to set
right (int) : `int` - value to set
bottom (float) : `float` - value to set
extend (string) : `string` - extend value to set box
border_color (color) : `color` - color to set border
bgcolor (color) : `color` - color to set background
text_color (color) : `color` - color to set text
border_width (int) : `int` - width to set border
border_style (string) : `string` - style to set border
txt (string) : `string` - text to set
text_halign (string) : `string` - horizontal alignment to set text
text_valign (string) : `string` - vertical alignment to set text
text_size (string) : `string` - size to set text
text_wrap (string) : `string` - wrap to set text
Returns: `box`
method Label(txt, x, y, yloc, color, textcolor, style, size, textalign, text_font_family, tooltip)
Similar to label.new() but can detect time or bar_index for xloc param and has defaults for all params but x, y, txt, tooltip
***
### Params
- **txt** `string` - string to set
- **x** `int` - value to set
- **y** `float` - value to set
- **yloc** `string` - y location to set
- **color** `color` - label color to set
- **textcolor** `color` - text color to set
- **style** `string` - style to set
- **size** `string` - size to set
- **textalign** `string` - text alignment to set
- **text_font_family** `string` - font family to set
- **tooltip** `string` - tooltip to set
Namespace types: series string, simple string, input string, const string
Parameters:
txt (string) : `string` - string to set
x (int) : `int` - value to set
y (float) : `float` - value to set
yloc (string) : `string` - y location to set
color (color) : `color` - label color to set
textcolor (color) : `color` - text color to set
style (string) : `string` - style to set
size (string) : `string` - size to set
textalign (string) : `string` - text alignment to set
text_font_family (string) : `string` - font family to set
tooltip (string) : `string` - tooltip to set
Returns: `label`
obj
Fields:
obj (series__string)
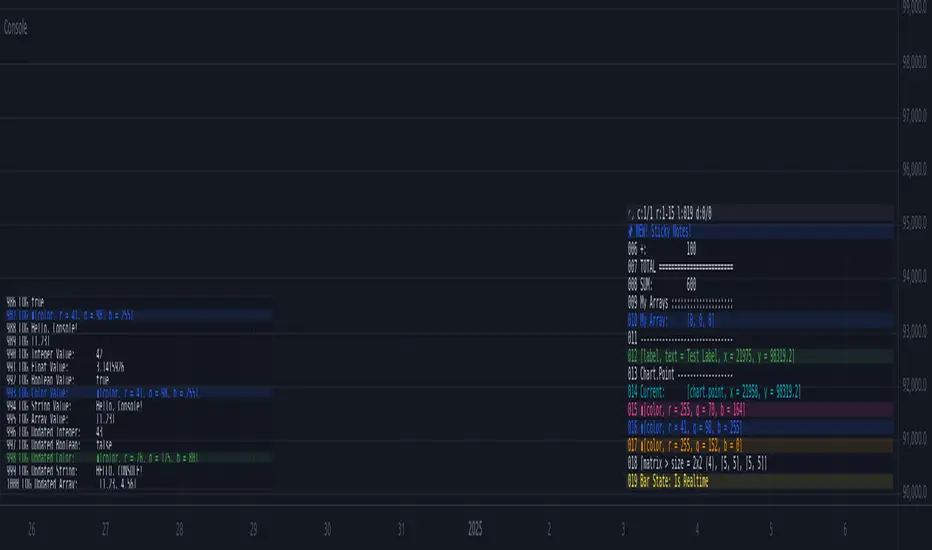
Console📕 Console Library
🔷 Introduction
This script is an adaptation of the classic JavaScript console script. It provides a simple way to display data in a console-like table format for debugging purposes.
While there are many nice console/logger scripts out there, my personal goal was to achieve inline functionality and visual object (label, lines) logging .
🔷 How to Use
◼ 1. Import the Console library into your script:
import cryptolinx/Console/1
- or -
Instead of the library namespace, you can define a custom namespace as alias.
import cryptolinx/Console/1 as c
◼ 2. Create and init a new `` object.
The `init()` method is used to initialize the console object with default settings. It can be used to customize it.
// When using the `var` keyword in a declaration, the logs will act as ever-forwarding.
// Without `var`, the `console` variable will be redeclared every time `bar` is called.
// var console = Console.terminal.new(log_position=position.bottom_left, prefix = '> ', show_no = true)
- or -
If you has set up an alias before.
var console = c.terminal.new().init()
◼ 3. Logging
// inline ✨
array testArray = array.new(3, .0).log(console)
// basic
console.log(testArray)
// inline ✨
var testLabel = label.new(bar_index, close, 'Label Text').log(console)
// basic
console.log(testLabel)
// It is also possible to use `().` for literals ✨.
int a = 100
testCalc = (5 * 100).log(console) + a.log(console) // SUM: 600
console.
.empty()
.log('SUM' + WS + testCalc.tostring())
◼ 4. Visibility
Finally, we need to call the `show()` method to display the logged messages in the console.
console.show(true) // True by default. Simply turn it on or off
new_line_dot_3Library "new_line"
TODO: plot line based on 3 points.
new_line(x_1, x_2, x_3, y_1, y_2, y_3)
TODO: plot line based on 3 points. (each different)
Parameters:
x_1 (int)
x_2 (int)
x_3 (int)
y_1 (float)
y_2 (float)
y_3 (float)
Returns: TODO: new line based on each different 3 values.

UtilsLibrary "Utils"
Utility functions. Mathematics, colors, and auxiliary algorithms.
setTheme(vc, theme)
Set theme for levels (predefined colors).
Parameters:
vc : (valueColorSpectrum) Object to associate a color with a value, taking into account the previous value and its levels.
theme : (int) Theme (predefined colors).
0 = 'User defined'
1 = 'Spectrum Blue-Green-Red'
2 = 'Monokai'
3 = 'Green'
4 = 'Purple'
5 = 'Blue'
6 = 'Red'
Returns: (void)
setTheme(vc, colorLevel_Lv1, colorLevel_Lv1_Lv2, colorLevel_Lv2_Lv3, colorLevel_Lv3_Lv4, colorLevel_Lv4_Lv5, colorLevel_Lv5)
Set theme for levels (customized colors).
Parameters:
vc : (valueColorSpectrum) Object to associate a color with a value, taking into account the previous value and its levels
colorLevel_Lv1 : (color) Color associeted with value when below Level 1.
colorLevel_Lv1_Lv2 : (color) Color associeted with value when between Level 1 and 2.
colorLevel_Lv2_Lv3 : (color) Color associeted with value when between Level 2 and 3.
colorLevel_Lv3_Lv4 : (color) Color associeted with value when between Level 3 and 4.
colorLevel_Lv4_Lv5 : (color) Color associeted with value when between Level 4 and 5.
colorLevel_Lv5 : (color) Color associeted with value when above Level 5.
Returns: (void)
setCurrentColorValue(vc)
Set color to a current value, taking into account the previous value and its levels
Parameters:
vc : (valueColorSpectrum) Object to associate a color with a value, taking into account the previous value and its levels
Returns: (void)
setCurrentColorValue(vc, gradient)
Set color to a current value, taking into account the previous value.
Parameters:
vc : (valueColor) Object to associate a color with a value, taking into account the previous value
gradient
Returns: (void)
setCustomLevels(vc, level1, level2, level3, level4, level5)
Set boundaries for custom levels.
Parameters:
vc : (valueColorSpectrum) Object to associate a color with a value, taking into account the previous value and its levels
level1 : (float) Boundary for level 1
level2 : (float) Boundary for level 2
level3 : (float) Boundary for level 3
level4 : (float) Boundary for level 4
level5 : (float) Boundary for level 5
Returns: (void)
getPeriodicColor(originalColor, density)
Returns a periodic color. Useful for creating dotted lines for example.
Parameters:
originalColor : (color) Original color.
density : (float) Density of color. Expression used in modulo to obtain the integer remainder.
If the remainder equals zero, the color appears, otherwise it remains hidden.
Returns: (color) Periodic color.
dinamicZone(source, sampleLength, pcntAbove, pcntBelow)
Get Dynamic Zones
Parameters:
source : (float) Source
sampleLength : (int) Sample Length
pcntAbove : (float) Calculates the top of the dynamic zone, considering that the maximum values are above x% of the sample
pcntBelow : (float) Calculates the bottom of the dynamic zone, considering that the minimum values are below x% of the sample
Returns: A tuple with 3 series of values: (1) Upper Line of Dynamic Zone;
(2) Lower Line of Dynamic Zone; (3) Center of Dynamic Zone (x = 50%)
valueColorSpectrum
# Object to associate a color with a value, taking into account the previous value and its levels.
Fields:
currentValue
previousValue
level1
level2
level3
level4
level5
currentColorValue
colorLevel_Lv1
colorLevel_Lv1_Lv2
colorLevel_Lv2_Lv3
colorLevel_Lv3_Lv4
colorLevel_Lv4_Lv5
colorLevel_Lv5
theme
valueColor
# Object to associate a color with a value, taking into account the previous value
Fields:
currentValue
previousValue
currentColorValue
colorUp
colorDown

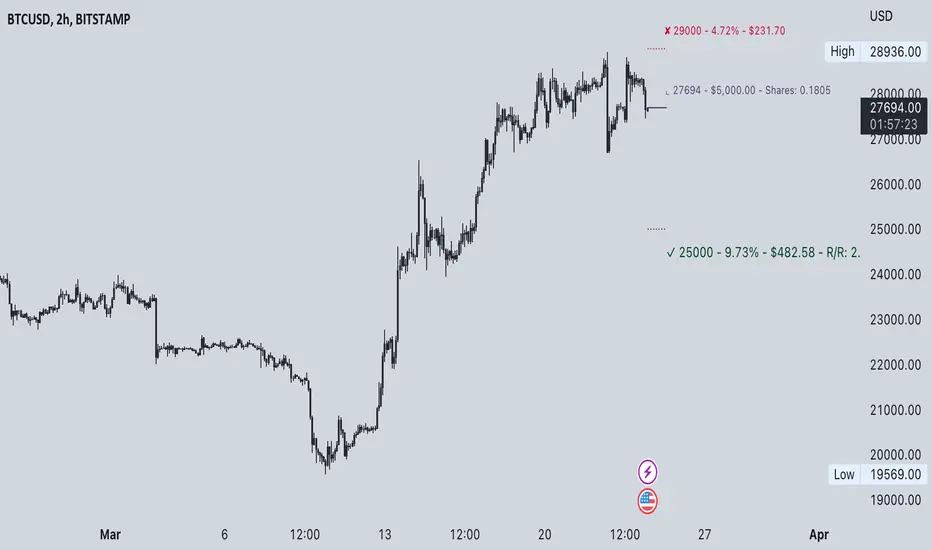
Commission-aware Trade LabelsCommission-aware Trade Labels
Description:
This library provides an easy way to visualize take-profit and stop-loss levels on your chart, taking into account trading commissions. The library calculates and displays the net profit or loss, along with other useful information such as risk/reward ratio, shares, and position size.
Features:
Configurable take-profit and stop-loss prices or percentages.
Set entry amount or shares.
Calculates and displays the risk/reward ratio.
Shows net profit or loss, considering trading commissions.
Customizable label appearance.
Usage:
Add the script to your chart.
Create an Order object for take-profit and stop-loss with desired configurations.
Call target_label() and stop_label() methods for each order object.
Example:
target_order = Order.new(take_profit_price=27483, stop_loss_price=28000, shares=0.2)
stop_order = Order.new(stop_loss_price=29000, shares=1)
target_order.target_label()
stop_order.stop_label()
This script is a powerful tool for visualizing your trading strategy's performance and helps you make better-informed decisions by considering trading commissions in your profit and loss calculations.
Library "tradelabels"
entry_price(this)
Parameters:
this : Order object
@return entry_price
take_profit_price(this)
Parameters:
this : Order object
@return take_profit_price
stop_loss_price(this)
Parameters:
this : Order object
@return stop_loss_price
is_long(this)
Parameters:
this : Order object
@return entry_price
is_short(this)
Parameters:
this : Order object
@return entry_price
percent_to_target(this, target)
Parameters:
this : Order object
target : Target price
@return percent
risk_reward(this)
Parameters:
this : Order object
@return risk_reward_ratio
shares(this)
Parameters:
this : Order object
@return shares
position_size(this)
Parameters:
this : Order object
@return position_size
commission_cost(this, target_price)
Parameters:
this : Order object
@return commission_cost
target_price
net_result(this, target_price)
Parameters:
this : Order object
target_price : The target price to calculate net result for (either take_profit_price or stop_loss_price)
@return net_result
create_take_profit_label(this, prefix, size, offset_x, bg_color, text_color)
Parameters:
this
prefix
size
offset_x
bg_color
text_color
create_stop_loss_label(this, prefix, size, offset_x, bg_color, text_color)
Parameters:
this
prefix
size
offset_x
bg_color
text_color
create_entry_label(this, prefix, size, offset_x, bg_color, text_color)
Parameters:
this
prefix
size
offset_x
bg_color
text_color
create_line(this, target_price, line_color, offset_x, line_style, line_width, draw_entry_line)
Parameters:
this
target_price
line_color
offset_x
line_style
line_width
draw_entry_line
Order
Order
Fields:
entry_price : Entry price
stop_loss_price : Stop loss price
stop_loss_percent : Stop loss percent, default 2%
take_profit_price : Take profit price
take_profit_percent : Take profit percent, default 6%
entry_amount : Entry amount, default 5000$
shares : Shares
commission : Commission, default 0.04%
L_Trade_BoundariesLibrary "L_Trade_Boundaries"
Trade Boundaries suggest a strength of the security with respect to previous lows. The "L" implies library, and the trade boundaries implies it could be utilized for price strengths. Though, this should not be used as a single parameter to trade wildly. This library can be imported to a custom indicator to utilized the custom functions. There are moving averages attached at the bottom right of the canvas (overlay) to benchmark the closing price with respect to Moving Averages: 20, 28, and 200 (i.e., "D" if timeframe == "D") respectively. The Volume Indicator located at the top of the canvas is a default function (function already made by the trading view) this shows the volume with respect to the selected time frame. All of the indicators tell a story with regard to the security price (in strength terms).
What is available in this Library?
Litmus Color
> This is a function will change color of two numbers, if the first number is less than the second, the color will be red; otherwise, the color will be green.
Lister
> This is simply using an array by revisiting previous lows and plotting to the current time frame (i.e., "D"). There is a custom frequency input for the function, it will go back as much as the implied/specified length. Note: I am still learning how to use array, use this function with discretion. I would also appreciate if there are suggestions commented below.
Moving Average
> This function invokes three moving average metrics: 20, 28, and 200 respectively. The values are displayed at the bottom right of the canvas.
Timeframe Highlight
> This function checks for the input timeframe (i.e., "D", "W", "M") and if the time frame happens to be the same, it will give a "true" result. This result can be utilized for highlighting the positive results on the canvas (the red lines).
litmus_color(value1, value2)
Parameters:
value1
value2
lister(length)
Parameters:
length
moving_averages()
timeframe_highlight(timeframe)
Parameters:
timeframe

ThemeLibraryLibrary "ThemeLibrary"
TODO: add library description here
theme(_theme)
: a library of themed colors
Parameters:
_theme : : the theme color to fetch
Returns: : an array of colors

Drawings_publicLibrary "Drawings_public"
: Functions to manage drawings on the chart
extend_line(lineId, labelId)
: Extend specific line with its label
Parameters:
lineId
labelId
update_line_coordinates(lineId, labelId, x1, y1, x2, y2)
: Update specific line coordinates with its label
Parameters:
lineId
labelId
x1
y1
x2
y2
update_label_coordinates(labelId, value)
: Update coordinates of a label
Parameters:
labelId
value
delete_line(lineId, labelId)
: Delete specific line with its label
Parameters:
lineId
labelId
update_box_coordinates(boxId, labelId, left, top, right, bottom)
: Update specific box coordinates with its label
Parameters:
boxId
labelId
left
top
right
bottom
delete_box(boxId, labelId)
: Delete specific box with its label
Parameters:
boxId
labelId

TableBuilderLibrary "TableBuilder"
A helper library to make it simpler to create tables in pinescript
This is a simple table building library that I created because I personally feel that the built-in table building method is too verbose. It features chaining methods and variable arguments.
There are many features that are lacking because the implementation is early, and there may be antipatterns because I am not familiar with the runtime behavior like pinescript. If you have any comments on code improvements or features you want, please comment :D

WarCalendarLibrary "WarCalendar"
This library is a data provider for important Dates and Times from the Economic Calendar.
events()
Returns the list of dates supported by this library as a string array.
Returns: array : Names of events supported by this library
warstart()

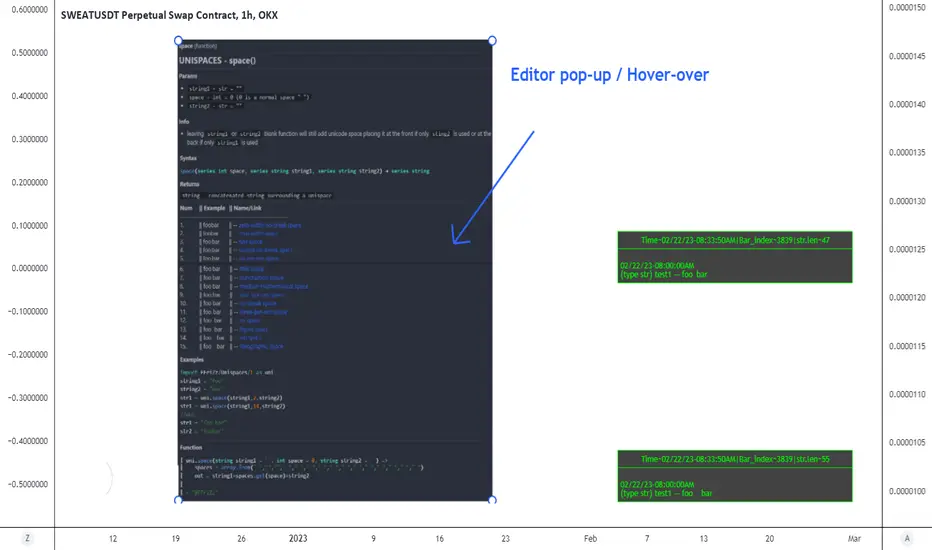
UnispacesLibrary "Unispaces"
Easier than looking up unicode spaces
spaces(sequence, string1, string2)
UNISPACES
Parameters:
sequence : (int) required | 123 = 3 spaces / 3 different sizes (one space per number can find spaces in hover over)
string1 : (str) optional | default = ""
string2 : (str) optional | default = ""
Returns: `string - concatenated string surrounding unispaces`
space(space, string1, string2)
UNISPACE
Parameters:
space : (int) optional | default = 0 | 0-15 (can find spaces in hover over)
string1 : (str) optional | default = ""
string2 : (str) optional | default = ""
Returns: `string - concatenated string surrounding a unispace `
Vector2ArrayLibrary "Vector2Array"
functions to handle vector2 Array operations.
.
references:
docs.unity3d.com
gist.github.com
github.com
gist.github.com
gist.github.com
gist.github.com
.
from(source, prop_sep, vect_sep)
Generate array of vector2 from string.
Parameters:
source : string Source string of the vectors.
prop_sep : string Separator character of the vector properties (x`,`y).
vect_sep : string Separator character of the vectors ((x,y)`;`(x,y)).
Returns: array.
max(vectors)
Combination of the highest elements in column of a array of vectors.
Parameters:
vectors : array, Array of Vector2 objects.
Returns: Vector2.Vector2, Vector2 object.
-> usage:
`a = Vector2.from(1.0) , b = Vector2.from(2.0), c = Vector2.from(3.0), d = max(array.from(a, b, c)) , plot(d.x)`
min(vectors)
Combination of the lowest elements in column of a array of vectors.
Parameters:
vectors : array, Array of Vector2 objects.
Returns: Vector2.Vector2, Vector2 object.
-> usage:
`a = Vector2.from(1.0) , b = Vector2.from(2.0), c = Vector2.from(3.0), d = min(array.from(a, b, c)) , plot(d.x)`
sum(vectors)
Total sum of all vectors.
Parameters:
vectors : array, ID of the vector2 array.
Returns: Vector2.Vector2, vector2 object.
-> usage:
`a = Vector2.from(1.0) , b = Vector2.from(2.0), c = Vector2.from(3.0), d = sum(array.from(a, b, c)) , plot(d.x)`
center(vectors)
Finds the vector center of the array.
Parameters:
vectors : array, ID of the vector2 array.
Returns: Vector2.Vector2, vector2 object.
-> usage:
`a = Vector2.from(1.0) , b = Vector2.from(2.0), c = Vector2.from(3.0), d = center(array.from(a, b, c)) , plot(d.x)`
rotate(vectors, center, degree)
Rotate Array vectors around origin vector by a angle.
Parameters:
vectors : array, ID of the vector2 array.
center : Vector2.Vector2 , Vector2 object. Center of the rotation.
degree : float , Angle value.
Returns: rotated points array.
-> usage:
`a = Vector2.from(1.0) , b = Vector2.from(2.0), c = Vector2.from(3.0), d = rotate(array.from(a, b, c), b, 45.0)`
scale(vectors, center, rate)
Scale Array vectors based on a origin vector perspective.
Parameters:
vectors : array, ID of the vector2 array.
center : Vector2.Vector2 , Vector2 object. Origin center of the transformation.
rate : float , Rate to apply transformation.
Returns: rotated points array.
-> usage:
`a = Vector2.from(1.0) , b = Vector2.from(2.0), c = Vector2.from(3.0), d = scale(array.from(a, b, c), b, 1.25)`
move(vectors, center, rate)
Move Array vectors by a rate of the distance to center position (LERP).
Parameters:
vectors : array, ID of the vector2 array.
center
rate
Returns: Moved points array.
-> usage:
`a = Vector2.from(1.0) , b = Vector2.from(2.0), c = Vector2.from(3.0), d = move(array.from(a, b, c), b, 1.25)`
to_string(id, separator)
Reads a array of vectors into a string, of the form ` `.
Parameters:
id : array, ID of the vector2 array.
separator : string separator for cell splitting.
Returns: string Translated complex array into string.
-> usage:
`a = Vector2.from(1.0) , b = Vector2.from(2.0), c = Vector2.from(3.0), d = to_string(array.from(a, b, c))`
to_string(id, format, separator)
Reads a array of vectors into a string, of the form ` `.
Parameters:
id : array, ID of the vector2 array.
format : string , Format to apply transformation.
separator : string , Separator for cell splitting.
Returns: string Translated complex array into string.
-> usage:
`a = Vector2.from(1.234) , b = Vector2.from(2.23), c = Vector2.from(3.1234), d = to_string(array.from(a, b, c), "#.##")`

Segment2Library "Segment2"
Structure representation of a directed straight line in two dimensions from origin to target vectors.
.
reference:
graphics.stanford.edu
.
new(origin, target)
Generate a new segment.
Parameters:
origin : Vector2 . Origin of the segment.
target : Vector2 . Target of the segment.
Returns: Segment2.
new(origin_x, origin_y, target_x, target_y)
Generate a new segment.
Parameters:
origin_x : float . Origin of the segment x coordinate.
origin_y : float . Origin of the segment y coordinate.
target_x : float . Target of the segment x coordinate.
target_y : float . Target of the segment y coordinate.
Returns: Segment2.
copy(this)
Copy a segment.
Parameters:
this : Vector2 . Segment to copy.
Returns: Segment2.
length_squared(this)
Squared length of the normalized segment vector. For comparing vectors this is computationaly lighter.
Parameters:
this : Segment2 . Sorce segment.
Returns: float.
length(this)
Length of the normalized segment vector.
Parameters:
this : Segment2 . Sorce segment.
Returns: float.
opposite(this)
Reverse the direction of the segment.
Parameters:
this : Segment2 . Source segment.
Returns: Segment2.
is_degenerate(this)
Segment is degenerate when origin and target are equal.
Parameters:
this : Segment2 . Source segment.
Returns: bool.
is_horizontal(this)
Segment is horizontal?.
Parameters:
this : Segment2 . Source segment.
Returns: bool.
is_horizontal(this, precision)
Segment is horizontal?.
Parameters:
this : Segment2 . Source segment.
precision : float . Limit of precision.
Returns: bool.
is_vertical(this)
Segment is vertical?.
Parameters:
this : Segment2 . Source segment.
Returns: bool.
is_vertical(this, precision)
Segment is vertical?.
Parameters:
this : Segment2 . Source segment.
precision : float . Limit of precision.
Returns: bool.
equals(this, other)
Tests two segments for equality (share same origin and target).
Parameters:
this : Segment2 . Source segment.
other : Segment2 . Target segment.
Returns: bool.
nearest_to_point(this, point)
Find the nearest point in a segment to another point.
Parameters:
this : Segment2 . Source segment.
point : Vector2 . Point to aproximate.
Returns: Vector2.
intersection(this, other)
Find the intersection vector of 2 lines.
Parameters:
this : Segment2 . Segment A.
other : Segment2 . Segment B.
Returns: Vector2.Vector2 Object.
extend(this, at_origin, at_target)
Extend a segment by the percent ratio provided.
Parameters:
this : Segment2 . Source segment.
at_origin : float . Percent ratio to extend at origin vector.
at_target : float . Percent ratio to extend at target vector.
Returns: Segment2.
to_string(this)
Translate segment to string format `( (x,y), (x,y) )`.
Parameters:
this : Segment2 . Source segment.
Returns: string.
to_string(this, format)
Translate segment to string format `((x,y), (x,y))`.
Parameters:
this : Segment2 . Source segment.
format : string . Format string to apply.
Returns: string.
to_array(this)
Translate segment to array format.
Parameters:
this : Segment2 . Source segment.
Returns: array.

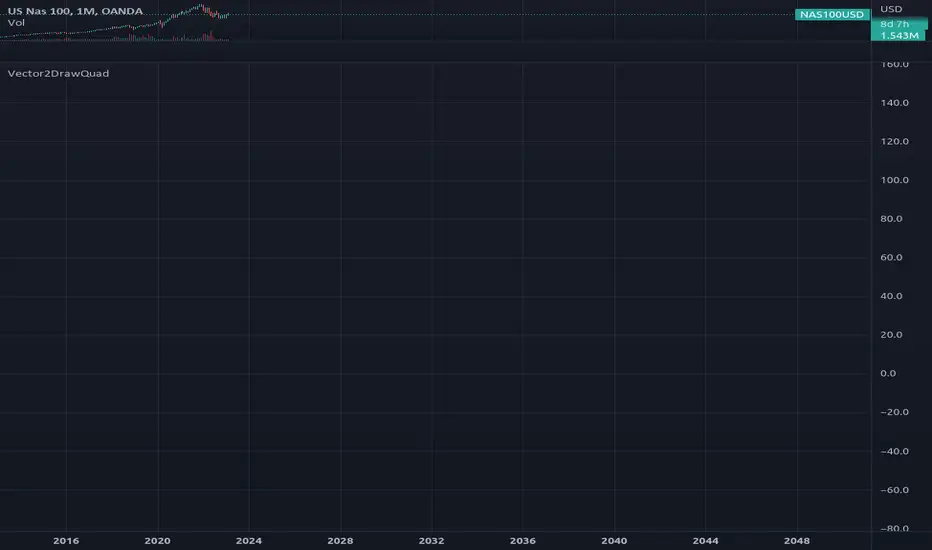
Vector2DrawQuadLibrary "Vector2DrawQuad"
functions to handle vector2 Quad drawing operations.
new(a, b, c, d, xloc, bg_color, line_color, line_style, line_width)
Draws a quadrilateral with background fill.
Parameters:
a : v2 . Vector2 object, in the form `(x, y)`.
b : v2 . Vector2 object, in the form `(x, y)`.
c : v2 . Vector2 object, in the form `(x, y)`.
d : v2 . Vector2 object, in the form `(x, y)`.
xloc : string . Type of axis unit, bar_index or time.
bg_color : color . Color of the background.
line_color : color . Color of the line.
line_style : string . Style of the line.
line_width : int . Width of the line.
Returns: Quad object.
copy(this)
Copy a existing quad object.
Parameters:
this : Quad . Source quad.
Returns: Quad.
set_position_a(this, x, y)
Set the position of corner `a` (modifies source quad).
Parameters:
this : Quad . Source quad.
x : int . Value at the x axis.
y : float . Value at the y axis.
Returns: Source Quad.
set_position_a(this, position)
Set the position of corner `a` (modifies source quad).
Parameters:
this : Quad . Source quad.
position : Vector2 . New position.
Returns: Source Quad.
set_position_b(this, x, y)
Set the position of corner `b` (modifies source quad).
Parameters:
this : Quad . Source quad.
x : int . Value at the x axis.
y : float . Value at the y axis.
Returns: Source Quad.
set_position_b(this, position)
Set the position of corner `b` (modifies source quad).
Parameters:
this : Quad . Source quad.
position : Vector2 . New position.
Returns: Source Quad.
set_position_c(this, x, y)
Set the position of corner `c` (modifies source quad).
Parameters:
this : Quad . Source quad.
x : int . Value at the x axis.
y : float . Value at the y axis.
Returns: Source Quad.
set_position_c(this, position)
Set the position of corner `c` (modifies source quad).
Parameters:
this : Quad . Source quad.
position : Vector2 . New position.
Returns: Source Quad.
set_position_d(this, x, y)
Set the position of corner `d` (modifies source quad).
Parameters:
this : Quad . Source quad.
x : int . Value at the x axis.
y : float . Value at the y axis.
Returns: Source Quad.
set_position_d(this, position)
Set the position of corner `d` (modifies source quad).
Parameters:
this : Quad . Source quad.
position : Vector2 . New position.
Returns: Source Quad.
set_style(this, bg_color, line_color, line_style, line_width)
Update quad style options (modifies Source quad).
Parameters:
this : Quad . Source quad.
bg_color : color . Color of the background.
line_color : color . Color of the line.
line_style : string . Style of the line.
line_width : int . Width of the line.
Returns: Source Quad.
set_bg_color(this, bg_color)
Update quad style options (modifies Source quad).
Parameters:
this : Quad . Source quad.
bg_color : color . Color of the background.
Returns: Source Quad.
set_line_color(this, line_color)
Update quad style options (modifies Source quad).
Parameters:
this : Quad . Source quad.
line_color : color . Color of the line.
Returns: Source Quad.
set_line_style(this, line_style)
Update quad style options (modifies Source quad).
Parameters:
this : Quad . Source quad.
line_style : string . Style of the line.
Returns: Source Quad.
set_line_width(this, line_width)
Update quad style options (modifies Source quad).
Parameters:
this : Quad . Source quad.
line_width : int . Width of the line.
Returns: Source Quad.
move(this, x, y)
Move quad by provided amount (modifies source quad).
Parameters:
this : Quad . Source quad.
x : float . Amount to move the vertices of the quad in the x axis.
y : float . Amount to move the vertices of the quad in the y axis.
Returns: Source Quad.
move(this, amount)
Move quad by provided amount (modifies source quad).
Parameters:
this : Quad . Source quad.
amount : Vector2 . Amount to move the vertices of the quad in the x and y axis.
Returns: Source Quad.
rotate_around(this, center, angle)
Rotate source quad around a center (modifies source quad).
Parameters:
this : Quad . Source quad.
center : Vector2 . Center coordinates of the rotation.
angle : float . Value of angle in degrees.
Returns: Source Quad.
rotate_around(this, center_x, center_y, angle)
Rotate source quad around a center (modifies source quad).
Parameters:
this : Quad . Source quad.
center_x : int . Center coordinates of the rotation.
center_y : float . Center coordinates of the rotation.
angle : float . Value of angle in degrees.
Returns: Source Quad.
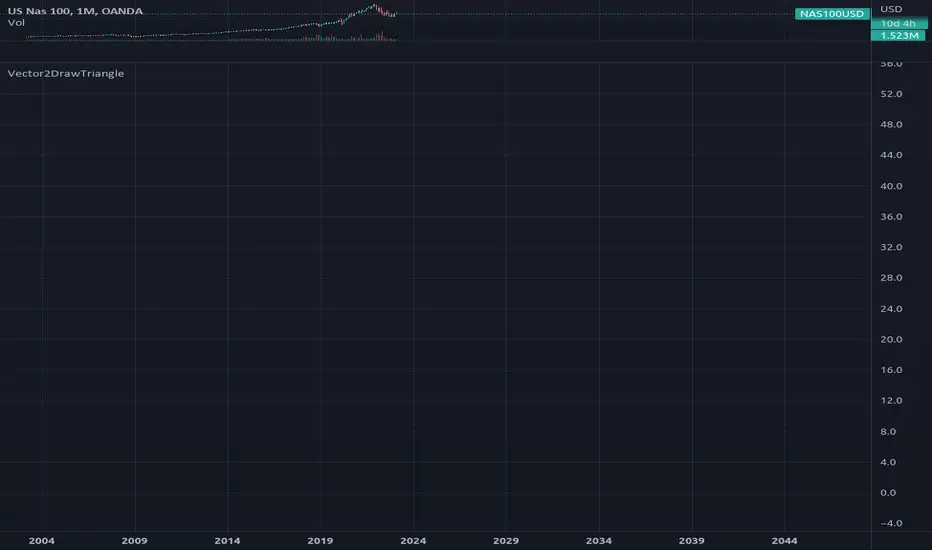
Vector2DrawTriangleLibrary "Vector2DrawTriangle"
Functions to draw a triangle and manipulate its properties.
new(a, b, c, xloc, bg_color, line_color, line_style, line_width)
Draws a triangle with background fill using line prototype.
Parameters:
a : v2 . Vector2 object, in the form `(x, y)`.
b : v2 . Vector2 object, in the form `(x, y)`.
c : v2 . Vector2 object, in the form `(x, y)`.
xloc : string . Type of axis unit, bar_index or time.
bg_color : color . Color of the background.
line_color : color . Color of the line.
line_style : string . Style of the line.
line_width : int . Width of the line.
Returns: Triangle object.
copy(this)
Copy a existing triangle object.
Parameters:
this : Triangle . Source triangle.
Returns: Triangle.
set_position_a(this, x, y)
Set the position of corner `a` (modifies source triangle).
Parameters:
this : Triangle . Source triangle.
x : int . Value at the x axis.
y : float . Value at the y axis.
Returns: Source Triangle.
set_position_a(this, position)
Set the position of corner `a` (modifies source triangle).
Parameters:
this : Triangle . Source triangle.
position : Vector2 . New position.
Returns: Source Triangle.
set_position_b(this, x, y)
Set the position of corner `b` (modifies source triangle).
Parameters:
this : Triangle . Source triangle.
x : int . Value at the x axis.
y : float . Value at the y axis.
Returns: Source Triangle.
set_position_b(this, position)
Set the position of corner `b` (modifies source triangle).
Parameters:
this : Triangle . Source triangle.
position : Vector2 . New position.
Returns: Source Triangle.
set_position_c(this, x, y)
Set the position of corner `c` (modifies source triangle).
Parameters:
this : Triangle . Source triangle.
x : int . Value at the x axis.
y : float . Value at the y axis.
Returns: Source Triangle.
set_position_c(this, position)
Set the position of corner `c` (modifies source triangle).
Parameters:
this : Triangle . Source triangle.
position : Vector2 . New position.
Returns: Source Triangle.
set_style(this, bg_color, line_color, line_style, line_width)
Update triangle style options (modifies Source triangle).
Parameters:
this : Triangle . Source triangle.
bg_color : color . Color of the background.
line_color : color . Color of the line.
line_style : string . Style of the line.
line_width : int . Width of the line.
Returns: Source Triangle.
set_bg_color(this, bg_color)
Update triangle style options (modifies Source triangle).
Parameters:
this : Triangle . Source triangle.
bg_color : color . Color of the background.
Returns: Source Triangle.
set_line_color(this, line_color)
Update triangle style options (modifies Source triangle).
Parameters:
this : Triangle . Source triangle.
line_color : color . Color of the line.
Returns: Source Triangle.
set_line_style(this, line_style)
Update triangle style options (modifies Source triangle).
Parameters:
this : Triangle . Source triangle.
line_style : string . Style of the line.
Returns: Source Triangle.
set_line_width(this, line_width)
Update triangle style options (modifies Source triangle).
Parameters:
this : Triangle . Source triangle.
line_width : int . Width of the line.
Returns: Source Triangle.
move(this, x, y)
Move triangle by provided amount (modifies source triangle).
Parameters:
this : Triangle . Source triangle.
x : float . Amount to move the vertices of the triangle in the x axis.
y : float . Amount to move the vertices of the triangle in the y axis.
Returns: Source Triangle.
move(this, amount)
Move triangle by provided amount (modifies source triangle).
Parameters:
this : Triangle . Source triangle.
amount : Vector2 . Amount to move the vertices of the triangle in the x and y axis.
Returns: Source Triangle.
rotate_around(this, center, angle)
Rotate source triangle around a center (modifies source triangle).
Parameters:
this : Triangle . Source triangle.
center : Vector2 . Center coordinates of the rotation.
angle : float . Value of angle in degrees.
Returns: Source Triangle.
rotate_around(this, center_x, center_y, angle)
Rotate source triangle around a center (modifies source triangle).
Parameters:
this : Triangle . Source triangle.
center_x : int . Center coordinates of the rotation.
center_y : float . Center coordinates of the rotation.
angle : float . Value of angle in degrees.
Returns: Source Triangle.
CommonTypesDrawingLibrary "CommonTypesDrawing"
Provides a common library source for common types of used graphical drawing structures.
Includes: `Triangle, Quad, Polygon`
Triangle
Representation of a triangle using lines and linefill.
Fields:
ab : Edge of point a to b.
bc : Edge of point b to c.
ca : Edge of point c to a.
fill : Fill of the object.
solid : Check if polygon should have a fill.
Quad
Representation of a quadrilateral using lines and linefill.
Fields:
ab : Edge of point a to b.
bc : Edge of point b to c.
cd : Edge of point c to d.
da : Edge of point d to a.
fill : Fill of the object.
solid : Check if polygon should have a fill.
Polygon
Representation of a polygon using lines and linefill.
Fields:
edges : List of edges in the polygon.
fills : Fills of the object.
closed : Check if polygon line should connect last vertice to first.
solid : Check if polygon should have a fill.

Vector2DrawLineLibrary "Vector2DrawLine"
Extends line type with methods for Vector2 and Segment2.
new(origin, target, xloc, extend, color, style, width)
Draws a line using Segment type to hold its coordinate properties..
Parameters:
origin : Vector2 . Origin vector of the line.
target : Vector2 . Target vector of the line.
xloc : string
extend : string
color : color
style : string
width : int
Returns: line object
new(segment, xloc, extend, color, style, width)
Draws a line using Segment type to hold its coordinate properties..
Parameters:
segment : Segment2 . Segment with positional coordinates.
xloc : string
extend : string
color : color
style : string
width : int
Returns: line object
rotate_around(this, center, angle)
Instance method to rotate line around center vector (modifies input line).
Parameters:
this : line . Line object.
center : Vector2 . Center of rotation.
angle : float . Rotation angle in degrees.
Returns: line. Rotated line object.
Sub-Super Script and Roman numerals LibraryLibrary "Sub_Super_Script_and_RomanNumerals_Library"
Library to transform numbers into Roman numerals / Super-Sub script / check if value is alpha or number
isnumber(input)
check to see if value is a number
Parameters:
input : (string/float/int) value to check
Returns: (na) if value is NOT a number and input (string/float/int) if value is a number
isalpha(input)
check a string if it is alpha(doesnt contain numbers)
Parameters:
input
Returns: (string) if string input does NOT contain numbers, return (na) if input string contains numbers
super(num)
convert a string's numbers from normal print to super-script
Parameters:
num : (string/int/float) input value to transform
Returns: string of input with numbers converted to super-script
sub(num)
convert a string's numbers from normal print to sub-script
Parameters:
num : (string/int/float) input value to transform
Returns: string of input with numbers converted to sub-script
roman(num, trunc)
convert a string of numbers, float, or int
Parameters:
num : (string) input number to transform
trunc : (bool | false) true to truncate float value, false to show roman numerals with decimals (XX.VI)
Returns: string of roman numerals representing the input (num)
PositionLibrary "Position"
Allows for simulating trades within an indicator.
newTrade(size, price, timestamp)
Creates a new trade object.
Parameters:
size : The size of the trade (number of shares or contracts).
price : The price at which the trade took place.
timestamp : The timestamp of the trade. Defaults to the current time.
Returns: A new trade object.
start(size, price, timestamp)
Starts a new position.
Parameters:
size : The size of the position (number of shares or contracts).
price : The price at which the position was started.
timestamp : The timestamp of the start of the position. Defaults to the current time.
Returns: A new position object.
trade(pos, size, price, timestamp)
Modifies an existing position.
Parameters:
pos : The position to be modified.
size : The size of the trade (number of shares or contracts).
price : The price at which the trade took place.
timestamp : The timestamp of the trade. Defaults to the current time.
Returns: The modified position object.
exit(pos, price, timestamp)
Closes a position by trading the entire position size at a given price and timestamp.
Parameters:
pos : The position being closed.
price : The price at which the position is being closed.
timestamp : The timestamp of the trade, defaults to the current time.
Returns: The updated position after the trade.
unrealized(pos, price)
Calculates the unrealized gain or loss for a given position and price.
Parameters:
pos : The position for which to calculate unrealized gain/loss.
price : The current market price.
Returns: The calculated unrealized gain or loss.
Trade
Represents a single trade.
Fields:
size : Size of the trade in units.
price : Price of the trade in currency.
value : Total value of the trade in currency units.
time : Timestamp of the trade.
Position
Represents a single position.
Fields:
size : Size of the position in units.
price : Average price of the position in currency.
value : Total value of the position in currency units.
start : Timestamp of the first trade that opened the position.
net : Realized gains and losses of the position in currency units.
history : Array of trades that make up the position.
