Расхождение

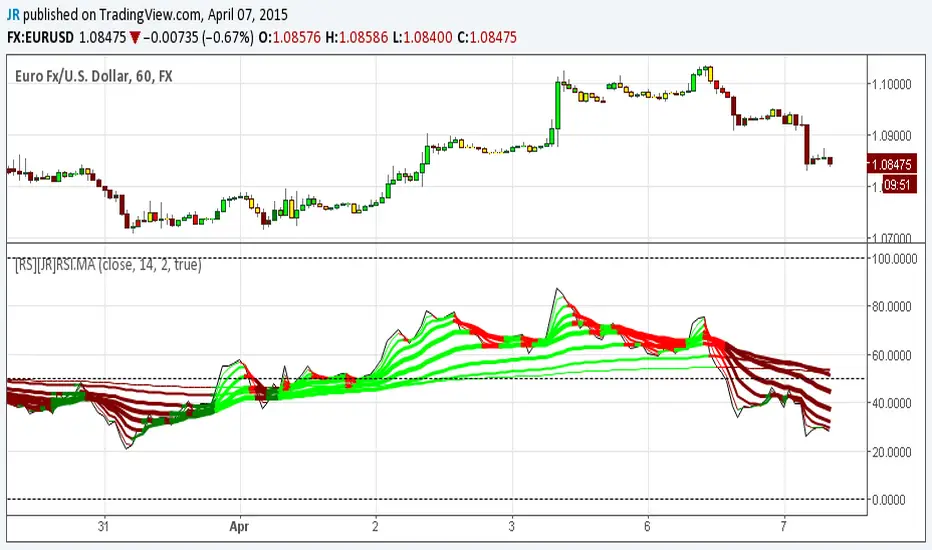
[RS][JR]RSI Ribbon + CandleRSI Ribbon + Candle
By Ricardo Santos and JR
In this chart rendering we are combining RSI and Moving Averages. For an added features we included colors to the candles and ribbons. Lime and green displays a strong bullish trend, yellow is caution or no trade, red and maroon are bearish trends. You can also find divergences using the ribbon.
Divergence
Ultimate Oscillator Divergence Detector v0.1I wanted a more dynamic divergence indicator than the stock one so this is what's come of it so far. This is a very early version but I found its detecting normal bullish divergences pretty well so I thought I'd release it.
Right now it only supports normal bullish divergences. I'm working on improving accuracy before I add in normal bearish divergences, and then will be handling hidden divergences.
The spacing parameter will probably need to be tweaked based on the time frame of interest. For small time frames a value of 3 seems to work, for longer ones I go up to 7. Anything below 3 will be extremely sensitive and anything above 10 will hardly notice anything. The spacing for the example here is 3 for the main graph and 7 for the ultimate oscillator graph.

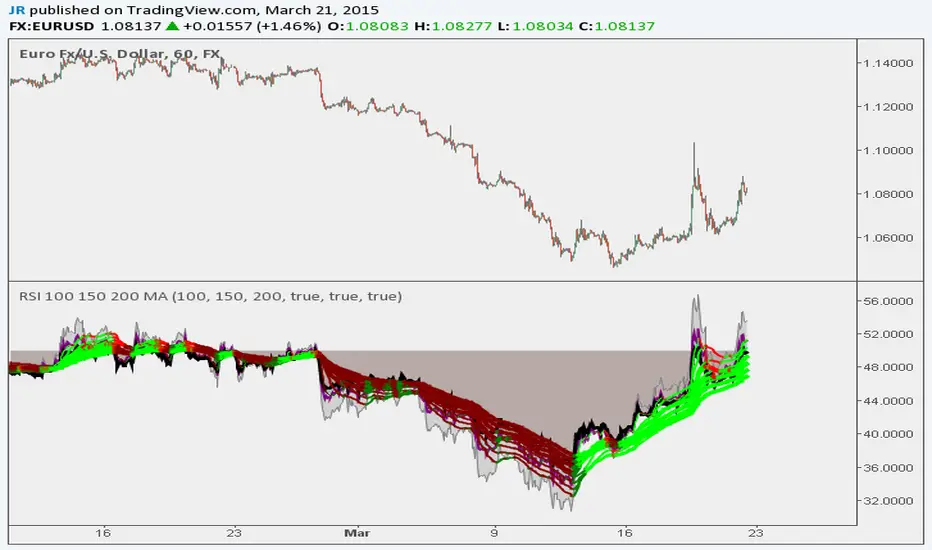
RSI 100 150 200 MA Ribbon
Following Trends and Finding Divergences
Here is a script example that uses a long length (100, 150, 200) RSI MA Ribbon to detect trend reversals using lower time frames. You can also use traditional RSI to find divergences.
Built Best for 1H to 10 Min Charting
BTCUSD
LX Rsi Divergence BarsThis script colours the bars when they are below or boyond a specified RSI threshold

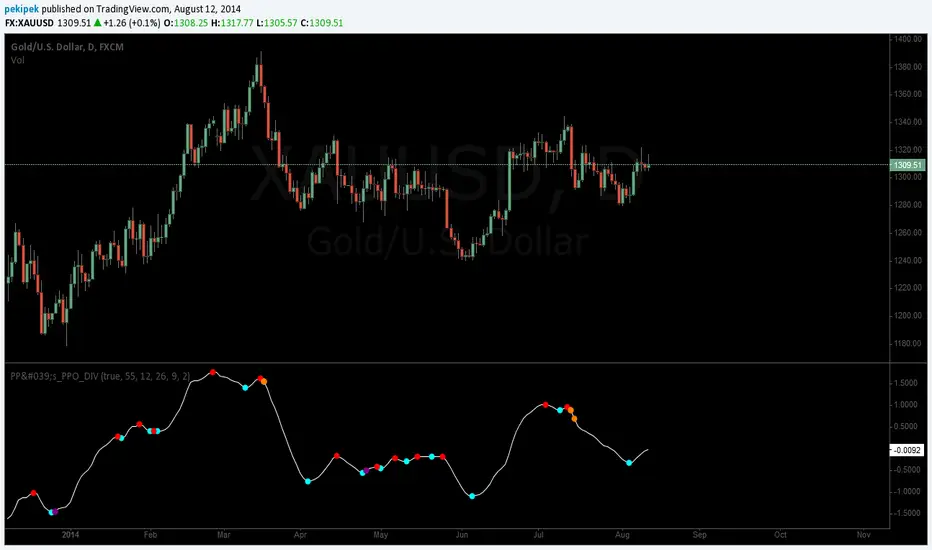
Pekipek's PPO Divergence BETABeta divergence indicator, you can exchange the Price Percentage Oscillator (PPO) for any oscillator. You can play around with the look-back period if you want to use long term divergences.
WARNING:
Because its impossible to make the look-back period of the lowest/highest functions dynamic, the indicator can plot divergences sometimes at places where there are none, however in my experience this does not occur so much. Also it is impossible to plot isolated lines, so its hard to visually see which divergence(s) exactly is(are) being signaled. Once these features become possible I can really refine the indicator.