Range Analysis - By LeviathanThe Interactive Range Analysis script is an essential tool for analyzing price ranges. It automatically draws important range levels, generates a Volume Profile or Open Interest profile and horizontal/vertical heatmaps, plots the anchored VWAP, draws Fibonacci levels, and much more.
How to use the indicator:
1. The script will prompt you to select the "Start Time" and "End Time" using Tradingview's interactive interface. These two points will determine the length of the range.
2. Once you have selected the range, the script will automatically anchor the range highs and lows to the highest and lowest close/wick/hlc3/ohlc4 (whichever you prefer).
3. You can then begin exploring different tools and options such as Quarters, Eighths, Fibonacci, Outer Levels, VWAP, Horizontal Volume/OI Heatmap, Vertical Volume/OI Heatmap, Fixed Range Volume Profile, Open Interest Profile, Value Area, VAH, VAL, and POC.
4. You can adjust the range by dragging the Start Time and End Time anchors or by removing/reapplying the script.
Tool overview
Range Levels
After selecting your preferred time range, the script will identify and draw a range high level and a range low level, which serve as a base for other important levels. “Half” is the level halfway between the range high and range low. “Quarters” will, as the name suggests, split the range into four equal zones (quarters) and “Eighths” will split the range into eight equal zones (eighths).
”Fibonacci” option allows you to display Fibonacci retracement levels (0.786, 0.618, 0.382, 0.236). “VWAP” will plot a Volume Weighted Average Price, anchored to the start of the range. “Direction” input lets you choose whether your range is UP or DOWN trending in order to make sure that the Fibonacci levels and labels are generated and assigned correctly. With “Outer” turned ON, the script will also generate active levels (quarters/eighths/Fibonacci) above and below the selected price range. “Extend Right” will extend all levels to the right indefinitely, while “Extend (+Bars)” lets you choose how far right the levels get extended. “Diagonal Line” is drawn from the bottom left of the range to the top right of the range or from the top left of the range to the bottom right of the range, depending on the “Direction” input.
Volume Profile / Open Interest Profile
After selecting the “Data Type”, Volume Profile or OI Profile can be generated by turning ON the “Volume/OI Profile” option.
“Resolution” input defines the amount of nodes/rows in the range that are used in profile/heatmap generation for distributing the data. While you can increase the “Resolution” to get better, more granular profiles, you should keep in mind that you might need to lower the resolution when generating profiles for larger ranges.
”Node Type” offers you two options when it comes to the representation of data: Up/Down - divides a node in two sections for up volume/OI and down volume/OI, Total - one node for total volume/OI and Delta - net difference in up volume/OI and down volume/OI.
”Profile Position” lets you choose whether the profile is positioned on the left side of the range or on the right side of the range.
“Profile Direction” determines whether the profile nodes are facing right or left.
“Profile Type” enables you to visualize the nodes in a classic way (Type 1) or in a way where down volume/negative OI are positioned on the left side of the y axis and up volume/positive OI on the right side of the y axis.
“Node Size (%)” defines how much space in the range can be taken by the profile’s nodes. Eg. 50% will allow the largest node to extend to the middle of the range (and others scaled accordingly), 100% will allow the largest node to extend the max right point of the range (and others scaled accordingly).
”Value Area (%)” defines the VA zone, which represents the area where the most volume occured (usually 70% or 68%).
”Horizontal Heatmap” will display a heatmap-like overlay, that will help you identify the price levels where most volume/open interest action occurred.
”Vertical Heatmap” will display a heatmap-like overlay, that will help you identify the points in time where most volume/open interest action occurred.
A more detailed description of this indicator is coming in the next few days.
Important:
* If volume or OI profile does not get generated, try lowering the resolution.
* Once in a while, the script will disappear from your chart. Just remove and reapply.
* Open Interest data is only avaiable on Binance Perpetual Futures pairs
To learn more, read the tooltips in the indicator’s settings and stay tuned for upcoming additions (Range Market Structure, Liquidation Levels, Range Statistics,…)
Heatmap

DataChartLibrary "DataChart"
Library to plot scatterplot or heatmaps for your own set of data samples
draw(this)
draw contents of the chart object
Parameters:
this : Chart object
Returns: current chart object
init(this)
Initialize Chart object.
Parameters:
this : Chart object to be initialized
Returns: current chart object
addSample(this, sample, trigger)
Add sample data to chart using Sample object
Parameters:
this : Chart object
sample : Sample object containing sample x and y values to be plotted
trigger : Samples are added to chart only if trigger is set to true. Default value is true
Returns: current chart object
addSample(this, x, y, trigger)
Add sample data to chart using x and y values
Parameters:
this : Chart object
x : x value of sample data
y : y value of sample data
trigger : Samples are added to chart only if trigger is set to true. Default value is true
Returns: current chart object
addPriceSample(this, priceSampleData, config)
Add price sample data - special type of sample designed to measure price displacements of events
Parameters:
this : Chart object
priceSampleData : PriceSampleData object containing event driven displacement data of x and y
config : PriceSampleConfig object containing configurations for deriving x and y from priceSampleData
Returns: current chart object
Sample
Sample data for chart
Fields:
xValue : x value of the sample data
yValue : y value of the sample data
ChartProperties
Properties of plotting chart
Fields:
title : Title of the chart
suffix : Suffix for values. It can be used to reference 10X or 4% etc. Used only if format is not format.percent
matrixSize : size of the matrix used for plotting
chartType : Can be either scatterplot or heatmap. Default is scatterplot
outliersStart : Indicates the percentile of data to filter out from the starting point to get rid of outliers
outliersEnd : Indicates the percentile of data to filter out from the ending point to get rid of outliers.
backgroundColor
plotColor : color of plots on the chart. Default is color.yellow. Only used for scatterplot type
heatmapColor : color of heatmaps on the chart. Default is color.red. Only used for heatmap type
borderColor : border color of the chart table. Default is color.yellow.
plotSize : size of scatter plots. Default is size.large
format : data representation format in tooltips. Use mintick.percent if measuring any data in terms of percent. Else, use format.mintick
showCounters : display counters which shows totals on each quadrants. These are single cell tables at the corners displaying number of occurences on each quadrant.
showTitle : display title at the top center. Uses the title string set in the properties
counterBackground : background color of counter table cells. Default is color.teal
counterTextColor : text color of counter table cells. Default is color.white
counterTextSize : size of counter table cells. Default is size.large
titleBackground : background color of chart title. Default is color.maroon
titleTextColor : text color of the chart title. Default is color.white
titleTextSize : text size of the title cell. Default is size.large
addOutliersToBorder : If set, instead of removing the outliers, it will be added to the border cells.
useCommonScale : Use common scale for both x and y. If not selected, different scales are calculated based on range of x and y values from samples. Default is set to false.
plotchar : scatter plot character. Default is set to ascii bullet.
ChartDrawing
Chart drawing objects collection
Fields:
properties : ChartProperties object which determines the type and characteristics of chart being plotted
titleTable : table containing title of the chart.
mainTable : table containing plots or heatmaps.
quadrantTables : Array of tables containing counters of all 4 quandrants
Chart
Chart type which contains all the information of chart being plotted
Fields:
properties : ChartProperties object which determines the type and characteristics of chart being plotted
samples : Array of Sample objects collected over period of time for plotting on chart.
displacements : Array containing displacement values. Both x and y values
displacementX : Array containing only X displacement values.
displacementY : Array containing only Y displacement values.
drawing : ChartDrawing object which contains all the drawing elements
PriceSampleConfig
Configs used for adding specific type of samples called PriceSamples
Fields:
duration : impact duration for which price displacement samples are calculated.
useAtrReference : Default is true. If set to true, price is measured in terms of Atr. Else is measured in terms of percentage of price.
atrLength : atrLength to be used for measuring the price based on ATR. Used only if useAtrReference is set to true.
PriceSampleData
Special type of sample called price sample. Can be used instead of basic Sample type
Fields:
trigger : consider sample only if trigger is set to true. Default is true.
source : Price source. Default is close
highSource : High price source. Default is high
lowSource : Low price source. Default is low
tr : True range value. Default is ta.tr

Hurst Spectral Analysis SwamiChartHaving a hard time deciding which wavelength to use for a Hurst analysis? Try a handful at once! SwamiCharts by John Ehlers offers a comprehensive way to visualize an indicator used over a range of lookback periods. The Spectral Analysis SwamiChart shows the bullish or bearish state of a spectrum of bandpasses over a user-defined range of wavelengths. The trader simply selects a bandwidth, a base wavelength, and a step/multiple to see the Spectral Analysis SwamiChart. A vertical column of green or red tends to indicate a very bullish or bearish moment in time, meaning that all bandpasses in the analyzed spectrum are in a bullish or bearish orientation simultaneously.
🏆 Shoutout to DavidF at Sigma-L for all the helpful information, conversations together, & indicator feedback.
🏅Shoutout to @HPotter for the bandpass code, and shoutout to @TerryPascoe for sharing it with me

RSI Impact Heat Map [Trendoscope]Here is a simple tool to measure and display outcome of certain RSI event over heat map.
🎲 Process
🎯Event
Event can be either Crossover or Crossunder of RSI on certain value.
🎯Measuring Impact
Impact of the event after N number of bars is measured in terms of highest and lowest displacement from the last close price. Impact can be collected as either number of times of ATR or percentage of price. Impact for each trigger is recorded separately and stored in array of custom type.
🎯Plotting Heat Map
Heat map is displayed using pine tables. Users can select heat map size - which can vary from 10 to 90. Selecting optimal size is important in order to get right interpretation of data. Having higher number of cells can give more granular data. But, chart may not fit into the window. Having lower size means, stats are combined together to get less granular data which may not give right picture of the results. Default value for size is 50 - meaning data is displayed in 51X51 cells.
Range of the heat map is adjusted automatically based on min and max value of the displacement. In order to filter out or merge extreme values, range is calculated based on certain percentile of the values. This will avoid displaying lots of empty cells which can obscure the actual impact.
🎲 Settings
Settings allow users to define their event, impact duration and reference, and few display related properties. The description of these parameters are as below:
🎲 Use Cases
In this script, we have taken RSI as an example to measure impact. But, we can do this for any event. This can be price crossing over/under upper/lower bollinger bands, moving average crossovers or even complex entry or exit conditions. Overall, we can use this to plot and evaluate our trade criteria.
🎲 Interpretation
Q1 - If more coloured dots appear on the top right corner of the table, then the event is considered to trigger high volatility and high risk environment.
Q2 - If more coloured dots appear on the top left corner, then the events are considered to trigger bearish environment.
Q3 - If more coloured dots appear on the bottom left corner of the chart, then the events are considered insignificant as they neither generate higher displacement in positive or negative side. You can further alter outlier percentage to reduce the bracket and hence have higher distribution move towards
Q4 - If more coloured dots appear on the bottom right corner, then the events are considered to trigger bullish environment.
Will also look forward to implement this as library so that any conditions or events can be plugged into it.

Wave Master ProThis indicator is built on Stochastics and uses multiple timeframes to give you a heatmap style view of where overbought and oversold levels are across 25 different timeframes.
Here's a few things you'll want to watch out for when using this indicator:
OVERBOUGHT
When a wave goes into overbought or is approaching overbought, you'll notice the heatmap transitioning from orange to red. Probably wise to move up stop losses or close the position out, especially when the entire vertical time slot is completely red.
OVERSOLD
Opposite of overbought, when a wave goes into oversold, the heatmap will transition from orange to green. This could be a good place to close out short positions or be on the lookout for long positions. Again, especially when the entire vertical time slot is completely green.
TIMEFRAMES
This indicator is dynamic in that it will automatically adjust the heatmap timefrmaes as you change the timeframe of your chart.
LIMITATIONS
Due to there being so many different timeframes that are utilized in this indicator, you will find that this indicator works best on 1H timeframes or lower, but it will work up to 4H timeframes. Currently, anything above 4H is not optimal for this indicator. I would recommend using the regular Wave Master indicator if you like using high timeframes.
OTHER USEFUL INFORMATION
This is a vidual aid in determining when many timeframes approach and reach extended levels based on the configuration of the Stochastics that we have found to be most optimal, especially in lower timeframes. It is wise to refer back to the Wave Master indicator for a raw view of the waves.
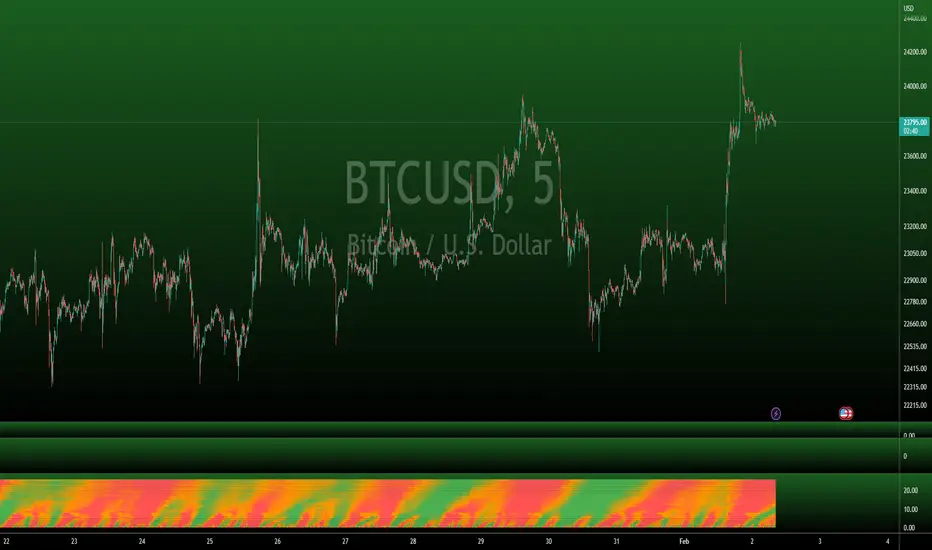
Price Heat MapWhat does this chart show? Take the highest high and lowest low of 200 bars. Divide that into 20 chunks. The more time the price spends in one of those 1/20th pockets, the brighter it is lit up on the chart. Number of bars back can be modified to around 500. It starts to chug beyond that. Brightness level of heat map can be adjusted. 0.5 is default. 1 = brighter, 0 = dimmer. Use on any time frame. When price moves out of a hot zone, it can move very quickly. There's no trading strategy here, just something to help you visualize recent price action. The blue band shows the price at the center of the current "hottest" band. The yellow band is the ema (exponential moving average) of the price using the "bars back" input. --enjoy!

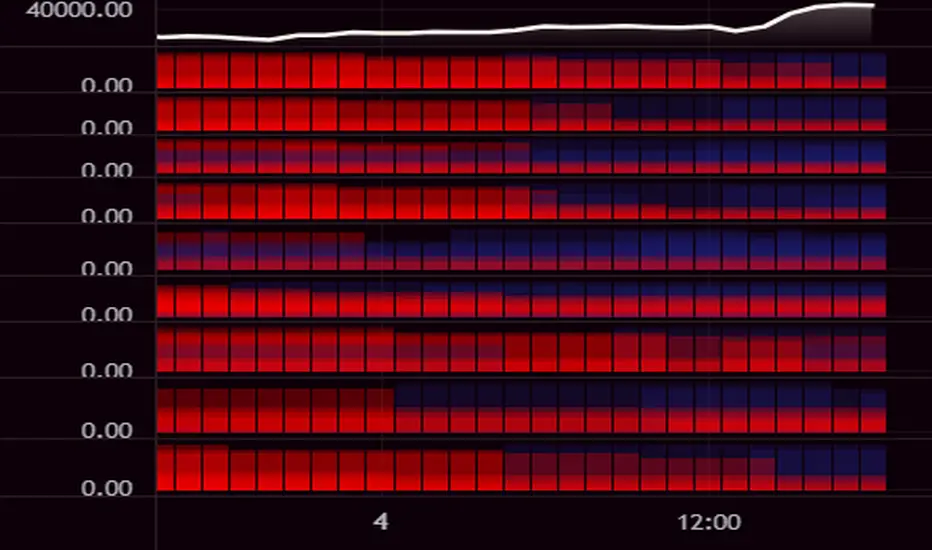
Volume CVD and Open Interest HeatmapTaking Volume and Open Interest data to the next level of visualization I created a 'heatmap'. The indicator uses a colour gradient and plots boxes from the source candle to the current candle with one of the following data sources:
- Volume - the total volume of transactions, buys and sells
- Up Volume - the total volume from buys only
- Down Volume - the total volume from sells only
- Up/Down Volume (Net) - the difference in the Buy Volume and Sell Volume
- Cumulative Delta - the sum of the up/down volume for the previous 14 bars
- Cumulative Delta EMA - a smoothed average of the sum of the up/down volume for the previous 14 bars, over a 14 period EMA
- Open Interest - a user defined ticker, whose value is added to the plot, while this is designed to be used with Open Interest tickers, you can actually choose any ticker you want, perhaps you want to see DXY while charting Bitcoin!
You can define the lookback period, though you should make sure your timeframe for volume source data, is high enough to accommodate the lookback. TradingView will only fetch 5000 candles worth of data, so at 1 min volume data, you can only lookback 83 hours.
While similar, Volume and Open Interest are not the same. To me the simplest explanation is Volume shows the trades that have been executed and the buy/sell direction, while Open Interest shows the value of open trades that are yet to be completed.
Volume shows strength, sentiment and volatility .
Open Interest does not show direction, but does indicate momentum and liquidity in the market.
With this novel way of visualizing these, you can also now determine where all that liquidity and positions came from and therefore might have resting liquidity below.

swami_rsi
Description:
As in the practices, most traders find it hard to set the proper lookback period of the indicator to be used. SwamiCharts offers a comprehensive way to visualize the indicator used over a range of lookback periods. The SwamiCharts of Relative Strength Index (RSI), was developed by Ehlers - see Cycle Analytics for Traders, chapter 16. The indicator was computed over multiple times of the range of lookback period for the Relative Strength Index (RSI), from the deficient period to the relatively high lookback period i.e. 1 to 48, then plotted as one heatmap.
Features:
In this indicator, the improvement is to utilize the color(dot)rgb() function, which finds to giving a relatively lower time to compute, and follows the original color scheme.
The confirmation level, which assumed of 25

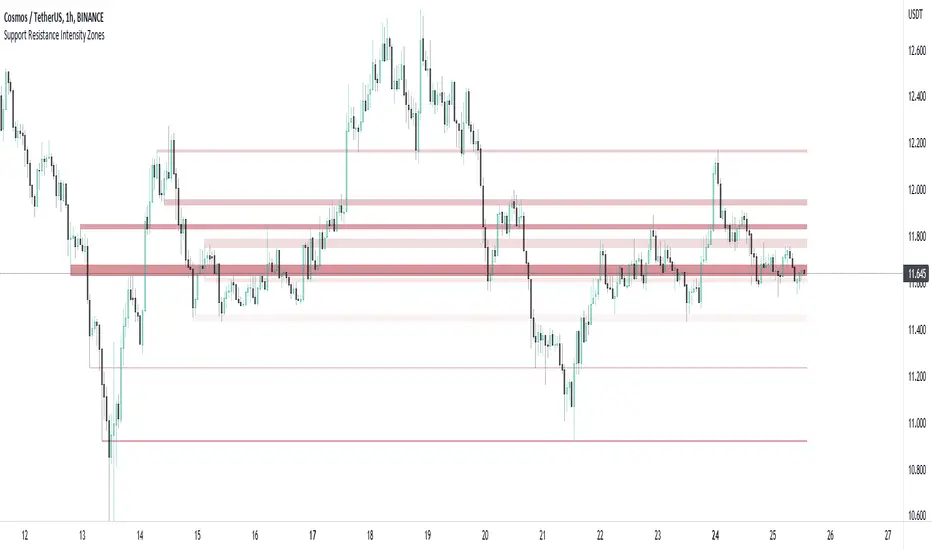
Support and Resistance Intensity ZonesSupport and resistance are often drawn using lines. This is too simple and doesn't give a clear idea of the market sentiment at these particular levels. What is strong support and resistance? What is weak support and resistance. How can either be defined by a single price point?
Using a simple, clean and configurable solution, this indicator not only shows these support and resistance levels as zones, it also gives them a colour gradient based on their intensity.
It does this by letting you choose the pivot highs and lows within a chosen range back. Then you choose one of two options to display how these multiple pivots at the same levels look. You can either group these pivots together into 'zones', where grouped pivots are all separated by a chosen price percentage, choosing how many zones to display, the most grouped pivots being the most intense colour.
Alternatively you display the pivots by 'gradient', where the closer the pivots are together in price the more intense the colour. As pivots diverge apart, the colour weakens.
Both of these options have to be seen to realise how much more there is to support and resistance than a single line.
Blockchain Fundamentals: 200 Week MA Heatmap [CR]Blockchain Fundamentals: 200 Week MA Heatmap
This is released as a thank you to all my followers who pushed me over the 600 follower mark on twitter. Thanks to all you Kingz and Queenz out there who made it happen. <3
Indicator Overview
In each of its major market cycles, Bitcoin's price historically bottoms out around the 200 week moving average.
This indicator uses a color heatmap based on the % increases of that 200 week moving average. Depending on the rolling cumulative 4 week percent delta of the 200 week moving average, a color is assigned to the price chart. This method clearly highlights the market cycles of bitcoin and can be extremely helpful to use in your forecasts.
How It Can Be Used
The long term Bitcoin investor can monitor the monthly color changes. Historically, when we see orange and red dots assigned to the price chart, this has been a good time to sell Bitcoin as the market overheats. Periods where the price dots are purple and close to the 200 week MA have historically been good times to buy.
Bitcoin Price Prediction Using This Tool
If you are looking to predict the price of Bitcoin or forecast where it may go in the future, the 200WMA heatmap can be a useful tool as it shows on a historical basis whether the current price is overextending (red dots) and may need to cool down. It can also show when Bitcoin price may be good value on a historical basis. This can be when the dots on the chart are purple or blue.
Over more than ten years, $BTC has spent very little time below the 200 week moving average which is also worth noting when thinking about price predictions for Bitcoin or a Bitcoin price forecast.
Notes
1.) If you do not want to view the legend do the following: Indicator options > Style tab > Uncheck "Tables"
2.) I use my custom function to get around the limited historical data for bitcoin. You can check out the explanation of it here:

swami_money_flow
Description:
Chaikin Money Flow was an indicator that measuring of the volume-weighted average of accumulation and distribution over a specified period (as cited from Fidelity) developed by Marc Chaikin, aim to identify the changes in buying or selling momentum of an asset that leads to the increase or decrease of asset prices. In the original format, the cross above 0 of money flow depicts a buying pressure, while a cross under 0 means a selling pressure. In this indicator, the money flow was displayed in a swami chart, used for detecting a change not only in one specified period but instead in multiple periods at once. Sequencing from the very below, the indicator capture the shift in money flow in shorter lookback periods, going through the very above the indicator capture the change of money flow in greater lookback periods. The color is set to gradient from red as indicating the negative money flow, while green indicates a positive money flow. A smoothing function was given (from Ehlers smoothing function) to reduce noises.
Money Flow:
cmf = n-day sum of( (((close - low) - (high - close)) / (high - low)) x volume )/ n-day sum of volume
smoothed = (4*cmf + 3*cmf + 2*cmf + cmf )/10
Notes:
the Darker the color indicates the higher the value e.g. dark red means more selling pressure, and vice versa
if the color is a lineup in a one period, indicates a strong signal (both directions)
very below is for a shorter period, and increasing through to the longest (1 - 30 by default)
Other Example

normalize_heatmap
Description:
This was a simple indicator to indicate the heatmap area of an asset price, in a relative given time period. In default the lookback period was set to 50 bars, indicating the current state of the price within the previous lookback period. The color scheme was using the rainbow palette, which set blue as the cooling-off area, and red as the heating area. The indicator doesn't take into account momentum strategy and thus doesn't consider the future direction of the asset price. Note: cooling-off area, can be considered to entry or adding position as a DCA strategy.
Data Normalize:
norm = (x - min) / (max - min)
Feature:
Heatmap color condition
Weighted Moving average (Additional)

HEX Risk Metric (v0.2)This indicator plots a "risk metric" based on the % increases of the following averages:
ema21, sma50, sma100, sma200, sma300, sma600.
Depending on the rolling 7-day percentage increase of this moving average, a value is assigned to each data point, then normalized to a common range.
This set of metrics attempts to represent data similar to that of a heat map.
Users can adjust filter top, filter bottom, and toggle on/off the different metrics within the set.
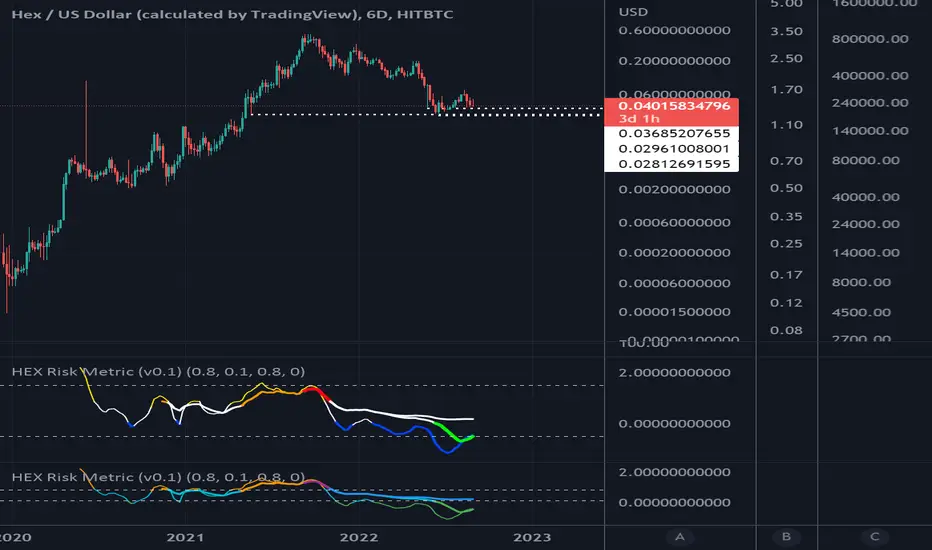
HEX Risk Metric (v0.1)This indicator plots a "risk metric" based on the % increases of the following averages:
ema21, sma50, sma100, sma200, sma300, sma600.
Depending on the rolling 7-day percentage increase of this moving average, a value is assigned to each data point, then normalized to a common range.
This set of metrics attempts to represent data similar to that of a heat map.
Users can adjust filter top, filter bottom, and toggle on/off the different metrics within the set.

Morningstar Equity Style Box HeatmapStyle boxes are a classification scheme created by Morningstar. They visually provide a graphical representation of investing categories for equity investments. A style box is a valuable tool for investors to use when determining asset allocation.
There are 9 categories:
Large Value, Large Blend, Large Growth
Medium Value, Medium Blend, Medium Growth
Small Value, Small Blend, Small Growth
The strength of the 9 categories are found by using 9 Vanguard ETF's that follow the respective CRSP index of their category.

Stochastic RSI HeatmapStochastic RSI presented as a heatmap starting from the oversold (20) / overbought (80) levels respectively. The more oversold / overbought the price, the more intense the color (blue / fuchsia).

xBrat BIAS DEPTH HeatmapThis Trading Indicator is the "Go - No Go Gauge" for any trading signals strategy. A Sub-Chart that looks up 6 time frames and gives you real time BIAS. Bullish, Neutral or Bearish on each level. Making decisions, acting on trading signals easier! Only identifying those highest probability trades, no matter what signals trading indicator you are using. Ideal for Forex Trading, Futures Trading, Crypto Trading and Stocks Trading
This BIAS Depth Heatmap includes:
6 Levels of BIAS Depth
Scalping Setting
Day Trading Setting
Swing Trading Setting
And by only concentrating on trading the highest probability trades of any trading strategy, we can block out all the other noise and concentrate on a simple set of rules!
This is why our Founder, Paul Bratby, decided to help filter out all the noise and allow traders to see what's going off on higher timeframes "in depth" to help make those important trade entry decisions. This more global view of the BIAS DEPTH is designed to help traders make decisions faster!

Heatmap WatchlistThis is a Heatmap for custom watchlist tickers. Similar to S&P500 Heatmap .
Add up to 20 tickers.
Check higher timeframe from a lower timeframe.
Check previous candle for any timeframe.
Switch on/off "Price%" and/or "Volume%" heatmap.

S&P500 Heat MapS&P sectors heat map. Follows the timeframe of the active chart.
The following SPDR select sector funds are included
XLB - Materials
XLC - Communication
XLE - Energy
XLF - Financials
XLI - Industrials
XLK - Information technology
XLP - Consumer staples
XLRE - Real estate
XLU - Utilities
XLV - Healthcare
XLY - Consumer discretionary
SPY and current chart ticker will also be included by default, but can be disabled in the settings.
Optional:
There's a switch in setting "Data from previous bar" - if selected, the change percent will be from the previous candle. For example, if the chart timeframe is daily with this option selected, data will be from previous day. Similar situation with all timeframes. Also, when this option is active, the text "Previous Bar" will be printed in red color on the top right corner to avoid any confusion.

Williams Alligator Trend Filter HeatmapHello I've decided that the alligator lines can be used to find a trend. This script expands on that and checks 10 different multipliers to see trend over the long term and have 10 values. Those 10 values each give a color to one of the 10 lines in turn giving this Fire like plotting. I personaly use this to see if there is fear (red) in the markets or greed (blue), plotted 9 different crypto coins on the chart and have 4 columns in my setup to see the values on different timeframes. In the chart preview this is 1H,30M,10M,1M to see current environment. The colors use alot of data to generate especialy the bottom part, that colors based on a very long time zone.
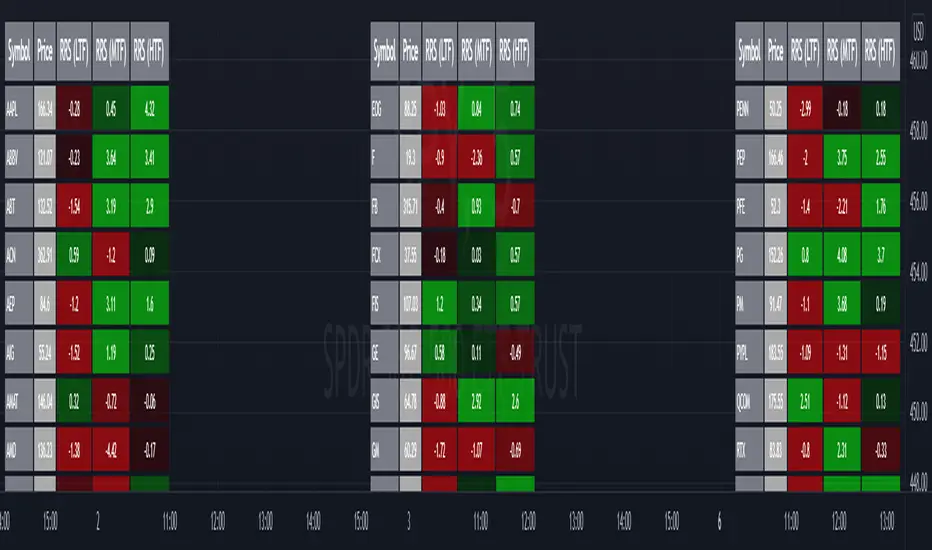
Relative Strength Screener V2 - Top 100 volume leadersNew and improved strength heatmap for the top 100 volume leaders in the S&P. Coded in a workaround to the 40 request.security limitation that currently exists in Pine. Added the ability to input the number of columns (time frames) you wish to display.
For 3 time frame analysis, add the indicator to your chart 3 times. Change the number of columns to 3 for each of these indicators. Specify the column and time frame for each one (example, 5 minute for column 1, 1 hour for column 2 and Daily chart for column 3). It will automatically resize the columns/tables to properly display the output. This provides a sort of "Strength Heatmap" for the top 100 stocks in the S&P. To achieve this, make a copy of the indicator and substitute lines 68-105 with the following premade watchlists :
Make a copy 1 - FIrst 38 volume leaders in the S&P
s01 = input.symbol('AAPL', group = 'Symbols', inline = 's01')
s02 = input.symbol('ABBV', group = 'Symbols', inline = 's02')
s03 = input.symbol('ABT', group = 'Symbols', inline = 's03')
s04 = input.symbol('ACN', group = 'Symbols', inline = 's04')
s05 = input.symbol('AEP', group = 'Symbols', inline = 's05')
s06 = input.symbol('AIG', group = 'Symbols', inline = 's06')
s07 = input.symbol('AMAT', group = 'Symbols', inline = 's07')
s08 = input.symbol('AMD', group = 'Symbols', inline = 's08')
s09 = input.symbol('APA', group = 'Symbols', inline = 's09')
s10 = input.symbol('ATVI', group = 'Symbols', inline = 's10')
s11 = input.symbol('AXP', group = 'Symbols', inline = 's11')
s12 = input.symbol('BA', group = 'Symbols', inline = 's12')
s13 = input.symbol('BBWI', group = 'Symbols', inline = 's13')
s14 = input.symbol('BBY', group = 'Symbols', inline = 's14')
s15 = input.symbol('BK', group = 'Symbols', inline = 's15')
s16 = input.symbol('BMY', group = 'Symbols', inline = 's16')
s17 = input.symbol('BRK.B', group = 'Symbols', inline = 's17')
s18 = input.symbol('C', group = 'Symbols', inline = 's18')
s19 = input.symbol('CAT', group = 'Symbols', inline = 's19')
s20 = input.symbol('CCL', group = 'Symbols', inline = 's20')
s21 = input.symbol('CFG', group = 'Symbols', inline = 's21')
s22 = input.symbol('CL', group = 'Symbols', inline = 's22')
s23 = input.symbol('CNC', group = 'Symbols', inline = 's23')
s24 = input.symbol('COF', group = 'Symbols', inline = 's24')
s25 = input.symbol('COP', group = 'Symbols', inline = 's25')
s26 = input.symbol('COST', group = 'Symbols', inline = 's26')
s27 = input.symbol('CRM', group = 'Symbols', inline = 's27')
s28 = input.symbol('CVS', group = 'Symbols', inline = 's28')
s29 = input.symbol('CVX', group = 'Symbols', inline = 's29')
s30 = input.symbol('DAL', group = 'Symbols', inline = 's30')
s31 = input.symbol('DIS', group = 'Symbols', inline = 's31')
s32 = input.symbol('DISCA', group = 'Symbols', inline = 's32')
s33 = input.symbol('DISCK', group = 'Symbols', inline = 's33')
s34 = input.symbol('DISH', group = 'Symbols', inline = 's34')
s35 = input.symbol('DLTR', group = 'Symbols', inline = 's35')
s36 = input.symbol('DOW', group = 'Symbols', inline = 's36')
s37 = input.symbol('DVN', group = 'Symbols', inline = 's37')
s38 = input.symbol('EBAY', group = 'Symbols', inline = 's38')
Make a copy 2 - Tickers 39 to 76
s01 = input.symbol('EOG', group = 'Symbols', inline = 's01')
s02 = input.symbol('F', group = 'Symbols', inline = 's02')
s03 = input.symbol('FB', group = 'Symbols', inline = 's03')
s04 = input.symbol('FCX', group = 'Symbols', inline = 's04')
s05 = input.symbol('FIS', group = 'Symbols', inline = 's05')
s06 = input.symbol('GE', group = 'Symbols', inline = 's06')
s07 = input.symbol('GIS', group = 'Symbols', inline = 's07')
s08 = input.symbol('GM', group = 'Symbols', inline = 's08')
s09 = input.symbol('GS', group = 'Symbols', inline = 's09')
s10 = input.symbol('HD', group = 'Symbols', inline = 's10')
s11 = input.symbol('IBM', group = 'Symbols', inline = 's11')
s12 = input.symbol('INTC', group = 'Symbols', inline = 's12')
s13 = input.symbol('JNJ', group = 'Symbols', inline = 's13')
s14 = input.symbol('JPM', group = 'Symbols', inline = 's14')
s15 = input.symbol('KR', group = 'Symbols', inline = 's15')
s16 = input.symbol('LUV', group = 'Symbols', inline = 's16')
s17 = input.symbol('LVS', group = 'Symbols', inline = 's17')
s18 = input.symbol('MA', group = 'Symbols', inline = 's18')
s19 = input.symbol('MCD', group = 'Symbols', inline = 's19')
s20 = input.symbol('MCHP', group = 'Symbols', inline = 's20')
s21 = input.symbol('MDT', group = 'Symbols', inline = 's21')
s22 = input.symbol('MET', group = 'Symbols', inline = 's22')
s23 = input.symbol('MGM', group = 'Symbols', inline = 's23')
s24 = input.symbol('MOS', group = 'Symbols', inline = 's24')
s25 = input.symbol('MPC', group = 'Symbols', inline = 's25')
s26 = input.symbol('MRK', group = 'Symbols', inline = 's26')
s27 = input.symbol('MRNA', group = 'Symbols', inline = 's27')
s28 = input.symbol('MS', group = 'Symbols', inline = 's28')
s29 = input.symbol('MSFT', group = 'Symbols', inline = 's29')
s30 = input.symbol('MU', group = 'Symbols', inline = 's30')
s31 = input.symbol('NCLH', group = 'Symbols', inline = 's31')
s32 = input.symbol('NEE', group = 'Symbols', inline = 's32')
s33 = input.symbol('NEM', group = 'Symbols', inline = 's33')
s34 = input.symbol('NFLX', group = 'Symbols', inline = 's34')
s35 = input.symbol('NKE', group = 'Symbols', inline = 's35')
s36 = input.symbol('NVDA', group = 'Symbols', inline = 's36')
s37 = input.symbol('ORCL', group = 'Symbols', inline = 's37')
s38 = input.symbol('OXY', group = 'Symbols', inline = 's38')
Make a copy 3 - tickers 77 to 114
s01 = input.symbol('PENN', group = 'Symbols', inline = 's01')
s02 = input.symbol('PEP', group = 'Symbols', inline = 's02')
s03 = input.symbol('PFE', group = 'Symbols', inline = 's03')
s04 = input.symbol('PG', group = 'Symbols', inline = 's04')
s05 = input.symbol('PM', group = 'Symbols', inline = 's05')
s06 = input.symbol('PYPL', group = 'Symbols', inline = 's06')
s07 = input.symbol('QCOM', group = 'Symbols', inline = 's07')
s08 = input.symbol('RTX', group = 'Symbols', inline = 's08')
s09 = input.symbol('SBUX', group = 'Symbols', inline = 's09')
s10 = input.symbol('SCHW', group = 'Symbols', inline = 's10')
s11 = input.symbol('SLB', group = 'Symbols', inline = 's11')
s12 = input.symbol('SYF', group = 'Symbols', inline = 's12')
s13 = input.symbol('T', group = 'Symbols', inline = 's13')
s14 = input.symbol('TFC', group = 'Symbols', inline = 's14')
s15 = input.symbol('TGT', group = 'Symbols', inline = 's15')
s16 = input.symbol('TJX', group = 'Symbols', inline = 's16')
s17 = input.symbol('TMUS', group = 'Symbols', inline = 's17')
s18 = input.symbol('TSLA', group = 'Symbols', inline = 's18')
s19 = input.symbol('TWTR', group = 'Symbols', inline = 's19')
s20 = input.symbol('TXN', group = 'Symbols', inline = 's20')
s21 = input.symbol('UAL', group = 'Symbols', inline = 's21')
s22 = input.symbol('UNH', group = 'Symbols', inline = 's22')
s23 = input.symbol('V', group = 'Symbols', inline = 's23')
s24 = input.symbol('VIAC', group = 'Symbols', inline = 's24')
s25 = input.symbol('WBA', group = 'Symbols', inline = 's25')
s26 = input.symbol('WFC', group = 'Symbols', inline = 's26')
s27 = input.symbol('WMT', group = 'Symbols', inline = 's27')
s28 = input.symbol('WYNN', group = 'Symbols', inline = 's28')
s29 = input.symbol('XOM', group = 'Symbols', inline = 's29')
s30 = input.symbol('SPY', group = 'Symbols', inline = 's30')
s31 = input.symbol('SPY', group = 'Symbols', inline = 's31')
s32 = input.symbol('SPY', group = 'Symbols', inline = 's32')
s33 = input.symbol('SPY', group = 'Symbols', inline = 's33')
s34 = input.symbol('SPY', group = 'Symbols', inline = 's34')
s35 = input.symbol('SPY', group = 'Symbols', inline = 's35')
s36 = input.symbol('SPY', group = 'Symbols', inline = 's36')
s37 = input.symbol('SPY', group = 'Symbols', inline = 's37')
s38 = input.symbol('SPY', group = 'Symbols', inline = 's38')
Weekly Volume HeatmapThis tool is designed to visualize how the trading volume of each asset changes during the week.
How to use
This tool can help us better understand the market and answer many questions, such as:
◽ How to avoid getting stop hunted?
Typically, trading volume decreases at certain times of the week, which is the best time for large holders to manipulate the market. Low volume means there is less liquidity in the market. Large transactions in an illiquid market can cause large price changes.
Large holders (whales) have enough capital to push the price in the desired direction to trigger a cascade of stop-loss orders which can move the price further.
After a stop hunt, the market typically reverses, leaving stop hunted traders behind.
It is best to avoid using stop-loss orders and leveraged trading during these hours of the week.
◽ When’s the best time to make decisions
During some hours of the week the trading volume usually decreases; at these times, most traders are inactive and do not participate in transactions.
Therefore, the price changes that occur during these times lack conviction.
It is better to make decisions when there are more active traders in the market. At these periods, a relatively high trading volume is usually observed.
How it works
First, it calculates the average traded volume of each period (for example Monday 9:00 AM) from the first bar to the last bar. It then calculates the ratio of the average traded volume in each period to the average traded volume per week. Finally, the result is displayed as a percentage in each cell.
Different values are distinguished by different background colors. Light colors are used for low values and dark colors are used for high values.
Limits
It only works in the 1 hour time frame.
Samples
Stock => AAPL
Futures => ES1!
Forex => EURUSD

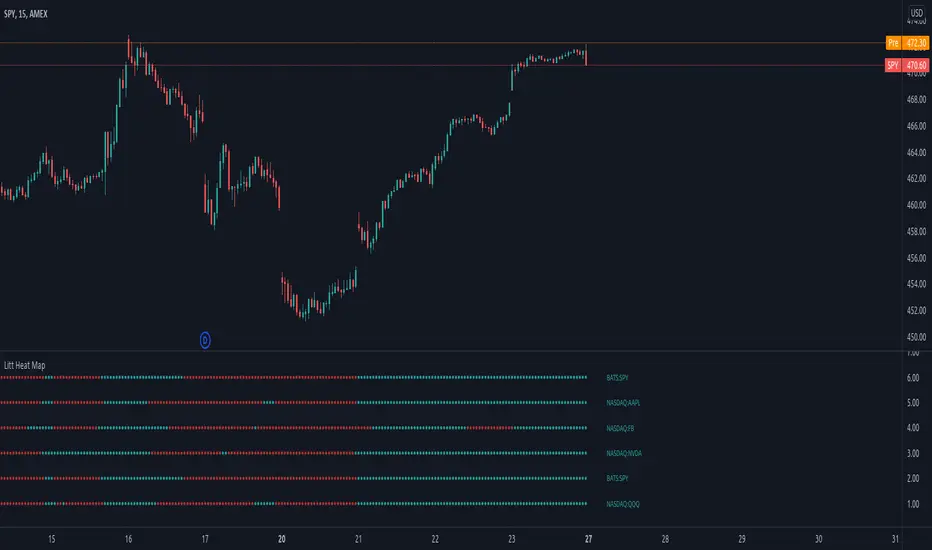
Litt Heat MapThe Litt Heap Map uses the MA Line (Moving Average Line) from Litt Pro Indicators. The Heat Map tells the trader the trend direction based on MA 1 and MA 2.
If the value of MA 1 is greater than the value of MA 2 then the MA Line is colored Bull.
If the value of MA 1 is less than the value of MA 2 then the MA Line is colored Bear.
The Litt Heat Map allows you to see the MA Line for multiple symbols on 1 chart! You can use the Heat Map as a scanner to see when trend has changed, or as a trend confirmation tool when multiple symbols are aligning.