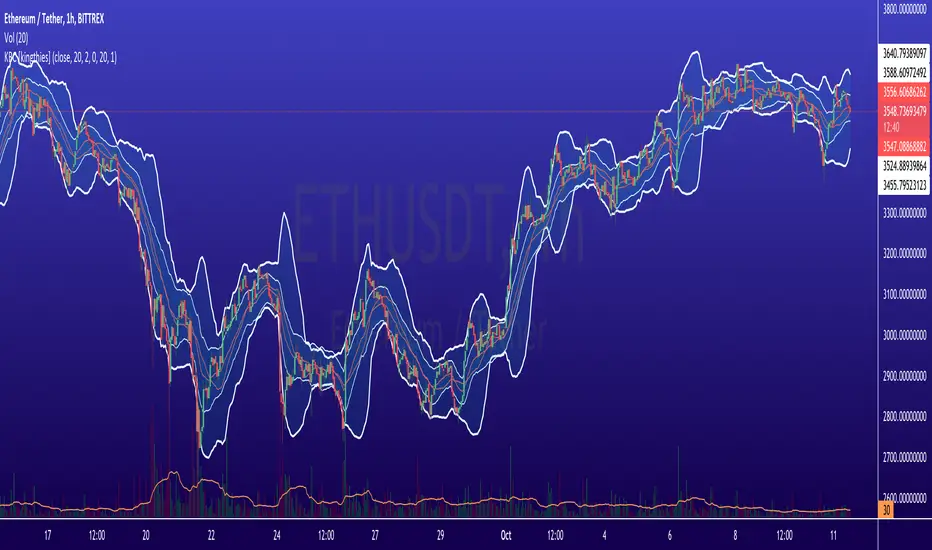
(JS) Squeeze Pro OverlaysSo this was something I planned on doing in the future, I knew it would take some time to put together but here it is, the Squeeze Pro 2 Overlays.
On my original Squeeze Pro, I had made several overlay indicators to go along with it, this time my goal was to combine all that stuff into a single indicator and allow the user to turn on and off the specific features they'd prefer to use. The version illustrated in the preview has everything turned on. What is "everything"? Here's the breakdown...
First of all - the color schemes in the Squeeze Pro match the color schemes in the Overlays indicator, so you can match them up (Color Scheme 3 in example). There are 6 schemes, option 1 is the original Squeeze colors.
There's also an option to make the light squeeze black, rather than white. This is for people who aren't using Dark Mode. It will flip all white to black, to make your charts better to read!
So there are 4 main overlays that can be switched on and off with this indicator, they include;
1. Early Signal Candles
2. BBMA Basis Line
3. Bollinger Bands/Keltner Channel Breaches
4. Signal Arrows
Early Signal Candles
The Early Signal Candles have two parameters, the entry smoothing period and the exit smoothing period.
There is a different type of early entry signal for each type of squeeze.
Low Squeeze generates white dots on the highs of the candles.
Mid Squeeze generates a lime green candle (or purple candle in color scheme 3).
High Squeeze generates a bigger purple circle on the high of the candle.
These three signals are made to mimic the original Early In/Out Candles from John Carter and represent the same thing (they work the same way).
As for the early exit, that would be determined by the color of the candle vs the color of the squeeze, works the same way as the original as well.
BBMA Basis Line
The BBMA (Bollinger Bands Momentum Average) was a moving average I had made to use with the squeeze on the previous version.
It is the basis line of the BB and KC used to make up the Squeeze (a 20 SMA). There are 4 different colors to it on this version.
1. Orange - This means no squeeze.
2. White/Black - Low Squeeze
3. Red - Mid Squeeze
4. Yellow - High Squeeze
You'll also notice these colors are light and dark in different spots - this is a representation of whether the Bollinger Bands are expanding or contracting. Dark means expanding, light means contracting.
Bollinger Bands/Keltner Channel Breaches
This is a pretty simple feature. If there is an ongoing squeeze, and a candle closes above or below the Bollinger Bands or Keltner Channels, a circle appears at the top or the bottom of the chart telling you which way the channel has been breached.
Signal Arrows
This is what makes up most of the overlay indicator. If you turn it on, the default is set to work just like the original. There are lots of options with this though.
First, you can turn each type of Squeeze Arrow on or off by checking/unchecking the boxes for them.
Now allow me to explain the "Signal Length", as there are several options.
The default is "6 Dots", this generates a signal when a particular type of Squeeze reaches the 6th dot ("12 Dots" works the same way).
"End of Squeeze" generates a signal once a type of Squeeze has concluded.
"End of Early Signal" generates a signal when the early dots (or candle) finishes.
"Custom" allows you to select your own dot duration to produce a signal, you select that number in the field below.
The other portion of this is the "Signal Type", this is where you select how each signal is generated once the selected amount of time takes place.
The default is the same as the original "+/-", this generates a signal based on whether Squeeze momentum is positive or negative.
"Rising/Falling" will only generate a signal if the Squeeze momentum maintains consistently over the last 6 bars.
"Crossed Zero" only generates a signal if the Squeeze momentum crosses above or below the zero line.
"Basis Line Momentum" is based on the BBMA. A signal is generated based on whether the current candle closes above or below the basis line.
"Divergence" only generates a signal if there is a divergence signal present at the time of the signal.
"Current Momentum" generates a signal based simply on the current direction of Squeeze momentum.
"Sum of Change" generates a signal based on the sum of the change in the Squeeze momentum being positive (long) or negative (short) over the length of time you select in the "Sum of Change Length" field.
Then "Combo" tries to take a look at everything and generates a score based on these parameters. Positive score = long, negative = short.
I hope I gave a detailed enough explanation on how everything works, let me know if you have any questions! Hope you like it!
Канал Кельтнера (KC)

Keltner | Bollinger | SqueezePercent B (%B), it's derivation Percent K (%K) and squeeze indicator combined in one.
blue line = bollinger %
orange line = keltner %
red background = squeeze*
squeeze = bollinger bands are inside (encapsulated by) keltner channel

KeltnerModified + DonchianColoredKeltner Channel + color coded candles when making new Donchian highs/lows
Zero Lag Keltner ChannelsThis is Keltner Channelz (KC) with Zero Lag Moving Average (ZLMA as base). It is smoother and has less lag than the original (EMA/SMA) variant.
It also can be used as a trend indicator and trend confirmation indicator. The upper and lower bands are green if it is an up trend, and red if a down trend. If both have the same color it is a stronger trend.
Adam H Grimes - Keltner Channels with Day's High & LowThe indicator shows the day's high and low along with the Keltner Channels.
Keltner Channel Period - 20
Keltner Channel Multiple - 2.25

(JS) Squeeze Pro 2This is my version of the updated classic indicator created by John Carter. I plan on adding a Squeeze Overlay script in the future that will pair with this one as well for additional signals.
So to break down the Squeeze, what it is, how it works, etc - you have to look at the components that make it up.
1. Bollinger Bands
2. Keltner Channels
3. Momentum
The momentum in this indicator is smoothed out using linear regression (shout out to Lazy Bear, it's a much simpler way to do it, imo).
The momentum is what is displayed on the indicator as a histogram, its purpose is obvious (to show momentum).
Now what is a Squeeze? A squeeze occurs when Bollinger Bands tighten up enough to slip inside of Keltner Channels.
This is interpreted as price is compressing and building up energy before releasing it and making a big move.
Traditionally, John Carter's version uses 20 period SMAs as the basis lines on both the BB and the KC.
In my version, I've given the freedom to change this and try out different types of moving averages.
His original squeeze indicator had one Squeeze setting, though this new one has three .
The white dot Squeeze , call it a "low squeeze", an "early squeeze", whatever you'd like - this is the easiest Squeeze to form based on its settings.
The red dot Squeeze is the original from the first Squeeze indicator.
And finally, the yellow dot squeeze , call it a "high squeeze", "power squeeze", once again whatever you want - is the most difficult to form and suggests price is under extreme levels of compression.
From what I've witnessed John Carter say in the past, the squeeze is meant to be used for continuation.
Now to explain the parameters:
Squeeze Input - This is just the source for the Squeeze to use, default value is closing price.
Length - This is the length of time used to calculate the Bollinger Bands and Keltner Channels.
Bollinger Bands Calculation Type - Selects the type of moving average used to create the Bollinger Bands.
Keltner Channel Calculation Type - Selects the type of moving average used to create the Keltner Channel.
Color Format - I have created 5 different color schemes, this allows you to choose one.
Draw Divergence - Self explanatory here, this will auto-draw divergence on the indicator.
Gray Background for Dark Mode - This is something I put on all my indicators to make them more visually appealing.
Moving on to the alerts, I have made some basic alerts to notify certain indicator conditions (I had to revise it back from the prior version, as V4 of PineScript limits outputs).
6th Dot Alerts - This will inform you when a certain Squeeze makes it 6 dots in. Why 6 dots? That is what John Carter said to be his preference.
12th Dot Alerts - Think of this as a "prolonged Squeeze" alert. I feel like if they do run this long you likely need to go up in resolution, but some traders prefer certain time increments so this is for them.
End of Squeeze Alerts - Self explanatory again - once a Squeeze has concluded this will provide you with a notification.
Start of Squeeze Alerts - Opposite of the alert above, notifications come when a Squeeze begins.
Zero Line Alerts - This will inform you of when the momentum makes a bullish or bearish move across the zero line.
I hope that I've done well enough explaining the indicator and how it works, for any further information on it I suggest you check out Simpler Trading and get linked up with John Carter over there.
He does lots of videos, webinars, and of course you can always get the official indicator and his signals there too.

Bollinger Band - Keltner Squeeze - Failed Volatility BreakoutThis simple script provides Bollinger Band and Keltner Channel indicators, and will highlight areas where the Bollinger Bands enter into the Keltner Channel.
This script is based on the Failed Volatility Breakout (FVBO) System used by professional trader ChrisD_Macro. The default plot styles for the indicators in this script are based on Chris's setup, but visual styles as well as BB and Kelt settings (length, standard deviation, etc...) can all be easily customized with the user interface in the indicator settings.
You can also choose whether you want the condition to be triggered by just one Bollinger Band entering the Keltner Channel, or if it has to be both bands entering the channel.
This script is very useful when manually back testing the FVBO strategy, as it clearly highlights the BB-Kelt squeezes instead of having to constantly scroll in and out looking for them.
It can also be useful live as it has the ability to trigger TradingView alerts using the condition "BB-Kelt Squeeze".
Hope it's helpful
- JDC
Side Notes:
With Forex / Currencies this indicator I usually use this indicator on the 1 Day time frame.
Keep in mind that the script includes the Bollinger Bands and Keltner Channels, so if you already have your own version of these indicators on your chart, it will get really messy. (Just hide the other indicators while you get to know this one).

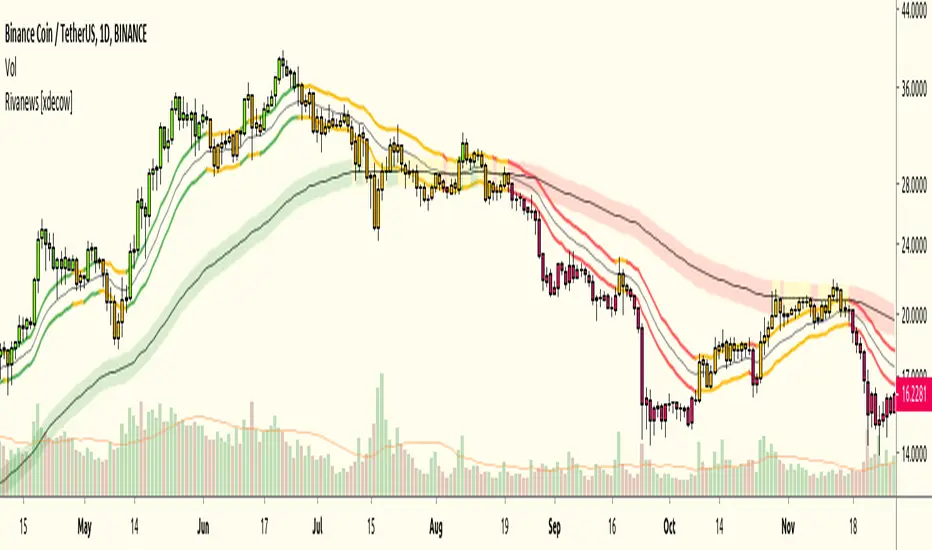
Rivanews Setup - Riva-Keltner, Média Rock [xdecow]This setup was created by Rivadavila S. Malheiros
There are 2 Keltner Channels with exponential moving averages of 21 (riva) and 89 (rock) and ATR multiplier of 0.618.
When the price is between the bands, it is a sign of consolidation (yellow).
When the price is above the bands, it is an upward trend (green).
When the price is below the bands, it is a downward trend (red).
When the price crosses rock 89 and closes up / down, it may be a sign of a reversal. But it has a high probability of testing rock 89 again.
------------------------------------------------------------------------------------------
PT-BR
Este setup foi criado por Rivadavila S. Malheiros
São 2 Keltner Channels com médias móveis exponenciais de 21 (riva) e 89 (rock) e multiplicador do ATR de 0.618.
Quando o preço está entre as bandas, é sinal de consolidação (amarelo).
Quando o preço está acima das bandas, é uma tendencia de alta (verde).
Quando o preço está abaixo das bandas, é uma tendencia de baixa (vermelho).
Quando o preço cruza a rock 89 e fecha acima/abaixo, pode ser sinal de reversão. Mas tem uma alta probabilidade de testar a rock 89 novamente.
Keltner Channel Alerts [QuantNomad]This is a script with alerts for standard Keltner Channer Strategy you can find in TradingView.
Use "Once Per Bar" option when creating alerts.

Jurik Moving Average Crossover Strategy [ChuckBanger]The classic moving average crossover strategy does not work well in markets that, instead of trending, tend to frequently reverse within a trading range. The lag between the actual time the market has reversed direction and when the moving average is signalling a trade, the trend is already over and the market is about to go against your position. In this environment, a more appropriate trading strategy is suggested here using an JMA Keltner Channel.
The idea is to create a channel based of support and resistance. When the market breaks out of the channel, and fails to maintain momentum. It is likely the price will fall back toward the center of the channel. This tendency can be exploited in the following manner.
In the chart above, The aqua and maroon (center line) and the blue lines are part of a channel. The middle line is a slow running JMA of the closing prices, with Length = 30 and phase = 0. The upper blue band is constructed by adding 1.5 times of 30-bar ATR (average true range) to the center JMA line and the lower blue band by deducting the same amount. There is a grey line running through the data- That is a fast running JMA with length = 5 and phase = 100 representing the price.
The red dots indicate that the the price is going back in the channel and the market is retracting from a failed upward breakout, and the green dots mark when price is retracting from a failed downward breakout. These are places where one might want to enter the trade. The orange dots indicate where price crosses the center line, a reasonable place to take profit from or even exit the trade.
The center line also shows the up or down movements if the setting is ticked. This feature is useful to use when exit a trade. For example, you enter a long position on a green dot signal and the color is maroon. You can wait for 3-5 candles (depending of markets). And if the color doesn’t change it can be an indication that the price is going lower. Here it is possible to switch to a short possible or the opposite apply if you enter on a red dot.
The parameter use in this study is for demonstrating purposes only. This is to show how you can use JMA. Do not trade with real money without thoroughly test the strategy. And always use stop-losses.

Keltner Channel with signals [ChuckBanger]This is Keltner Channel where I added Bull and Bear signals. It has a lot of settings to play around with. Have fun...
For more information on Keltner Channel: www.investopedia.com

ENVELOPE BOLLINGER KELTN IMPULSE EMA SMA SAFEZONE SAR CHANDELIERALL THIS ALL IN ONE!
there are many options to check or uncheck to show only the tool that you need at that particular moment.
ENJOY!
ENVELOPE BOLLINGER KELTNER IMPULSE EMA SMA SAFEZONE SAR CHANDELIER
Lancelot Band - ATR Reversal+Trending IndicatorThis is an indicator I created recently, with the mind of spotting where price might reverse and where the price is trending. You can see this as the primary indicator for your system, however, it is recommended you use this in conjunction with other confirmation indicators.
This script focus solely on ATR or Average True Range.
This indicator is the combination of the baseline from the Ichimoku cloud and the concept of the Keltner channel.
Baseline period = 14
ATR period = 14
ATR Mult = 1.5
For reversal
Long when price crossover Lower band & Stop loss at xLower band
Sell when price crossunder Upper band & Stop loss at xUpper band
For Trend Following
Long when price crossover xUpper band and Stop loss at Upper band
Short when price crossunder xLower band and Stop loss at Upper band
Again, you will need other indicators to help you to succeed in this system. This indicator will not generate the best exit for your position but will generate a good entry signal when you use it with both volume indicator and exit indicator.
Works well on BTCUSD XBTUSD, as well as other major liquid Pair.
Feel free to follow me on Twitter @Lancelot_Auger for more free Alpha.
Please acknowledge my effort by like and follow.
And lastly,
Save Hong Kong, the revolution of our times.

Alert-QuarryLake Indicator Map - ATR Trend Following Strategy A lot of times I don't like my chart crowding with indicators, thus the reason for creating this script for my strategy QuarryLake.
This script also comes with alert.
Below is the explanation for QuarryLake
I have also updated the script in version 4.
This strategy consists of 3 indicators that I found works quite well together.
Keltner Channel, Waddah Attah Explosion, and Volatility Stop.
You can find WAE here
KC Period = 200
KCATR = 5
Vstop Period = 3
Vstop Mult = 1.5
Long when close > KC, close > Vstop, WAE trendUp
Short when close < KC, close < Vstop, WAE trendDown
Works well on BTCUSD XBTUSD, as well as other major liquid Pair.
Feel free to follow me on Twitter @Lancelot_Auger for more free Alpha.
Please acknowledge my effort by like and follow.
And lastly,
Save Hong Kong, the revolution of our times.

TA-Money Flow-Version4Updated for TV-Pine V4
This is the MACD of a stochastic OBV movement indicator and now the MACD of the Squeeze Momentum Indicator. It is good (right) to work with both price and volume...it is also good to utilize the most popular indicator ever in TV (Lazybear).
I've included highlighting based on price divergence, yellow is divergence of either OBV or SQZ, red is both divergence, and then I've also built in the "squeeze on - blue" highlighting to show follow through of divergence. It works great on any time frame, but you need to have volume data. Not sure where I originally got this (stoch-OBV, somewhere off Tradingview several years ago, thanks to the person who shared), Squeeze is Lazybear, links below.
Enjoy.
Version 4:
Updated OBV equation because TV-Pine V3 broke in V4
Included MACD of Squeeze for histogram
Included "squeeze on" highlighting
TA-Money-Flow-Version3
TA-Money-Flow-Version2
Squeeze-Momentum-Indicator-LazyBear
Keltner Channels around Hull MAKeltner Channels around Hull Moving Average
Script shared upon request. No guarantees on accuracy.
Keltner ZonesThis is an indicator that draws support and resistance zones / levels based on price action in and around Keltner Channels.
There are 3 different modes;
Draw zones based on price breaking the upper band
Draw zones based on price breaking the lower band
Draw zones if price stays within the bands for a prolonged period of time.
You can also decide if you want the indicator to paint zones or levels. The Zones can grow rather large if there is a volatility shock since they are drawn using the true range around the trigger price.
Upper Band Zones
Lower Band Zones
Congestion Zone
Keltner Channel signalsUsing pupytherapy script
and the same system that we use for Bollinger and linear channel we can make easy the signal for the Keltner channel
I need to think how to make all those channels to combine I hope in next version I could do it :)

Keltner Channels x 2"Keltner Channel x 2" is a simple modification of another script found on Tradingview that was posted by Ale91wolf called "Keltner Channels Linda Raschke".
This modified script allows the user to stack one Keltner Channel on top of another using different ATR multipliers which can be helpful by creating more visual
levels of price action as well as areas for potential trailing stop levels.