Keltner Channel Strategy The Keltner Channel, a classic indicator
of technical analysis developed by Chester Keltner in 1960.
The indicator is a bit like Bollinger Bands and Envelopes.
WARNING:
- This script to change bars colors.
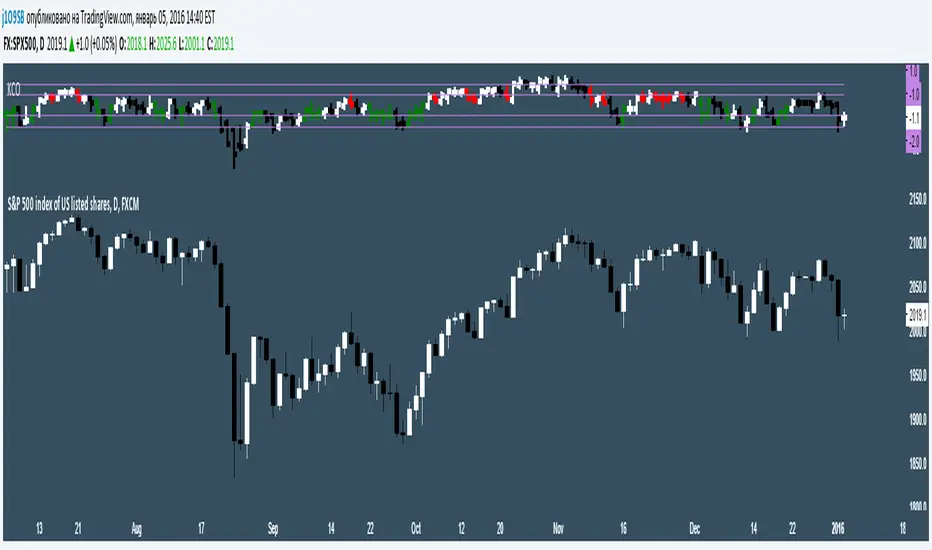
Канал Кельтнера (KC)

Keltner Channel The Keltner Channel, a classic indicator
of technical analysis developed by Chester Keltner in 1960.
The indicator is a bit like Bollinger Bands and Envelopes.

BB & KCThis script is a mix of both the default Bollinger Bands and the default Keltner Channels.
It helps in identifying the squeeze of the bands and also the consolidation of the price movement.

Advanced Keltner ChannelsThis is a more advanced version of the standard Keltner Channels indicator. It allows you to change the type of the moving average (Simple, Exponential, Weighted, Volume-weighted, Triple EMA or a moving average that uses RSI ). The indicator also allows you to volume weight the indicator (turned on by default). If you want to weight the indicator against the true range instead of volume this is also possible. By default, this will be done automatically for assets that do not support volume .

VW EMA CCI + TTM Volume Weighted EMA CCI + TTM squeeze in one indicator
Credit goes to SpreadEagle 71 for the CCI and Greeny for the TTM

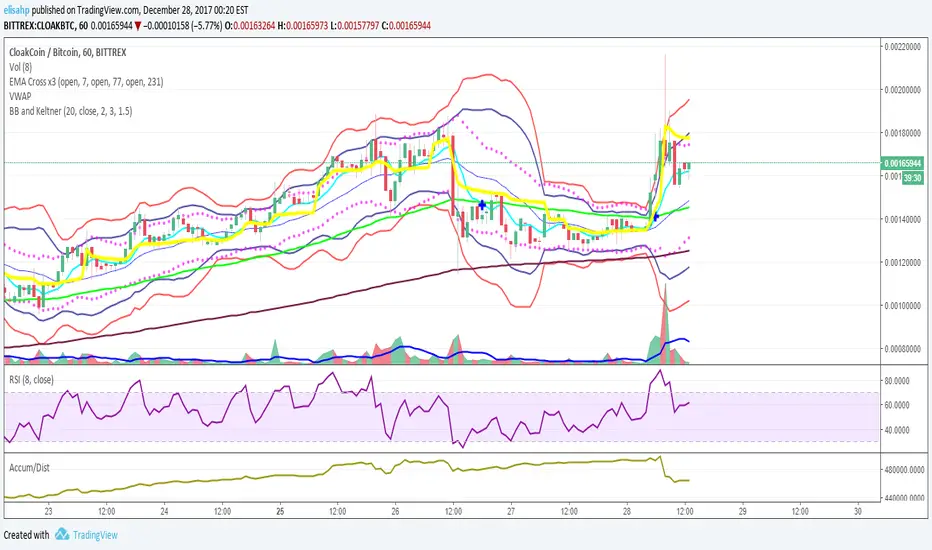
Bollinger Bands and Keltner Channel (BB and KC)Script that combines 2 Bollinger Bands (Std Dev = 1 and Std Dev = 2) with Keltner Channel (Std Dev = 1.5)
OHLC Daily Resolution BandsShout out to nPE- for the idea.
Bands made with stdev from 10 day OHLC.
Keeps resolution to daily, so you can use bands as daily pivots for day trading.
Upper band 1=yesterday close + 0.5 std(ohlc,10)
Upper band 1=yesterday close + 1 std(ohlc,10)
Mid=yesterday close
Lower band 1=yesterday close - 0.5 std(ohlc,10)
Lower band 2=yesterday close - 1 std(ohlc,1

Hull Moving Average + Bollinger BandsThis study make use of Hull Moving Average and Bollinger Bands.
The crosses give signal about HMA and BB crossovers, they are a bit lagging, if you stare well you will spot them a little earlier. It look like a good idea to buy and sell when HMA is near or on the outside of the outer bands.
By default the Bollinger Bands uses Simple Moving Average with 21 periodes, and Hull Moving Average use 9 periodes. You can alter the settings in the format dialog.
Please use as pleased, and if you do something clever with it I'll be happy to know :D

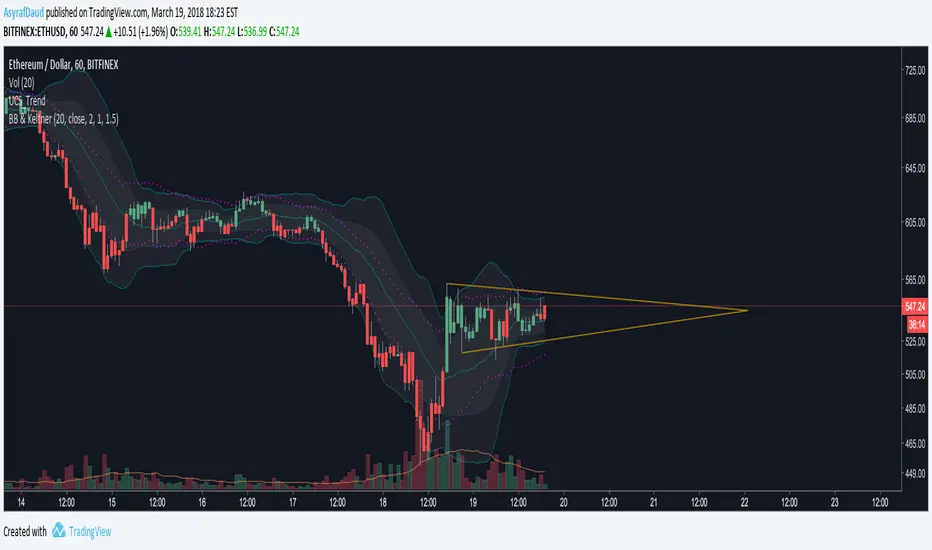
BB and Keltner SqueezeStrategy using the Bollinger band with the Keltner Channels . Watch for the Bollinger bands (blue/red lines) squeezing inside the Keltner Channels (pink dots) for a breakout - this could be up or down so use in conjunction with other indicators.
The blue band is the 2 standard deviation from price, the red is 3 standard deviations. With these, typically if the price bounces off the red then it will retrace a little, (although if there is a massive breakout/down this may not hold). When the bands narrow this is an indicator of consolidation, therefore with a likely upcoming breakup or down.
The pink dots are the Keltner Channels. The strategy says if the bollinger bands come inside the Keltner Channels then this is a strong indicator that the breakout is coming. Sometimes the length of time the squeeze occurs for is indicative of the length/strength of the breakout.
These indicators can be used on all timeframes but higher timeframes will be stronger and more reliable of a trend change.

BB and KeltnerStrategy using the Bollinger band with the Keltner Channels. Watch for the Bollinger bands (blue/red lines) squeezing inside the Keltner Channels (pink dots) for a breakout - this could be up or down so use in conjunction with other indicators.
DepthHouse - Moving Average ChannelsThe indicator Moving Average Channels was created for experimental purposes due to the parabolic moves BTC has made in the recent past.
How it works:
The basis, or center line, is a standard moving average that is set by the user.
The bands are then a customizable percentage of the basis.
Which based on the settings, could serve as possible support and resistance.
DepthHouse – Moving Average Channels has been published for you all to see and try for yourselves.
Maybe this indicator has uses elsewhere? If you find something feel free to post it in the comments below!
If you like this indicator, please drop a like or comment!
They are very much appreciated!
Be sure to go to my profile and check out my other indicators!

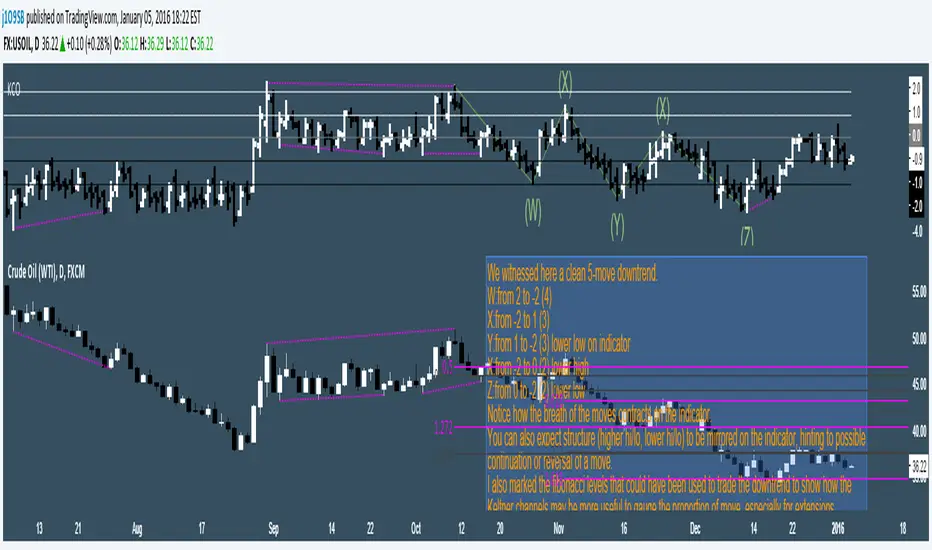
Keltner Channels Oscillator v3V2 with Bollinger Bands
Planning to make an STO/KCO hybrid and a model strategy for an all-in-one indicator.
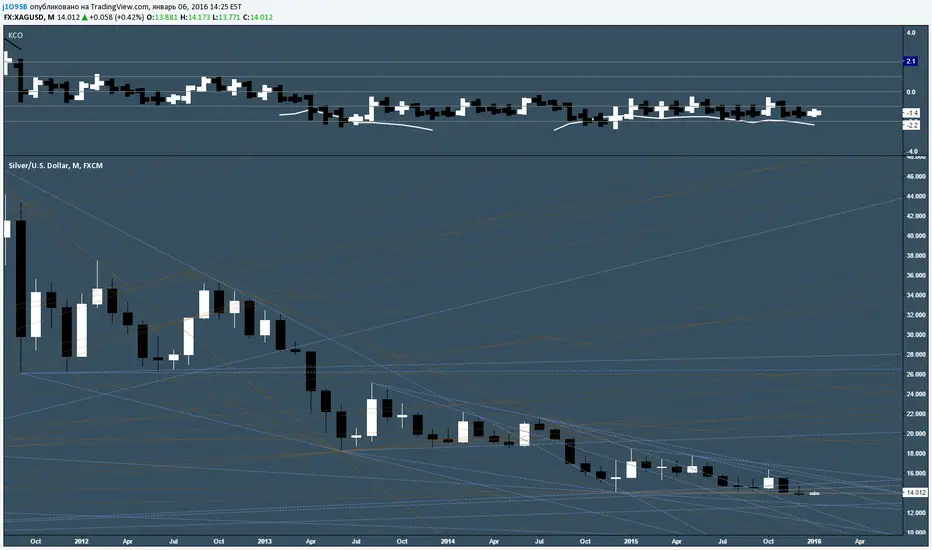
Keltner Channels Oscillator v2A cleaner aesthetic and an introduction to the indicator's uses.
I would also be very appreciative of any Keltner Channels related ideas or concepts you may have run across to add features to this indicator.
Trading Strategy based on BB/KC squeeze**** [Edit: New version (v02) posted, see the comments section for the code *****
Simple strategy. You only consider taking a squeeze play when both the upper and lower Bollinger Bands go inside the Keltner Channel. When the Bollinger Bands (BOTH lines) start to come out of the Keltner Channel, the squeeze has been released and a move is about to take place.
I have added more support indicators -- I highlight the bullish / bearish KC breaches (using GREEN/RED crosses) and a SAR to see where price action is trending.
Appreciate any feedback. Enjoy!
Color codes for v02:
----------------------------
When both the upper and lower Bollinger Bands go inside the Keltner Channel, the squeeze is on and is highlighted in RED.
When the Bollinger Bands (BOTH lines) start to come out of the Keltner Channel, the squeeze has been released and is highlighted in GREEN.
When one of the Bollinger Bands is out of Keltner Channel, no highlighting is done (this means, the background color shows up, so don't get confused if you have RED/GREEN in your chart's bground :))
Color codes for v01:
----------------------------
When both the upper and lower Bollinger Bands go inside the Keltner Channel, the squeeze is on and is highlighted in YELLOW.
When the Bollinger Bands (BOTH lines) start to come out of the Keltner Channel, the squeeze has been released and is highlighted in BLUE.
