Quantumvest - Auto LevelsAuthor: Arthur Wayne
Description: This script automatically plots levels according to Primetime Trading Academy guidelines.
Directions:
On the monthly chart, you should select two significant monthly support/resistance levels and input them into the script. It is recommended to mark these levels with the price label tool.
The script will then automatically plot 2 monthly 'wings' or additional monthly support/resistance levels above and below the original monthly high and low that are the same distance apart. Located half way in between the monthly levels, there will be weekly support/resistance levels. None of the values will go below 0. These levels should then be used on lower time-frames for technical analysis.
There is the option to customize the number of monthly wings, the width of the box surrounds the monthly s/r levels, the x-position of the level labels, as well as the colors for everything.
The biggest drawback is that levels will not save in between charts. This is a limitation of Pine Script and how TradingView does not offer the ability to create custom drawing tools, only indicators and strategies. This is why it is recommended to use the price label tool to keep track in between charts for different assets. Regardless, this script should make the process of drawing levels manually far more efficient than it was before.
Levels

TestedFX SR RADAR v3 (Support & Resistance Radar)TestedFX SR Radar is unlike any other Support and Resistance indicator I have seen to date. It doesn't just show you recent important pivots. Everyone with eyes can see those levels lol. You need an edge on the market. You need to know the levels AHEAD OF TIME. Trading is about having MORE and BETTER information than everyone else. Notice how the levels start BEFORE price touches those levels!!
How does TestedFX SR Radar do this?? Glad you asked.
Just like real radar, it searches within 5 ATR of the current price for strong pivots thousands of bars previous major pivots. But that is just the start. Then when a level is respected with a wick rejection a upvote is cast. When the level is busted a downvote is cast. The shading levels are based on the levels POWER as scored by the market voting on it. (Notice the purple dots at then end of the wicks that hit the level) Using this novel technique high probability pivot points are calculated IN ADVANCE so you know the important levels ahead of time.
Darker levels and multiple lines grouped together show strong S/R levels.
You can use this in combination with your favorite strategy. However, it was built to go with one of our private indicators. Typically good practice on TV is to include all functionality in one indicator. We tried to do that with this indicator but we couldn't because it uses too much CPU power. As it is if you change the SR Radar settings you will get "Script takes too long to execute" type errors. If that happens try hiding and showing the indicator again. If that doesn't work then reset your settings back to standard settings. The upside is that we are releasing this free to our tradingview friends.
I love this community and it is great to be able to give back. I really hope this helps you make better trading decisions. If so please let me know your experiences (good and bad) in the comments.
Sincerly,
Doug Collins
TestedFX

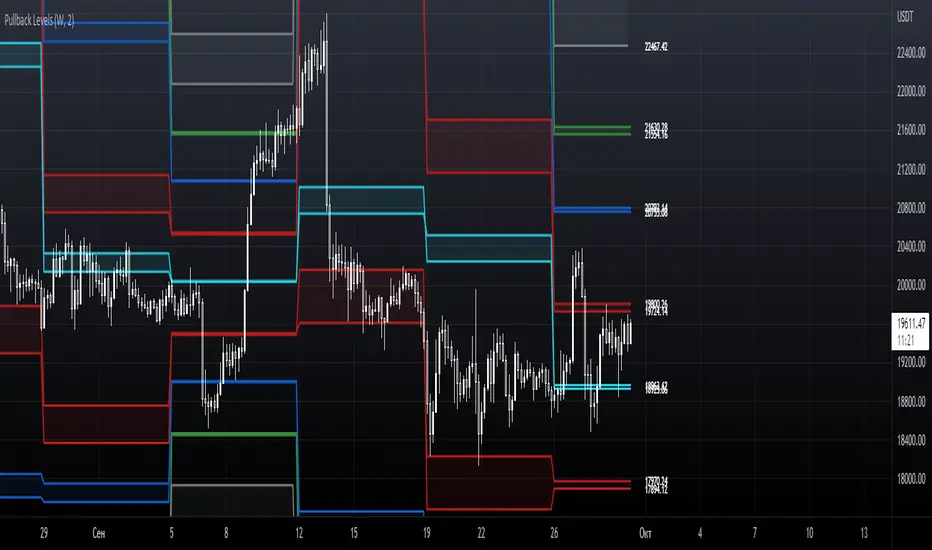
Pullback LevelsPullback Levels is a technical indicator for predicting large price movements by calculating support and resistance levels. It is used to determine the general market trend on different timeframes. Pullback levels are used when prices are built above or below them, indicating the priority direction of movement.
Analysis of support and resistance levels often coincides with the action levels of large players, similar to the analysis of a trend line. When analyzing Pullback levels, the first support and resistance levels are calculated using the width of the trading range and the volume traded during this period. The second support and resistance levels are calculated using the larger trading range width given the highs and lows.
It also provides the ability to flexibly adjust the levels, their visualization, style, calculation methods and the used timeframe. For the convenience of backtesting, all historical levels are saved on the chart. To analyze current price movements and determine pullbacks, all prices are displayed next to the levels.
-------------------------------------------
Pullback levels – технический индикатор для прогнозирования крупных ценовых движений путем расчета уровней поддержки и сопротивления . Используется для определения общего рыночного тренда на различных таймфреймах. Pullback levels используются при построение цены выше или ниже них, указывая на приоритетное направление движения.
Анализ уровней поддержки и сопротивления часто совпадает с уровнями действия крупных игроков, наподобие анализа трендовой линии. При анализе Pullback уровней первые уровни поддержки и сопротивления рассчитываются с использованием ширины торгового диапазона и объёмом проторгованным за этот период. Вторые уровни поддержки и сопротивления рассчитываются с использованием более старшей ширины торгового диапазона учитывая максимумы и минимумы.
Он так же предоставляет возможность гибкой настройки уровней - их визуальной составляющей, стиля, методов расчёта и используемого таймфрейма. Для удобства бэктестинга все исторические уровни сохраняются на графике. Для анализа текущих ценовых движений и определении точек разворота, все цены находятся рядом с уровнями.
Critical Levels by Time FrameDescription
This indicator will help you present critical levels from a certain time frame.
Purpose and Usage
Many day traders are using the previous day high, close and low, as critical levels in their trading. in order to easily present those levels on your chart, I created this indicator in which you can define which of those you would like to present on your chart.
You may choose the best time frame for your needs, I suggest using the daily time frame which is also the default time frame, but you can use the weekly time frame to present the critical levels from the previous week, or you can choose any other time frame you would like.
Pre-market and after-market prices will not be taken into consideration.
Restrict to current DAY
There is an option to present the critical levels only today.
if you’re looking at a wide range of bars and don’t wanna present the critical levels among the entire chart, you may use this restriction to show a cleaner chart.
Filtering critical levels
To present only one or two critical levels (and not all three of them) you may use the style settings. uncheck any critical level that you’re not interested in.
I hope you enjoy this indicator and find it useful,
if you do, please like the script , and feel free to comment below.
Good luck with your trading.
Important Level for the DayThis script will give 1 important level for the day. It has moving average of vwap as well as ema. User can define the period. An important input for the indicator is previous days range. There is a parameter of divisor in which user can define in how many parts he/she wants to divide the previous day. Recommended values are just 3 or 4 not more than that.
donchain support&resistance levels [LM]Hello Traders,
I would like to introduce you donchain support&resistance levels. The idea is to look for important levels that are identified by donchain line, where donchain usualy spents a lot of time without any move usualy turns out to be good level for bounces.
Also note that when there is a big spread between first line and second line it usually leads to some pullback.
Here you have an example of big spread:
You are also able to show donchain lines and not only horizontals this you can find in settings:
Enjoy!

Chart Champions - Part 1 - nPOC - Levels - VWAPsThank you for sparing you time to read my indicator.
This indicator has been created as a suite of 3. This was to ensure that those with only the Free Trading View account could benefit (with their restriction to 3 indicators). Please ensure you install each indicator and read each indicator write up to fully understand what has tried to achieved.
Chart Champions – Part 1 –Lvls nPOC VWAPS
This indicator is broken down into:
• Levels
• VWAPS
• Naked Point of Control
Levels
It displays the levels to the right of the price Axis to enable the user to have a cleaner chart.
The below levels will automatically appear:
dOpen – pdHigh – pdLow – pdEQ – pwEQ
Optional Levels include:
mOpen – pmOpen – pdOpen – dbyOpen – wOpen – pwOpen
VWAPs
Optional VWAPs
Daily (including pdVWAP close) – Weekly – Monthly
Naked Points of Control (nPOC)
To view the nPOC move the chart back in time to pick up the nPOCs.
Chart Champions – Part 2 – CCV IBs POC
This indicator is broken down into:
• Chart Champions Value
• Initial Balance
• Points of Control
Chart Champions Value (CCV)
CCV is based on the 80% rule of the dOpen opening outside of the pdVAH/pdVAL. Please do you own research to fully understand how this trading strategy works (readily avaliable online).
Initial Balance (IB)
IB is based on the first 60 minutes of the market opening. It captures the highest and lowest points within that 60 minutes. Please do you own research to fully understand how this trading strategy works (readily avaliable online).
Points of Control (POCs)
POC are the price levels where the most volume was traded.
Developing POC (dPOC) will constantly move with volume/price action through out the day.
Optional POCs
Previous Day POC (pdPOC) – Day Before Yesterday POC (dbyPOC)
Chart Champions – Part 3 – Sessions - Manual Input
This indicator is broken down into:
• Manual Inputs (daily, weekly, monthly)
• IGOR SessionsTtimes
• Pre + Market Openings
Manual Input
Daily x3
Weekly x 3
Monthly x 3
This allows the trader to put in specific levels.
IGOR Session Times
This is a user specific requirement to highlight cetain times during the day, displayed at the bottom of the chart in the colour strip.
Pre + Market Openings
This allows the user to see when pre market trading has started and with the live maket has started, displayed at the top of the chart in colours.
A huge thank you goes out to:
Stackoverflow users AnyDozer and Bjorn.
TV user ahancock for allow me use of this code.
Disclaimer the lower the timeframe the more information it processes.

[SK] Fibonacci Auto Trend ScouterThe FATS - Fibonacci Auto Trend Scouter automatically draws active trends from 2 different timeframes along with Fibonacci Support and Resistance levels. It also has a Sights feature for each timeframe which points from it's middle towards the current price. The tool is also highly customizable for you to take this indicator over 9000. If you like the tool and it adds value to you - share the love on the like button and visit my profile to check out my other indicators and subscribe, so you're notified of my next scripts and ideas!
Automatic Trend Lines
The indicator takes in 2 timeframes to detect High and Low values from which to draw the trend lines of each timeframe.
As the values change with price movement, the lines are updated. They are color coded for uptrend and downtrend based on the direction of each individual line. Trend lines can be set up to color with only the default value on the configurations panel.
- Toggle on/off Color Coded
- Change Default, Uptrend, Downtrend color
- Change Line Width
- Change Line Style
- Toggle on/off Line Extensions
- Change Extended Line Width
- Change Extended Line Style
- Toggle On/Off labels for 7 data points of each timeframe
Automatic Trend Sights
This is a neat feature that may help you get a better feel for the direction the current movement is heading towards in correlation with the short or medium length timeframe trends. The sight draws a line from the middle vertical point of the trend coordinates towards the current price. They are toggled off by default but can be enabled in the configurations panel.
- Toggle on/off sight on each timeframe
- Change Width
- Change Line Style
Automatic Fibonacci Levels
The tool has a very useful feature to automatically detect the highest and lowest value from the short timeframe to calculate Fibonacci support and resistant levels. To keep the chart area clean, the lines are drawn short by default towards the right side of the price but provide inputs to increase the size of the level lines towards the left and right direction. A triangle label appears to the side of each line which holds the Fibonacci level and price data inside the tooltip, hover over them to activate.
- Toggle on/off color coded
- Change Default, Resistance, Support colors
- Change line size towards the left and right side
- Change line width
- Change Resistance line style
- Change Support line style
- Toggle on/off High and Low source line
- Toggle on/off High and Low source labels

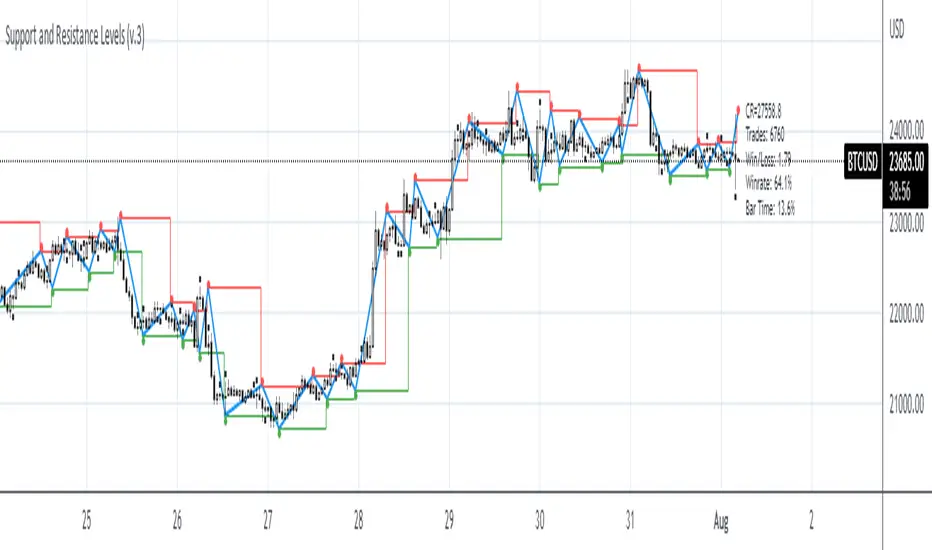
Support and Resistance Levels (v.3)Support and Resistance Levels augmanted and reprocessed
Description:
This is an augmented version of my earlier script that can be found here:
This time it features zigzag and channel lines, signal generation and filtering and performance testing. Signal generation and filtering procedures are used only for performance testing, not for the actual labelling. The labelling is governed by zigzag logic.
Delimited Levels Today SessionThis script takes a delimited string of level values (up to 12) and plots them on the chart as per parameters.
Alerts can be set up for crossing, etc, using the Alerts panel as per usual.
Very handy if you have a spreadsheet or list of values to plot.
For example, say your spreadsheet has a list of these 12 levels to plot:
3800
3811
3822
3837
3851
3862
3877
3887
3902
3913
3928
The values could be copied to notepad / text editor, and the line breaks replaced with a delimiter, such as the ';' character (note: no trailing delimiter), to produce a delimited string:
3800;3811;3822;3837;3851;3862;3877;3887;3902;3913;3928
And then simply copy / paste this delimited string into the "Levels Delimited String" parameter.
Note: This script builds upon earlier script:
Enhancements include:
- Plot only for latest day (weekends factored in)
- Plot only for specified session
- Plot as bands or as lines
NSDT Pre-Market Breakout LevelsA simple way to identify potential breakouts at the New York market open. This indicator plots the high and low of the New York Pre-Market, providing a great visual of a potential breakout levels.
Previous Period Levels - X Alerts====== ABOUT THIS INDICATOR
- A simple but highly customisable display of previous higher time-frame
OHLC values, drawn using line.new and label.new. Nothing fancy but...
- Customised resolution input which excludes time frames lower than 1 hour
while extending the common higher reference inputs to include:
• 6, and 12 Hour
• 5 Day
• 3, and 6 Month
• 1 Year
- Alert conditions using an adjustable SMA to help reduce false positive
spam.
- Full visual customisation options for (almost) every aspect, so it can be
tuned to suit most individual preferences.
- In line with the miriad visual customisation options is the ability to
change the display format of the Labels, to show more or less information,
or disable them altogether.
====== REASON FOR STUDY
- To practice advanced user input option handling to allow for a full visual
customisation experience without stepping outside of, or interfering with,
the intended function of the indicator.
- Provide reasonably clear code commenting and structure in order to be
useful as a potential learning aid for others, and future reference for
myself.
====== DISCLAIMER
Any trade decisions you make are entirely your own responsibility.
I've made an effort to squash all the bugs, but you never know!
NSDT Daily Key LevelsSimple script to show key levels of current day and previous day. Labels can be turned on and off as needed. Line colors, thickness and style can be changed. Modified the "M/W/D Level" script from paaax. Credit for original code goes to him. Link to script and profile posted in code of this script.

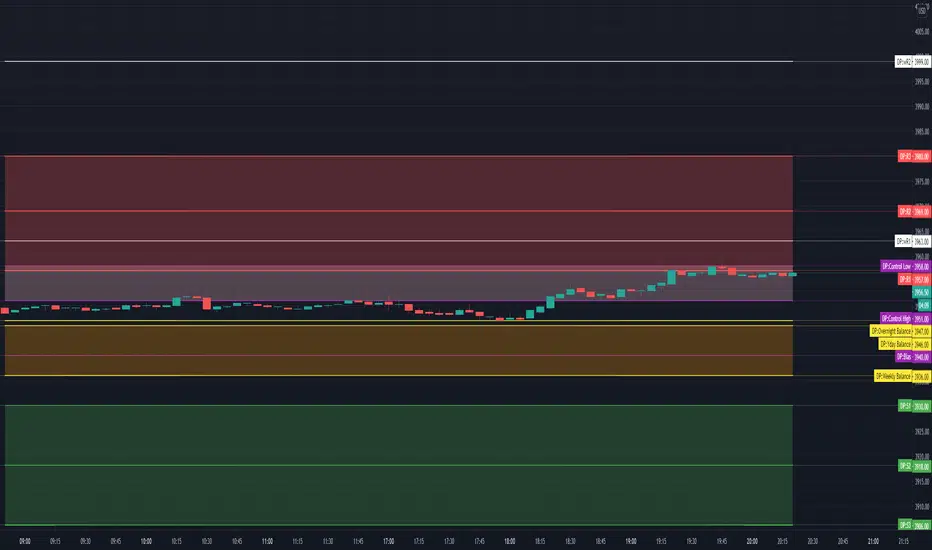
TV Day Plan Template 1This is a template for daytraders, swing traders, supply and demand traders, and even swing traders. As traders we are always scanning charts for levels and zones. This template makes it easy and convenient to find, change, and chart levels. As a daytrader, I will use this daily. I always have daily and weekly targets in mind. This will ensure I don't lose track of the bigger picture while trading the smaller moves. Levels in this chart are not auto calculated. They are manually input. This script is a quick and convenient way to chart multiple levels without having to go through each drawing, change the settings, and then redraw the level. Currently this will only save levels for one ticker. A workaround is to use multiple instances and then hide the ones not in use. Another way is to use the second part to this script, Day Plan Levels Template 2. If only using one instance, you can save the levels as default. This will save them. However, if saving levels as default while using multiple instances of this indicator, the other levels will erase. The way that I use this that I have daily levels for #ES in one instance and then daily levels for #NQ in another instance.
This script is very customizable
Options include
On/Off Toggles
Light/Heavy Versions - Light versions does not plot. Heavy version will plot and show levels in info bar and price axis
Balance Levels
Control Levels
3 Support and 3 Resistance levels for daily and weekly
2 Support and 2 Resistance Clouds
Balance and Control Clouds
"0" value disables and hides levels
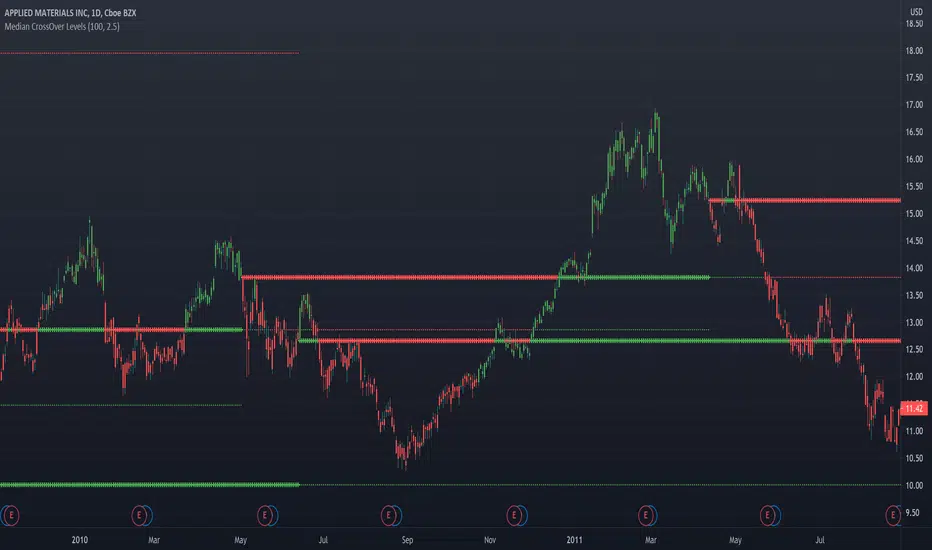
Median CrossOver LevelsPlots levels representing the prices that the stock closed above its n-period moving median(default=100).
2 thickest lines represents the two most recent crossover levels.
Candles are colored green if the price is currently above its moving median and red if below.
Previous OHLCThe scripts places horizontal levels on your charts indicating the previous Daily, Weekly or Monthly OHLC values over the current timeframe.
Slightly modified version of Nanda86's "Previous OHLC" script. I corrected a couple of bugs and added more control over colors and labels in general. I also removed the hourly OHLCs.

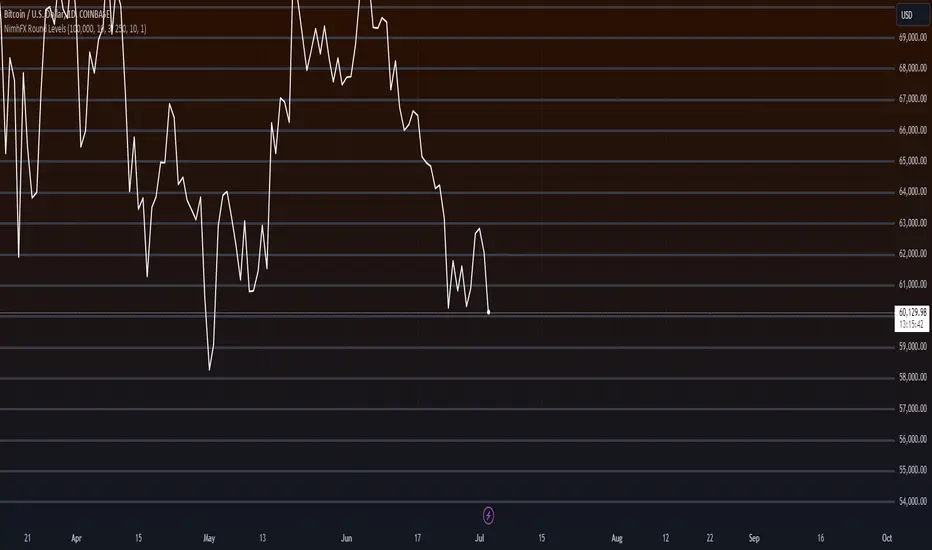
NimhFX Grid LevelsA simple levels indicator for plotting pre-defined price grid.
The default setting is as follows:
Group 1 shows 1000 Point (100 Pip divisions)
Group 2 shows 250 Point (25 Pip divisions)
Groups are duplications of each other to allow multiple divisions to be visible at once, e.g. 100 Pip grid and a 25 pip grid with differing visuals as the default setting.
Number of Lines above/below will alter the amount of lines drawn, change as required, note: Tradingview seems to try to capture all drawings when double-clicking the right price index which can cause this to compress the data.
depending on preferred timeframe you may want to alter this for example to a 10 pip grid (100 point)
Levels (Nephew_Sam_)Initial Commit.
1. Plots Asian Range based on time provided
- option to extend line to end of day
- option to fill range with background
2. Plots significant highs/low using fractals
3. Plot Daily/Weekly/Monthly OHLC

RK's 13 - Moving Average with Fibonacci Lines█ OVERVIEW
After some chart measures, I noticed that if we took the difference between fast and slow Moving Average lines and apply the Fibonacci ratios, we get a very reliable support and resistance level for each bar.
So, I made this script to help me (and anyone who wants to use it) know where we should close or put stops in our orders.
█ HOW TO USE IT:
Choose your preferred Moving Average type and Lengths;
Select the Fibonacci Ratios and test Reverse Lines option to get better levels.
Other useful input options:
Show Labels: Display every Fibonacci Ratio you are using;
Labels Offset Position: Place where the Fibonacci Ratio will appear and get the price in that position;
Project Moving Average Lines in the Future: Draws project Line in the chart.
Tips:
• If you put your mouse in the ratio label, it will show the price in that position
• This script works better when the lines are well apart.

Quamt - ShowerheadSupport and Resistance levels based off of Volume based off of multiple timeframes and if you want then you may choose another ticker altogether.
When price closes at which ever level, it'll probably go up if support and down if resistance. If it closes below/above each level then continuation is more likely.
The colors flip depending on if above or below each level
To deal with scaling issues with certain levels, choose how close each level must be to price with the "Percentage Threshold," input.

[ST] S/R density study v3This algorithm draws supports/resistance levels automatically based on historic candle density at each height. The basic idea is the levels where price is rejected quickly is likely to have fewer candles in the past than the levels above and below. This does not take volume into account. The lookback and number of levels has to be kept low to prevent too many calculations. I haven't looked if there's new pinescript features to let me do this more efficiently yet.
It checks for candle density to decrease once or twice and then increase once or twice before it draws a line at that lowest level. There's an option to draw more lines by only checking for a single decrease and increase.
It likely won't catch all the levels but it seems to get a good amount to help me position stops on other side of S/R or exits on the trade side of S/R.
I've been meaning to share more scripts but keep forgetting. Keeping my scripts free but feel free to like or tip haha.

Reditum ScanReditum Scan allows you to synchronize the Market Profile Points of Control (POC) in different time intervals to a single graph.
Components of Reditum Scan:
POC's (30 min, 60 min, 120 min, 240 min, daily)
How does it work?
The algorithm allows you to identify areas of strong support and resistance, based on where most of the trading activity takes place.
What are the strategies for considering placing a trade?
1.Cluster (agglomeration of multiple POC's) to cluster (by identifying two clusters, the price could go smoothly from one Cluster to the other).
2. From cluster (agglomeration of multiple POCs, each with unique color. Now, from this cluster important movements may begin).
3. Towards a cluster (like the “from cluster” pattern, we identify areas of high interest for institutional companies, in this pattern the cluster acts like a magnet, if price is near it may be fully attracted towards the agglomeration).
If you are a member of the mastermind tribe please contact the support team within the tribe to access the indicator (do not leave personal or subscription data in the comments on this page), if not, please visit the link located in our signature.
Thanks for taking a look!
----------------------------------------------------------------------------------------------------------------------------------------------------------------------------------------------------------------------------------
Reditum Scan permite sincronizar los puntos de control (POC) de los perfiles de mercado en varios intervalos de tiempo en una sola gráfica.
Componentes de Reditum Scan:
POC´s (30 min, 60 min, 120 min, 240 min, diario)
¿Cómo funciona?
El algoritmo le permite identificar áreas de fuerte soporte y resistencia, según el lugar donde se lleva a cabo la mayor parte de la actividad comercial.
¿Cuáles son las estrategias para considerar una entrada?
1.Cluster (aglomeración de múltiples POC´s) a cluster (al identificar dos cluster el precio podría ir con fluidez desde uno al otro que lo recibe).
2.Desde cluster (lo identificamos con la aglomeración de múltiples POC identificados con colores que hacen fácil la lectura. Ahora, desde este cluster podrían iniciar movimientos importantes).
3.Hacia cluster (al igual que el patrón “desde cluster” identificamos zonas de alto interés para los institucionales, en este patrón el cluster actúa como un imán para el precio, de modo que cuando el precio está lejos de él, lo podría atraer con fuerza).
Para acceder a la herramienta, si usted es miembro de la tribu mastermind por favor comunicarse con el equipo de soporte dentro de la tribu (no dejar datos personales ni de suscripción en los comentarios de esta página), si no es miembro por favor visite el enlace a continuación en nuestra Firma.
Gracias por echarle un vistazo!.

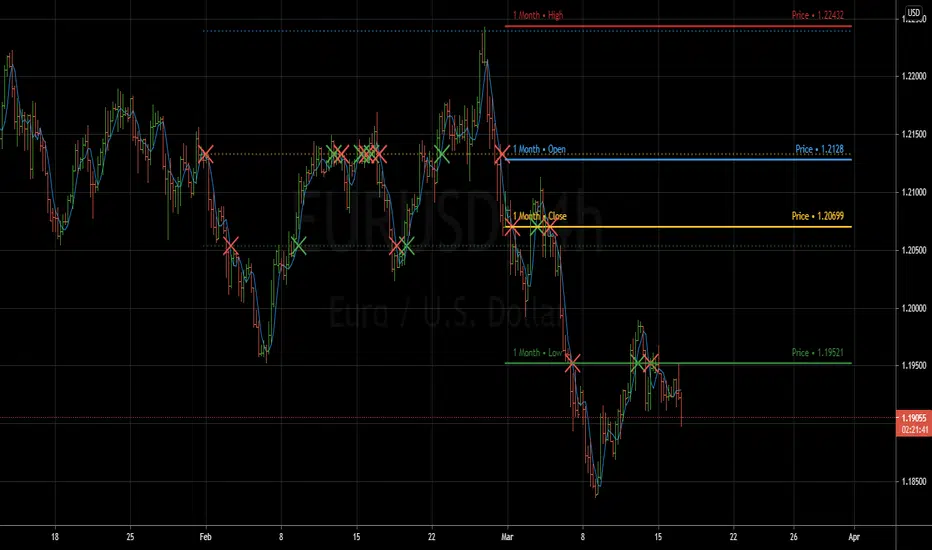
Key Levels TheHuntThis indicator is made to show you some key levels on the chart on the different timeframes. You can hide them or show them in the settings. The levels are the Monthly Weekly and Daily opens, current monthly, weekly and daily high / low, last weeks high / low & last daily high / low as well as Monday high and low. These levels can be used as key pivots or key liquidity areas. You can also adjust the time to also use the correct Mon range for forex pairs.
As you can see on the chart, that is how the levels show up on the chart.
