Gyspy Bot Trade Engine - V1.2B - Strategy 12-7-25 - SignalLynxGypsy Bot Trade Engine (MK6 V1.2B) - Ultimate Strategy & Backtest
Brought to you by Signal Lynx | Automation for the Night-Shift Nation 🌙
1. Executive Summary & Architecture
Gypsy Bot (MK6 V1.2B) is not merely a strategy; it is a massive, modular Trade Engine built specifically for the TradingView Pine Script environment. While most strategies rely on a single dominant indicator (like an RSI cross or a MACD flip) to generate signals, Gypsy Bot functions as a sophisticated Consensus Algorithm.
The engine calculates data from up to 12 distinct Technical Analysis Modules simultaneously on every bar closing. It aggregates these signals into a "Vote Count" and only executes a trade entry when a user-defined threshold of concurring signals is met. This "Voting System" acts as a noise filter, requiring multiple independent mathematical models—ranging from volume flow and momentum to cyclical harmonics and trend strength—to agree on market direction before capital is committed.
Beyond entries, Gypsy Bot features a proprietary Risk Management suite called the Dump Protection Team (DPT). This logic layer operates independently of the entry modules, specifically scanning for "Moon" (Parabolic) or "Nuke" (Crash) volatility events to force-exit positions, overriding standard stops to preserve capital during Black Swan events.
2. ⚠️ The Philosophy of "Curve Fitting" (Must Read)
One must be careful when applying Gypsy Bot to new pairs or charts.
To be fully transparent: Gypsy Bot is, by definition, a very advanced curve-fitting engine. Because it grants the user granular control over 12 modules, dozens of thresholds, and specific voting requirements, it is extremely easy to "over-fit" the data. You can easily toggle switches until the backtest shows a 100% win rate, only to have the strategy fail immediately in live markets because it was tuned to historical noise rather than market structure.
To use this engine successfully, you must adopt a specific optimization mindset:
Ignore Raw Net Profit: Do not tune for the highest dollar amount. A strategy that makes $1M in the backtest but has a 40% drawdown is useless.
Prioritize Stability: Look for a high Profit Factor (1.5+), a high Percent Profitable, and a smooth equity curve.
Regular Maintenance is Mandatory: Markets shift regimes (e.g., from Bull Trend to Crab Range). Parameters that worked perfectly in 2021 may fail in 2024. Gypsy Bot settings should be reviewed and adjusted at regular intervals (e.g., quarterly) to ensure the voting logic remains aligned with current market volatility.
Timeframe Recommendations:
Gypsy Bot is optimized for High Time Frame (HTF) trend following. It generally produces the most reliable results on charts ranging from 1-Hour to 12-Hours, with the 4-Hour timeframe historically serving as the "sweet spot" for most major cryptocurrency assets.
3. The Voting Mechanism: How Entries Are Generated
The heart of the Gypsy Bot engine is the ActivateOrders input (found in the "Order Signal Modifier" settings).
The engine constantly monitors the output of all enabled Modules.
Long Votes: GoLongCount
Short Votes: GoShortCount
If you have 10 Modules enabled, and you set ActivateOrders to 7:
The engine will ONLY trigger a Buy Entry if 7 or more modules return a valid "Buy" signal on the same closed candle.
If only 6 modules agree, the trade is rejected.
This allows you to mix "Leading" indicators (Oscillators) with "Lagging" indicators (Moving Averages) to create a high-probability entry signal that requires momentum, volume, and trend to all be in alignment.
4. Technical Deep Dive: The 12 Modules
Gypsy Bot allows you to toggle the following modules On/Off individually to suit the asset you are trading.
Module 1: Modified Slope Angle (MSA)
Logic: Calculates the geometric angle of a moving average relative to the timeline.
Function: It filters out "lazy" trends. A trend is only considered valid if the slope exceeds a specific steepness threshold. This helps avoid entering trades during weak drifts that often precede a reversal.
Module 2: Correlation Trend Indicator (CTI)
Logic: Based on John Ehlers' work, this measures how closely the current price action correlates to a straight line (a perfect trend).
Function: It outputs a confidence score (-1 to 1). Gypsy Bot uses this to ensure that we are not just moving up, but moving up with high statistical correlation, reducing fake-outs.
Module 3: Ehlers Roofing Filter
Logic: A sophisticated spectral filter that combines a High-Pass filter (to remove long-term drift) with a Super Smoother (to remove high-frequency noise).
Function: It attempts to isolate the "Roof" of the price action. It is excellent at catching cyclical turning points before standard moving averages react.
Module 4: Forecast Oscillator
Logic: Uses Linear Regression forecasting to predict where price "should" be relative to where it is.
Function: When the Forecast Oscillator crosses its zero line, it indicates that the regression trend has flipped. We offer both "Aggressive" and "Conservative" calculation modes for this module.
Module 5: Chandelier ATR Stop
Logic: A volatility-based trend follower that hangs a "leash" (ATR multiple) from the highest high (for longs) or lowest low (for shorts).
Function: Used here as an entry filter. If price is above the Chandelier line, the trend is Bullish. It also includes a "Bull/Bear Qualifier" check to ensure structural support.
Module 6: Crypto Market Breadth (CMB)
Logic: This is a macro-filter. It pulls data from multiple major tickers (BTC, ETH, and Perpetual Contracts) across different exchanges.
Function: It calculates a "Market Health" percentage. If Bitcoin is rising but the rest of the market is dumping, this module can veto a trade, ensuring you don't buy into a "fake" rally driven by a single asset.
Module 7: Directional Index Convergence (DIC)
Logic: Analyzes the convergence/divergence between Fast and Slow Directional Movement indices.
Function: Identifies when trend strength is expanding. A buy signal is generated only when the positive directional movement overpowers the negative movement with expanding momentum.
Module 8: Market Thrust Indicator (MTI)
Logic: A volume-weighted breadth indicator. It uses Advance/Decline data and Up/Down Volume data.
Function: This is one of the most powerful modules. It confirms that price movement is supported by actual volume flow. We recommend using the "SSMA" (Super Smoother) MA Type for the cleanest signals on the 4H chart.
Module 9: Simple Ichimoku Cloud
Logic: Traditional Japanese trend analysis using the Tenkan-sen and Kijun-sen.
Function: Checks for a "Kumo Breakout." Price must be fully above the Cloud (for longs) or below it (for shorts). This is a classic "trend confirmation" module.
Module 10: Simple Harmonic Oscillator
Logic: Analyzes the harmonic wave properties of price action to detect cyclical tops and bottoms.
Function: Serves as a counter-trend or early-reversal detector. It tries to identify when a cycle has bottomed out (for buys) or topped out (for sells) before the main trend indicators catch up.
Module 11: HSRS Compression / Super AO
Logic: Two options in one.
HSRS: Hirashima Sugita Resistance Support. Detects volatility compression (squeezes) relative to dynamic support/resistance bands.
Super AO: A combination of the Awesome Oscillator and SuperTrend logic.
Function: Great for catching explosive moves that result from periods of low volatility (consolidation).
Module 12: Fisher Transform (MTF)
Logic: Converts price data into a Gaussian normal distribution.
Function: Identifies extreme price deviations. This module uses Multi-Timeframe (MTF) logic to look at higher-timeframe trends (e.g., looking at the Daily Fisher while trading the 4H chart) to ensure you aren't trading against the major trend.
5. Global Inhibitors (The Veto Power)
Even if 12 out of 12 modules vote "Buy," Gypsy Bot performs a final safety check using Global Inhibitors. If any of these are triggered, the trade is blocked.
Bitcoin Halving Logic:
Hardcoded dates for past and projected future Bitcoin halvings (up to 2040).
Trading is inhibited or restricted during the chaotic weeks immediately surrounding a Halving event to avoid volatility crushes.
Miner Capitulation:
Uses Hash Rate Ribbons (Moving averages of Hash Rate).
If miners are capitulating (Shutting down rigs due to unprofitability), the engine flags a "Bearish" regime and can flip logic to Short-only or flat.
ADX Filter (Flat Market Protocol):
If the Average Directional Index (ADX) is below a specific threshold (e.g., 20), the market is deemed "Flat/Choppy." The bot will refuse to open trend-following trades in a flat market.
CryptoCap Trend:
Checks the total Crypto Market Cap chart. If the broad market is in a downtrend, it can inhibit Long entries on individual altcoins.
6. Risk Management & The Dump Protection Team (DPT)
Gypsy Bot separates "Entry Logic" from "Risk Management Logic."
Dump Protection Team (DPT)
This is a specialized logic branch designed to save the account during Black Swan events.
Nuke Protection: If the DPT detects a volatility signature consistent with a flash crash, it overrides all other logic and forces an immediate exit.
Moon Protection: If a parabolic pump is detected that violates statistical probability (Bollinger deviations), DPT can force a profit take before the inevitable correction.
Advanced Adaptive Trailing Stop (AATS)
Unlike a static trailing stop (e.g., "trail by 5%"), AATS is dynamic.
Penthouse Level: If price is at the top of the HSRS channel (High Volatility), the stop loosens to allow for wicks.
Dungeon Level: If price is compressed at the bottom, the stop tightens to protect capital.
Staged Take Profits
TP1: Scalp a portion (e.g., 10%) to cover fees and secure a win.
TP2: Take the bulk of profit.
TP3: Leave a "Runner" position with a loose trailing stop to catch "Moon" moves.
7. Recommended Setup Guide
When applying Gypsy Bot to a new chart, follow this sequence:
Set Timeframe: 4 Hours (4H).
Reset: Turn OFF Trailing Stop, Stop Loss, and Take Profits. (We want to see raw entry performance first).
Tune DPT: Adjust "Dump/Moon Protection" inputs first. These have the highest impact on net performance.
Tune Module 8 (MTI): This module is a heavy filter. Experiment with the MA Type (SSMA is recommended).
Select Modules: Enable/Disable modules 1-12 based on the asset's personality (Trending vs. Ranging).
Voting Threshold: Adjust ActivateOrders. A lower number = More Trades (Aggressive). A higher number = Fewer, higher conviction trades (Conservative).
Final Polish: Re-enable Stop Losses, Trailing Stops, and Staged Take Profits to smooth the equity curve and define your max risk per trade.
8. Technical Specs
Engine Version: Pine Script V6
Repainting: This strategy uses Closed Candle data for all Risk Management and Entry decisions. This ensures that Backtest results align closely with real-time behavior (no repainting of historical signals).
Alerts: This script generates Strategy alerts. If you require visual-only alerts, see the source code header for instructions on switching to "Study" (Indicator) mode.
Disclaimer:
This script is a complex algorithmic tool for market analysis. Past performance is not indicative of future results. Use this tool to assist your own decision-making, not to replace it.
9. About Signal Lynx
Automation for the Night-Shift Nation 🌙
Signal Lynx focuses on helping traders and developers bridge the gap between indicator logic and real-world automation. The same RM engine you see here powers multiple internal systems and templates, including other public scripts like the Super-AO Strategy with Advanced Risk Management.
We provide this code open source under the Mozilla Public License 2.0 (MPL-2.0) to:
Demonstrate how Adaptive Logic and structured Risk Management can outperform static, one-layer indicators
Give Pine Script users a battle-tested RM backbone they can reuse, remix, and extend
If you are looking to automate your TradingView strategies, route signals to exchanges, or simply want safer, smarter strategy structures, please keep Signal Lynx in your search.
License: Mozilla Public License 2.0 (Open Source).
If you make beneficial modifications, please consider releasing them back to the community so everyone can benefit.
M-oscillator

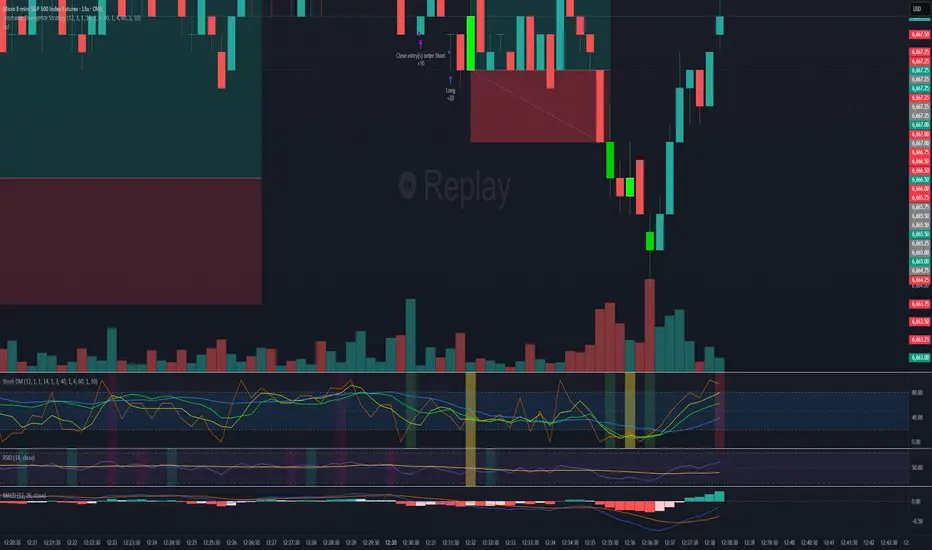
Momentum Reversal / Dip Buyer [Score Based]Strategy Overview
Momentum Reversal / Dip Buyer is a quantitative reversal engine designed to fade stretched moves and buy dips / sell rallies when multiple momentum and context factors line up. It’s built for liquid instruments especially for ticker CME_MINI:ES1! and works best on intraday timeframes like the 5-minute or 1-minute chart.
Core Logic
This strategy builds a composite Momentum Score by combining:
Price Location: Relative to 100 SMA, 1000 EMA, and VWAP (trend / regime filter).
RSI: Overbought/oversold and mid-zone strength.
VWMO (Volume-Weighted Momentum): Direction and strength of volume-weighted price drift.
ADX: Trend strength filter (high vs low trend environment).
Full Stoch (%K): Short-term exhaustion and mean-reversion context.
CCI: Overbought/oversold turns (key trigger).
MFI: Volume-confirmed buying/selling pressure.
ATR Regime: High vs low volatility environment.
Cumulative Delta: Whether net aggressor flow is rising or falling.
From this, a single Momentum Score is computed each bar:
Longs: Taken when the score is depressed (scoreLow) and CCI crosses up from oversold.
Shorts: Taken when the score is elevated (scoreHigh) and CCI crosses down from overbought.
Risk Management & Trade Logic
Max Daily Trades: Hard cap on entries per day.
Hard Stop: Fixed % stop based on entry price.
Profit Target: Target ATR Multiplier × main ATR from entry.
Breakeven Logic: Optional; moves stop to breakeven (plus optional offset) after price moves a configurable multiple of the main ATR in your favor.
Trailing Stop (Separate ATR): Optional; uses its own ATR length and ATR-based trigger and distance. This lets you run slower ATR for targets while using a tighter, more reactive ATR for the trail.
Session Control
Trading Window: Optional session filter (e.g., 09:30–16:00). Entries are only allowed inside the defined window.
Force Flat at Session End: Option to automatically close all open positions when the session ends.
Visuals
The script plots entry arrows and a compact dashboard displaying: current Momentum Score, daily trade usage, and CCI status.
Disclaimer:
This script is for educational and research purposes only and is not financial advice. Past performance does not guarantee future results. Always forward-test and adjust parameters to your own risk tolerance and market.
Shoutout and all credit goes to AuclairsCapital for building the base foundation of this strategy on ThinkScript


The Oracle: Dip & Top Adaptive Sniper [Hakan Yorganci]█ OVERVIEW
The Oracle: Dip & Top Adaptive Sniper is a precision-focused trend trading strategy designed to solve the biggest problem in swing trading: Timing.
Most trend-following strategies chase price ("FOMO"), buying when the asset is already overextended. The Oracle takes a different approach. It adopts a "Sniper" mentality: it identifies a strong macro trend but patiently waits for a Mean Reversion (pullback) to execute an entry at a discounted price.
By combining the structural strength of Moving Averages (SMA 50/200) with the momentum precision of RSI and the volatility filtering of ADX, this script filters out noise and targets high-probability setups.
█ HOW IT WORKS
This strategy operates on a strictly algorithmic protocol known as "The Yorganci Protocol," which involves three distinct phases: Filter, Target, and Execute.
1. The Macro Filter (Trend Identification)
* SMA 200 Rule: By default, the strategy only scans for buy signals when the price is trading above the 200-period Simple Moving Average. This ensures we are always trading in the direction of the long-term bull market.
* Adaptive Switch: A new feature allows users to toggle the Only Buy Above SMA 200? filter OFF. This enables the strategy to hunt for oversold bounces (dead cat bounces) even during bearish or neutral market structures.
2. The Volatility Filter (ADX Integration)
* Sideways Protection: One of the main weaknesses of moving average strategies is "whipsaw" losses during choppy, ranging markets.
* Solution: The Oracle utilizes the ADX (Average Directional Index). It will BLOCK any trade entry if the ADX is below the threshold (Default: 20). This ensures capital is only deployed when a genuine trend is present.
3. The Sniper Entry (Buying the Dip)
* Instead of buying on breakout strength (e.g., RSI > 60), The Oracle waits for the RSI Moving Average to dip into the "Value Zone" (Default: 45) and cross back up. This technique allows for tighter stops and higher Risk/Reward ratios compared to traditional breakout systems.
█ EXIT STRATEGY
The Oracle employs a dynamic dual-exit mechanism to maximize gains and protect capital:
* Take Profit (The Peak): The strategy monitors RSI heat. When the RSI Moving Average breaches the Overbought Threshold (Default: 75), it signals a "Take Profit", securing gains near the local top before a potential reversal.
* Stop Loss (Trend Invalidated): If the market structure fails and the price closes below the 50-period SMA, the position is immediately closed to prevent deep drawdowns.
█ SETTINGS & CONFIGURATION
* Moving Averages: Fully customizable lengths for Support (SMA 50) and Trend (SMA 200).
* Trend Filter: Checkbox to enable/disable the "Bull Market Only" rule.
* RSI Thresholds:
* Sniper Buy Level: Adjustable (Default: 45). Lower values = Deeper dips, fewer trades.
* Peak Sell Level: Adjustable (Default: 75). Higher values = Longer holds, potentially higher profit.
* ADX Filter: Checkbox to enable/disable volatility filtering.
█ BEST PRACTICES
* Timeframe: Designed primarily for 4H (4-Hour) charts for swing trading. It can also be used on 1H for more frequent signals.
* Assets: Highly effective on trending assets such as Bitcoin (BTC), Ethereum (ETH), and high-volume Altcoins.
* Risk Warning: This strategy is designed for "Long Only" spot or leverage trading. Always use proper risk management.
█ CREDITS
* Original Concept: Inspired by the foundational work of Murat Besiroglu (@muratkbesiroglu).
* Algorithm Development & Enhancements: Developed by Hakan Yorganci (@hknyrgnc).
* Modifications include: Integration of ADX filters, Mean Reversion entry logic (RSI Dip), and Dynamic Peak Profit taking.


Super-AO with Risk Management Strategy Template - 11-29-25Super-AO Strategy with Advanced Risk Management Template
Signal Lynx | Free Scripts supporting Automation for the Night-Shift Nation 🌙
1. Overview
Welcome to the Super-AO Strategy. This is more than just a buy/sell indicator; it is a complete, open-source Risk Management (RM) Template designed for the Pine Script community.
At its core, this script implements a robust swing-trading strategy combining the SuperTrend (for macro direction) and the Awesome Oscillator (for momentum). However, the real power lies under the hood: a custom-built Risk Management Engine that handles trade states, prevents repainting, and manages complex exit conditions like Staged Take Profits and Advanced Adaptive Trailing Stops (AATS).
We are releasing this code to help traders transition from simple indicators to professional-grade strategy structures.
2. Quick Action Guide (TL;DR)
Best Timeframe: 4 Hours (H4) and above. Designed for Swing Trading.
Best Assets: "Well-behaved" assets with clear liquidity (Major Forex pairs, BTC, ETH, Indices).
Strategy Type: Trend Following + Momentum Confirmation.
Key Feature: The Risk Management Engine is modular. You can strip out the "Super-AO" logic and insert your own strategy logic into the template easily.
Repainting: Strictly Non-Repainting. The engine calculates logic based on confirmed candle closes.
3. Detailed Report: How It Works
A. The Strategy Logic: Super-AO
The entry logic is based on the convergence of two classic indicators:
SuperTrend: Determines the overall trend bias (Green/Red).
Awesome Oscillator (AO): Measures market momentum.
The Signal:
LONG (+2): SuperTrend is Green AND AO is above the Zero Line AND AO is Rising.
SHORT (-2): SuperTrend is Red AND AO is below the Zero Line AND AO is Falling.
By requiring momentum to agree with the trend, this system filters out many false signals found in ranging markets.
B. The Risk Management (RM) Engine
This script features a proprietary State Machine designed by Signal Lynx. Unlike standard strategies that simply fire orders, this engine separates the Signal from the Execution.
Logic Injection: The engine listens for a specific integer signal: +2 (Buy) or -2 (Sell). This makes the code a Template. You can delete the Super-AO section, write your own logic, and simply pass a +2 or -2 to the RM_EngineInput variable. The engine handles the rest.
Trade States: The engine tracks the state of the trade (Entry, In-Trade, Exiting) to prevent signal spamming.
Aggressive vs. Conservative:
Conservative Mode: Waits for a full trend reversal before taking a new trade.
Aggressive Mode: Allows for re-entries if the trend is strong and valid conditions present themselves again (Pyramiding Type 1).
C. Advanced Exit Protocols
The strategy does not rely on a single exit point. It employs a "Layered Defense" approach:
Hard Stop Loss: A fixed percentage safety net.
Staged Take Profits (Scaling Out): The script allows you to set 3 distinct Take Profit levels. For example, you can close 10% of your position at TP1, 10% at TP2, and let the remaining 80% ride the trend.
Trailing Stop: A standard percentage-based trailer.
Advanced Adaptive Trailing Stop (AATS): This is a highly sophisticated volatility stop. It calculates market structure using Hirashima Sugita (HSRS) levels and Bollinger Bands to determine the "floor" and "ceiling" of price action.
If volatility is high: The stop loosens to prevent wicking out.
If volatility is low: The stop tightens to protect profit.
D. Repainting Protection
Many Pine Script strategies look great in backtesting but fail in live trading because they rely on "real-time" price data that disappears when the candle closes.
This Risk Management engine explicitly pulls data from the previous candle close (close , high , low ) for its calculations. This ensures that the backtest results you see match the reality of live execution.
4. For Developers & Modders
We encourage you to tear this code apart!
Look for the section titled // Super-AO Strategy Logic.
Replace that block with your own RSI, MACD, or Price Action logic.
Ensure your logic outputs a 2 for Buy and -2 for Sell.
Connect it to RM_EngineInput.
You now have a fully functioning Risk Management system for your custom strategy.
5. About Signal Lynx
Automation for the Night-Shift Nation 🌙
This code has been in action since 2022 and is a known performer in PineScript v5. We provide this open source to help the community build better, safer automated systems.
If you are looking to automate your strategies, please take a look at Signal Lynx in your search.
License: Mozilla Public License 2.0 (Open Source). If you make beneficial modifications, please release them back to the community!

KAMA Flip strategyI built this strategy because I wanted something that doesn’t overcomplicate trading.
No 20 indicators, no guessing, no “maybe I should close here.”
Just a clear momentum flip, a defined stop, and a defined take profit. (for me on 1D BTC chart it works best with 6% stoploss and 3% takeprofit, lookback should be 40, everything else standard)
The idea is simple: when momentum shifts, I want to be on the right side of it.
KAMA is good for this because it speeds up when the market moves and slows down when it doesn’t.
I normalize it so it becomes a clean zero-line oscillator.
Above zero means momentum is turning up. Below zero means it’s turning down.
That’s the entire entry logic. A flip is a flip.
The exit logic is just as simple: one stop loss, one take profit, both fixed percentages from the entry.
The position closes 100% at the target or the stop. No scaling in, no scaling out, no trailing.
It’s straightforward and easy to analyze because every trade has the exact same structure.
I originally made this for BTC on the daily chart, but nothing stops you from trying it on other charts.
If you want it only to go long, only to go short, or take both sides, you can set that.
All the KAMA parameters are open so you can play with how reactive the signal is.
The visuals and SL/TP lines can be turned on or off depending on how clean you want your chart.
This isn’t financial advice. It’s just a system I like because it’s simple, objective, and does exactly what it’s supposed to do.
Test it, adjust it, break it, rebuild it — do whatever fits your own approach.

Third eye • StrategyThird eye • Strategy – User Guide
1. Idea & Concept
Third eye • Strategy combines three things into one system:
Ichimoku Cloud – to define market regime and support/resistance.
Moving Average (trend filter) – to trade only in the dominant direction.
CCI (Commodity Channel Index) – to generate precise entry signals on momentum breakouts.
The script is a strategy, not an indicator: it can backtest entries, exits, SL, TP and BreakEven logic automatically.
2. Indicators Used
2.1 Ichimoku
Standard Ichimoku settings (by default 9/26/52/26) are used:
Conversion Line (Tenkan-sen)
Base Line (Kijun-sen)
Leading Span A & B (Kumo Cloud)
Lagging Span is calculated but hidden from the chart (for visual simplicity).
From the cloud we derive:
kumoTop – top of the cloud under current price.
kumoBottom – bottom of the cloud under current price.
Flags:
is_above_kumo – price above the cloud.
is_below_kumo – price below the cloud.
is_in_kumo – price inside the cloud.
These conditions are used as trend / regime filters and for stop-loss & trailing stops.
2.2 Moving Average
You can optionally display and use a trend MA:
Types: SMA, EMA, DEMA, WMA
Length: configurable (default 200)
Source: default close
Filter idea:
If MA Direction Filter is ON:
When Close > MA → strategy allows only Long signals.
When Close < MA → strategy allows only Short signals.
The MA is plotted on the chart (if enabled).
2.3 CCI & Panel
The CCI (Commodity Channel Index) is used for entry timing:
CCI length and source are configurable (default length 20, source hlc3).
Two thresholds:
CCI Upper Threshold (Long) – default +100
CCI Lower Threshold (Short) – default –100
Signals:
Long signal:
CCI crosses up through the upper threshold
cci_val < upper_threshold and cci_val > upper_threshold
Short signal:
CCI crosses down through the lower threshold
cci_val > lower_threshold and cci_val < lower_threshold
There is a panel (table) in the bottom-right corner:
Shows current CCI value.
Shows filter status as colored dots:
Green = filter enabled and passed.
Red = filter enabled and blocking trades.
Gray = filter is disabled.
Filters shown in the panel:
Ichimoku Cloud filter (Long/Short)
Ichimoku Lines filter (Conversion/Base vs Cloud)
MA Direction filter
3. Filters & Trade Direction
All filters can be turned ON/OFF independently.
3.1 Ichimoku Cloud Filter
Purpose: trade only when price is clearly above or below the Kumo.
Long Cloud Filter (Use Ichimoku Cloud Filter) – when enabled:
Long trades only if close > cloud top.
Short Cloud Filter – when enabled:
Short trades only if close < cloud bottom.
If the cloud filter is disabled, this condition is ignored.
3.2 Ichimoku Lines Above/Below Cloud
Purpose: stronger trend confirmation: Ichimoku lines should also be on the “correct” side of the cloud.
Long Lines Filter:
Long allowed only if Conversion Line and Base Line are both above the cloud.
Short Lines Filter:
Short allowed only if both lines are below the cloud.
If this filter is OFF, the conditions are not checked.
3.3 MA Direction Filter
As described above:
When ON:
Close > MA → only Longs.
Close < MA → only Shorts.
4. Anti-Re-Entry Logic (Cloud Touch Reset)
The strategy uses internal flags to avoid continuous re-entries in the same direction without a reset.
Two flags:
allowLong
allowShort
After a Long entry, allowLong is set to false, allowShort to true.
After a Short entry, allowShort is set to false, allowLong to true.
Flags are reset when price touches the Kumo:
If Low goes into the cloud → allowLong = true
If High goes into the cloud → allowShort = true
If Close is inside the cloud → both allowLong and allowShort are set to true
There is a key option:
Wait Position Close Before Flag Reset
If ON: cloud touch will reset flags only when there is no open position.
If OFF: flags can be reset even while a trade is open.
This gives a kind of regime-based re-entry control: after a trend leg, you wait for a “cloud interaction” to allow new signals.
5. Risk Management
All risk management is handled inside the strategy.
5.1 Position Sizing
Order Size % of Equity – default 10%
The strategy calculates:
position_value = equity * (Order Size % / 100)
position_qty = position_value / close
So position size automatically adapts to your current equity.
5.2 Take Profit Modes
You can choose one of two TP modes:
Percent
Fibonacci
5.2.1 Percent Mode
Single Take Profit at X% from entry (default 2%).
For Long:
TP = entry_price * (1 + tp_pct / 100)
For Short:
TP = entry_price * (1 - tp_pct / 100)
One strategy.exit per side is used: "Long TP/SL" and "Short TP/SL".
5.2.2 Fibonacci Mode (2 partial TPs)
In this mode, TP levels are based on a virtual Fib-style extension between entry and stop-loss.
Inputs:
Fib TP1 Level (default 1.618)
Fib TP2 Level (default 2.5)
TP1 Share % (Fib) (default 50%)
TP2 share is automatically 100% - TP1 share.
Process for Long:
Compute a reference Stop (see SL section below) → sl_for_fib.
Compute distance: dist = entry_price - sl_for_fib.
TP levels:
TP1 = entry_price + dist * (Fib TP1 Level - 1)
TP2 = entry_price + dist * (Fib TP2 Level - 1)
For Short, the logic is mirrored.
Two exits are used:
TP1 – closes TP1 share % of position.
TP2 – closes remaining TP2 share %.
Same stop is used for both partial exits.
5.3 Stop-Loss Modes
You can choose one of three Stop Loss modes:
Stable – fixed % from entry.
Ichimoku – fixed level derived from the Kumo.
Ichimoku Trailing – dynamic SL following the cloud.
5.3.1 Stable SL
For Long:
SL = entry_price * (1 - Stable SL % / 100)
For Short:
SL = entry_price * (1 + Stable SL % / 100)
Used both for Percent TP mode and as reference for Fib TP if Kumo is not available.
5.3.2 Ichimoku SL (fixed, non-trailing)
At the time of a new trade:
For Long:
Base SL = cloud bottom minus small offset (%)
For Short:
Base SL = cloud top plus small offset (%)
The offset is configurable: Ichimoku SL Offset %.
Once computed, that SL level is fixed for this trade.
5.3.3 Ichimoku Trailing SL
Similar to Ichimoku SL, but recomputed each bar:
For Long:
SL = cloud bottom – offset
For Short:
SL = cloud top + offset
A red trailing SL line is drawn on the chart to visualize current stop level.
This trailing SL is also used as reference for BreakEven and for Fib TP distance.
6. BreakEven Logic (with BE Lines)
BreakEven is optional and supports two modes:
Percent
Fibonacci
Inputs:
Percent mode:
BE Trigger % (from entry) – move SL to BE when price goes this % in profit.
BE Offset % from entry – SL will be set to entry ± this offset.
Fibonacci mode:
BE Fib Level – Fib level at which BE will be activated (default 1.618, same style as TP).
BE Offset % from entry – how far from entry to place BE stop.
The logic:
Before BE is triggered, SL follows its normal mode (Stable/Ichimoku/Ichimoku Trailing).
When BE triggers:
For Long:
New SL = max(current SL, BE SL).
For Short:
New SL = min(current SL, BE SL).
This means BE will never loosen the stop – only tighten it.
When BE is activated, the strategy draws a violet horizontal line at the BreakEven level (once per trade).
BE state is cleared when the position is closed or when a new position is opened.
7. Entry & Exit Logic (Summary)
7.1 Long Entry
Conditions for a Long:
CCI signal:
CCI crosses up through the upper threshold.
Ichimoku Cloud Filter (optional):
If enabled → price must be above the Kumo.
Ichimoku Lines Filter (optional):
If enabled → Conversion Line and Base Line must be above the Kumo.
MA Direction Filter (optional):
If enabled → Close must be above the chosen MA.
Anti-re-entry flag:
allowLong must be true (cloud-based reset).
Position check:
Long entries are allowed when current position size ≤ 0 (so it can also reverse from short to long).
If all these conditions are true, the strategy sends:
strategy.entry("Long", strategy.long, qty = calculated_qty)
After entry:
allowLong = false
allowShort = true
7.2 Short Entry
Same structure, mirrored:
CCI signal:
CCI crosses down through the lower threshold.
Cloud filter: price must be below cloud (if enabled).
Lines filter: conversion & base must be below cloud (if enabled).
MA filter: Close must be below MA (if enabled).
allowShort must be true.
Position check: position size ≥ 0 (allows reversal from long to short).
Then:
strategy.entry("Short", strategy.short, qty = calculated_qty)
Flags update:
allowShort = false
allowLong = true
7.3 Exits
While in a position:
The strategy continuously recalculates SL (depending on chosen mode) and, in Percent mode, TP.
In Fib mode, fixed TP levels are computed at entry.
BreakEven may raise/tighten the SL if its conditions are met.
Exits are executed via strategy.exit:
Percent mode: one TP+SL exit per side.
Fib mode: two partial exits (TP1 and TP2) sharing the same SL.
At position open, the script also draws visual lines:
White line — entry price.
Green line(s) — TP level(s).
Red line — SL (if not using Ichimoku Trailing; with trailing, the red line is updated dynamically).
Maximum of 30 lines are kept to avoid clutter.
8. How to Use the Strategy
Choose market & timeframe
Works well on trending instruments. Try crypto, FX or indices on H1–H4, or intraday if you prefer more trades.
Adjust Ichimoku settings
Keep defaults (9/26/52/26) or adapt to your timeframe.
Configure Moving Average
Typical: EMA 200 as a trend filter.
Turn MA Direction Filter ON if you want to trade only with the main trend.
Set CCI thresholds
Default ±100 is classic.
Lower thresholds → more signals, higher noise.
Higher thresholds → fewer but stronger signals.
Enable/disable filters
Turn on Ichimoku Cloud and Ichimoku Lines if you want only “clean” trend trades.
Use Wait Position Close Before Flag Reset to control how often re-entries are allowed.
Choose TP & SL mode
Percent mode is simpler and easier to understand.
Fibonacci mode is more advanced: it aligns TP levels with the distance to stop, giving asymmetric RR setups (two partial TPs).
Choose Stable SL for fixed-risk trades, or Ichimoku / Ichimoku Trailing to tie stops to the cloud structure.
Set BreakEven
Enable BE if you want to lock in risk-free trades after a certain move.
Percent mode is straightforward; Fib mode keeps BreakEven in harmony with your Fib TP setup.
Run Backtest & Optimize
Press “Add to chart” → go to Strategy Tester.
Adjust parameters to your market and timeframe.
Look at equity curve, PF, drawdown, average trade, etc.
Live / Paper Trading
After you’re satisfied with backtest results, use the strategy to generate signals.
You can mirror entries/exits manually or connect them to alerts (if you build an alert-based execution layer).

50 & 200 SMA + RSI Average Strategy (Long Only, Single Trade)It works better in trending markets. It delivers its best performance in the 4-hour to 1-day timeframes.

1M XAU Cumulative Delta Volume with OB Breakouts
### Overview
This is a **session-based CVD strategy** built around the **00:00–07:00 CEST range**. It finds the high/low of that session, turns them into **adaptive ATR-based support (yellow)** and **resistance (purple)** zones, and trades only **CVD-confirmed reversals** off those levels.
---
### How it Works
* For each day, the script:
* Builds a 00:00–07:00 CEST **profile high/low**.
* Creates a **support zone** around the session low and a **resistance zone** around the session high.
* Using lower timeframe data, it reconstructs **Cumulative Volume Delta (CVD)** and a **recent delta** filter.
* It arms “pending” states when price **enters a zone from the correct side**, then confirms:
* **BUY (long):** price reclaims above support and recent CVD is strongly positive.
* **SELL (short):** price rejects below resistance and recent CVD is strongly negative.
Only these two CVD signals (`buySignal` / `sellSignal`) open trades.
---
### Strategy Logic
* **Entries**
* `buySignal` → open **long** (if flat).
* `sellSignal` → open **short** (if flat).
* No pyramiding; one position at a time.
* **Exits (only TP & SL)**
* Long: TP at `avg_price * (0.5 + TP%)`, SL at `avg_price * (1 – SL%)`.
* Short: TP at `avg_price * (0.5 – TP%)`, SL at `avg_price * (1 + SL%)`.
* No opposite-signal exits.
---
### Extras
* **Reversal markers** on yellow/purple zones and **breakout/retest markers** are plotted for context and alerts but **do not trigger entries**.
* Zone width and “thickening” are ATR-based so important touches and near-touches are easy to see.
* Only suited for **1m intraday scalping** (e.g. XAU/USD), but can be tested on other markets/timeframes.

ATR Trend + RSI Pullback Strategy [Profit-Focused]This strategy is designed to catch high-probability pullbacks during strong trends using a combination of ATR-based volatility filters, RSI exhaustion levels, and a trend-following entry model.
Strategy Logic
Rather than relying on lagging crossovers, this model waits for RSI to dip into oversold zones (below 40) while price remains above a long-term EMA (default: 200). This setup captures pullbacks in strong uptrends, allowing traders to enter early in a move while controlling risk dynamically.
To avoid entries during low-volatility conditions or sideways price action, it applies a minimum ATR filter. The ATR also defines both the stop-loss and take-profit levels, allowing the model to adapt to changing market conditions.
Exit logic includes:
A take-profit at 3× the ATR distance
A stop-loss at 1.5× the ATR distance
An optional early exit if RSI crosses above 70, signaling overbought conditions
Technical Details
Trend Filter: 200 EMA – must be rising and price must be above it
Entry Signal: RSI dips below 40 during an uptrend
Volatility Filter: ATR must be above a user-defined minimum threshold
Stop-Loss: 1.5× ATR below entry price
Take-Profit: 3.0× ATR above entry price
Exit on Overbought: RSI > 70 (optional early exit)
Backtest Settings
Initial Capital: $10,000
Position Sizing: 5% of equity per trade
Slippage: 1 tick
Commission: 0.075% per trade
Trade Direction: Long only
Timeframes Tested: 15m, 1H, and 30m on trending assets like BTCUSD, NAS100, ETHUSD
This model is tuned for positive P&L across trending environments and volatile markets.
Educational Use Only
This strategy is for educational purposes only and should not be considered financial advice. Past performance does not guarantee future results. Always validate performance on multiple markets and timeframes before using it in live trading.

Range Oscillator Strategy + Stoch Confirm🔹 Short summary
This is a free, educational long-only strategy built on top of the public “Range Oscillator” by Zeiierman (used under CC BY-NC-SA 4.0), combined with a Stochastic timing filter, an EMA-based exit filter and an optional risk-management layer (SL/TP and R-multiple exits). It is NOT financial advice and it is NOT a magic money machine. It’s a structured framework to study how range-expansion + momentum + trend slope can be combined into one rule-based system, often with intentionally RARE trades.
────────────────────────
0. Legal / risk disclaimer
────────────────────────
• This script is FREE and public. I do not charge any fee for it.
• It is for EDUCATIONAL PURPOSES ONLY.
• It is NOT financial advice and does NOT guarantee profits.
• Backtest results can be very different from live results.
• Markets change over time; past performance is NOT indicative of future performance.
• You are fully responsible for your own trades and risk.
Please DO NOT use this script with money you cannot afford to lose. Always start in a demo / paper trading environment and make sure you understand what the logic does before you risk any capital.
────────────────────────
1. About default settings and risk (very important)
────────────────────────
The script is configured with the following defaults in the `strategy()` declaration:
• `initial_capital = 10000`
→ This is only an EXAMPLE account size.
• `default_qty_type = strategy.percent_of_equity`
• `default_qty_value = 100`
→ This means 100% of equity per trade in the default properties.
→ This is AGGRESSIVE and should be treated as a STRESS TEST of the logic, not as a realistic way to trade.
TradingView’s House Rules recommend risking only a small part of equity per trade (often 1–2%, max 5–10% in most cases). To align with these recommendations and to get more realistic backtest results, I STRONGLY RECOMMEND you to:
1. Open **Strategy Settings → Properties**.
2. Set:
• Order size: **Percent of equity**
• Order size (percent): e.g. **1–2%** per trade
3. Make sure **commission** and **slippage** match your own broker conditions.
• By default this script uses `commission_value = 0.1` (0.1%) and `slippage = 3`, which are reasonable example values for many crypto markets.
If you choose to run the strategy with 100% of equity per trade, please treat it ONLY as a stress-test of the logic. It is NOT a sustainable risk model for live trading.
────────────────────────
2. What this strategy tries to do (conceptual overview)
────────────────────────
This is a LONG-ONLY strategy designed to explore the combination of:
1. **Range Oscillator (Zeiierman-based)**
- Measures how far price has moved away from an adaptive mean.
- Uses an ATR-based range to normalize deviation.
- High positive oscillator values indicate strong price expansion away from the mean in a bullish direction.
2. **Stochastic as a timing filter**
- A classic Stochastic (%K and %D) is used.
- The logic requires %K to be below a user-defined level and then crossing above %D.
- This is intended to catch moments when momentum turns up again, rather than chasing every extreme.
3. **EMA Exit Filter (trend slope)**
- An EMA with configurable length (default 70) is calculated.
- The slope of the EMA is monitored: when the slope turns negative while in a long position, and the filter is enabled, it triggers an exit condition.
- This acts as a trend-protection exit: if the medium-term trend starts to weaken, the strategy exits even if the oscillator has not yet fully reverted.
4. **Optional risk-management layer**
- Percentage-based Stop Loss and Take Profit (SL/TP).
- Risk/Reward (R-multiple) exit based on the distance from entry to SL.
- Implemented as OCO orders that work *on top* of the logical exits.
The goal is not to create a “holy grail” system but to serve as a transparent, configurable framework for studying how these concepts behave together on different markets and timeframes.
────────────────────────
3. Components and how they work together
────────────────────────
(1) Range Oscillator (based on “Range Oscillator (Zeiierman)”)
• The script computes a weighted mean price and then measures how far price deviates from that mean.
• Deviation is normalized by an ATR-based range and expressed as an oscillator.
• When the oscillator is above the **entry threshold** (default 100), it signals a strong move away from the mean in the bullish direction.
• When it later drops below the **exit threshold** (default 30), it can trigger an exit (if enabled).
(2) Stochastic confirmation
• Classic Stochastic (%K and %D) is calculated.
• An entry requires:
- %K to be below a user-defined “Cross Level”, and
- then %K to cross above %D.
• This is a momentum confirmation: the strategy tries to enter when momentum turns up from a pullback rather than at any random point.
(3) EMA Exit Filter
• The EMA length is configurable via `emaLength` (default 70).
• The script monitors the EMA slope: it computes the relative change between the current EMA and the previous EMA.
• If the slope turns negative while the strategy holds a long position and the filter is enabled, it triggers an exit condition.
• This is meant to help protect profits or cut losses when the medium-term trend starts to roll over, even if the oscillator conditions are not (yet) signalling exit.
(4) Risk management (optional)
• Stop Loss (SL) and Take Profit (TP):
- Defined as percentages relative to average entry price.
- Both are disabled by default, but you can enable them in the Inputs.
• Risk/Reward Exit:
- Uses the distance from entry to SL to project a profit target at a configurable R-multiple.
- Also optional and disabled by default.
These exits are implemented as `strategy.exit()` OCO orders and can close trades independently of oscillator/EMA conditions if hit first.
────────────────────────
4. Entry & Exit logic (high level)
────────────────────────
A) Time filter
• You can choose a **Start Year** in the Inputs.
• Only candles between the selected start date and 31 Dec 2069 are used for backtesting (`timeCondition`).
• This prevents accidental use of tiny cherry-picked windows and makes tests more honest.
B) Entry condition (long-only)
A long entry is allowed when ALL the following are true:
1. `timeCondition` is true (inside the backtest window).
2. If `useOscEntry` is true:
- Range Oscillator value must be above `entryLevel`.
3. If `useStochEntry` is true:
- Stochastic condition (`stochCondition`) must be true:
- %K < `crossLevel`, then %K crosses above %D.
If these filters agree, the strategy calls `strategy.entry("Long", strategy.long)`.
C) Exit condition (logical exits)
A position can be closed when:
1. `timeCondition` is true AND a long position is open, AND
2. At least one of the following is true:
- If `useOscExit` is true: Oscillator is below `exitLevel`.
- If `useMagicExit` (EMA Exit Filter) is true: EMA slope is negative (`isDown = true`).
In that case, `strategy.close("Long")` is called.
D) Risk-management exits
While a position is open:
• If SL or TP is enabled:
- `strategy.exit("Long Risk", ...)` places an OCO stop/limit order based on the SL/TP percentages.
• If Risk/Reward exit is enabled:
- `strategy.exit("RR Exit", ...)` places an OCO order using a projected R-multiple (`rrMult`) of the SL distance.
These risk-based exits can trigger before the logical oscillator/EMA exits if price hits those levels.
────────────────────────
5. Recommended backtest configuration (to avoid misleading results)
────────────────────────
To align with TradingView House Rules and avoid misleading backtests:
1. **Initial capital**
- 10 000 (or any value you personally want to work with).
2. **Order size**
- Type: **Percent of equity**
- Size: **1–2%** per trade is a reasonable starting point.
- Avoid risking more than 5–10% per trade if you want results that could be sustainable in practice.
3. **Commission & slippage**
- Commission: around 0.1% if that matches your broker.
- Slippage: a few ticks (e.g. 3) to account for real fills.
4. **Timeframe & markets**
- Volatile symbols (e.g. crypto like BTCUSDT, or major indices).
- Timeframes: 1H / 4H / **1D (Daily)** are typical starting points.
- I strongly recommend trying the strategy on **different timeframes**, for example 1D, to see how the behaviour changes between intraday and higher timeframes.
5. **No “caution warning”**
- Make sure your chosen symbol + timeframe + settings do not trigger TradingView’s caution messages.
- If you see warnings (e.g. “too few trades”), adjust timeframe/symbol or the backtest period.
────────────────────────
5a. About low trade count and rare signals
────────────────────────
This strategy is intentionally designed to trade RARELY:
• It is **long-only**.
• It uses strict filters (Range Oscillator threshold + Stochastic confirmation + optional EMA Exit Filter).
• On higher timeframes (especially **1D / Daily**) this can result in a **low total number of trades**, sometimes WELL BELOW 100 trades over the whole backtest.
TradingView’s House Rules mention 100+ trades as a guideline for more robust statistics. In this specific case:
• The **low trade count is a conscious design choice**, not an attempt to cherry-pick a tiny, ultra-profitable window.
• The goal is to study a **small number of high-conviction long entries** on higher timeframes, not to generate frequent intraday signals.
• Because of the low trade count, results should NOT be interpreted as statistically strong or “proven” – they are only one sample of how this logic would have behaved on past data.
Please keep this in mind when you look at the equity curve and performance metrics. A beautiful curve with only a handful of trades is still just a small sample.
────────────────────────
6. How to use this strategy (step-by-step)
────────────────────────
1. Add the script to your chart.
2. Open the **Inputs** tab:
- Set the backtest start year.
- Decide whether to use Oscillator-based entry/exit, Stochastic confirmation, and EMA Exit Filter.
- Optionally enable SL, TP, and Risk/Reward exits.
3. Open the **Properties** tab:
- Set a realistic account size if you want.
- Set order size to a realistic % of equity (e.g. 1–2%).
- Confirm that commission and slippage are realistic for your broker.
4. Run the backtest:
- Look at Net Profit, Max Drawdown, number of trades, and equity curve.
- Remember that a low trade count means the statistics are not very strong.
5. Experiment:
- Tweak thresholds (`entryLevel`, `exitLevel`), Stochastic settings, EMA length, and risk params.
- See how the metrics and trade frequency change.
6. Forward-test:
- Before using any idea in live trading, forward-test on a demo account and observe behaviour in real time.
────────────────────────
7. Originality and usefulness (why this is more than a mashup)
────────────────────────
This script is not intended to be a random visual mashup of indicators. It is designed as a coherent, testable strategy with clear roles for each component:
• Range Oscillator:
- Handles mean vs. range-expansion states via an adaptive, ATR-normalized metric.
• Stochastic:
- Acts as a timing filter to avoid entering purely on extremes and instead waits for momentum to turn.
• EMA Exit Filter:
- Trend-slope-based safety net to exit when the medium-term direction changes against the position.
• Risk module:
- Provides practical, rule-based exits: SL, TP, and R-multiple exit, which are useful for structuring risk even if you modify the core logic.
It aims to give traders a ready-made **framework to study and modify**, not a black box or “signals” product.
────────────────────────
8. Limitations and good practices
────────────────────────
• No single strategy works on all markets or in all regimes.
• This script is long-only; it does not short the market.
• Performance can degrade when market structure changes.
• Overfitting (curve fitting) is a real risk if you endlessly tweak parameters to maximise historical profit.
Good practices:
- Test on multiple symbols and timeframes.
- Focus on stability and drawdown, not only on how high the profit line goes.
- View this as a learning tool and a basis for your own research.
────────────────────────
9. Licensing and credits
────────────────────────
• Core oscillator idea & base code:
- “Range Oscillator (Zeiierman)”
- © Zeiierman, licensed under CC BY-NC-SA 4.0.
• Strategy logic, Stochastic confirmation, EMA Exit Filter, and risk-management layer:
- Modifications by jokiniemi.
Please respect both the original license and TradingView House Rules if you fork or republish any part of this script.
────────────────────────
10. No payments / no vendor pitch
────────────────────────
• This script is completely FREE to use on TradingView.
• There is no paid subscription, no external payment link, and no private signals group attached to it.
• If you have questions, please use TradingView’s comment system or private messages instead of expecting financial advice.
Use this script as a tool to learn, experiment, and build your own understanding of markets.
────────────────────────
11. Example backtest settings used in screenshots
────────────────────────
To avoid any confusion about how the results shown in screenshots were produced, here is one concrete example configuration:
• Symbol: BTCUSDT (or similar major BTC pair)
• Timeframe: 1D (Daily)
• Backtest period: from 2018 to the most recent data
• Initial capital: 10 000
• Order size type: Percent of equity
• Order size: 2% per trade
• Commission: 0.1%
• Slippage: 3 ticks
• Risk settings: Stop Loss and Take Profit disabled by default, Risk/Reward exit disabled by default
• Filters: Range Oscillator entry/exit enabled, Stochastic confirmation enabled, EMA Exit Filter enabled
If you change any of these settings (symbol, timeframe, risk per trade, commission, slippage, filters, etc.), your results will look different. Please always adapt the configuration to your own risk tolerance, market, and trading style.

W%R Pullback+EMA Trend [TS_Indie]🔰 Core Concept of the Strategy
The main idea is “Trend-Following with Momentum Pullback.”
This means trading in the direction of the main trend (defined by EMA) while using Williams %R to identify pullback entries (buying the dip or selling the rally) where momentum returns to the trend direction.
📊 Indicators Used
1. EMA Fast – Defines the short-term trend.
2. EMA Slow – Defines the long-term trend (used as a trend filter).
3. Williams %R
• Overbought zone: above -20
• Oversold zone: below -80
⚙️ Entry Rules
🔹 Buy Setup
1. EMA Fast > EMA Slow → Uptrend condition.
2. Williams %R on the previous candle dropped below -80, and on the current candle, it crosses back above -80 → indicates momentum returning to the upside.
3. Current close is above EMA Fast.
4. Entry Buy at the close of the candle where %R crosses above -80.
🎯 Entry, Stop Loss, and Take Profit
1. Entry : At the candle close where the signal occurs.
2. Stop Loss : At the lowest low between the current and previous candles.
3. Take Profit : Calculated based on entry price and stop loss distance multiplied by the Risk/Reward Ratio.
🔹 Sell Setup
1. EMA Fast < EMA Slow → Downtrend condition.
2. Williams %R on the previous candle went above -20, and on the current candle, it crosses back below -20 → indicates renewed selling momentum.
3. Current price is below EMA Fast.
4. Entry Sell at the close of the candle where %R crosses below -20.
🎯 Entry, Stop Loss, and Take Profit
1. Entry : At the candle close where the signal occurs.
2. Stop Loss : At the highest high between the current and previous candles.
3. Take Profit : Calculated based on entry price and stop loss distance multiplied by the Risk/Reward Ratio.
⚙️ Optional Parameters
• Custom Risk/Reward Ratio for Take Profit.
• Option to add ATR buffer to Stop Loss.
• Adjustable EMA Fast period.
• Adjustable EMA Slow period.
• Adjustable Williams %R period.
• Option to enable Long only / Short only positions.
• Customizable Backtest start and end date.
• Customizable trading session time.
⏰ Alert Function
Alerts display:
• Entry price
• Stop Loss price
• Take Profit price
Guys, try adjusting the parameters yourselves!
I’ve been tweaking the settings for several days and managed to get great results on XAU/USD in the 5-minute timeframe.
I think this strategy is quite interesting and could potentially deliver good results on other instruments as well.
⚠️ Disclaimer
This indicator is designed for educational and research purposes only.
It does not guarantee profits and should not be considered financial advice.
Trading in financial markets involves significant risk, including the potential loss of capital.

nOI + Funding + CVD • strategynOI + Funding + CVD Strategy
Overview
This strategy is designed for cryptocurrency trading on platforms like TradingView, focusing on perpetual futures markets. It combines three key indicators—Normalized Open Interest (nOI), Funding Rate, and Cumulative Volume Delta (CVD)—to generate buy and sell signals for long and short positions. The strategy aims to capitalize on market imbalances, such as overextended open interest, funding rate extremes, and volume deltas, which often signal potential reversals or continuations in trending markets.
The script supports pyramiding (up to 10 positions), uses percentage-based position sizing (default 10% of equity per trade), and allows customization of trade directions (longs and shorts can be enabled/disabled independently). It includes multiple signal systems for entries, various exit mechanisms (including stop-loss, take-profit, time-based exits, and conditional closes based on indicators), a Martingale add-on system for averaging positions during drawdowns, and handling of opposite signals (ignore, close, or reverse).
This strategy is not financial advice; backtest thoroughly and use at your own risk. It requires data sources for Open Interest (OI) and Funding Rates, which are fetched via TradingView's security functions (e.g., from Binance for funding premiums).
Key Indicators
1. Normalized Open Interest (nOI)
Group: Open Interest
Purpose: Measures the relative level of open interest over a lookback window to identify overbought (high OI) or oversold (low OI) conditions, which can indicate potential exhaustion in trends.
Calculation:
Fetches OI data (close) from the symbol's standard ticker (e.g., "{symbol}_OI").
Normalizes OI within a user-defined window (default: 500 bars) using min-max scaling: (OI - min_OI) / (max_OI - min_OI) * 100.
Upper threshold (default: 70%): Signals potential short opportunities when crossed from above.
Lower threshold (default: 30%): Signals potential long opportunities when crossed from below.
Visualization: Plotted as a line (teal above upper, red below lower, gray in between). Horizontal lines at upper, mid (50%), lower, and a separator at 102%.
Notes: Handles non-crypto symbols by adjusting timeframe to daily if intraday. Errors if no OI data available.
2. Funding Rate
Group: Funding Rate
Purpose: Tracks the average funding rate (premium index) to detect market sentiment extremes. Positive funding suggests bull bias (longs pay shorts), negative suggests bear bias.
Calculation:
Fetches premium index data from Binance (e.g., "binance:{base}usdt_premium").
Supports lower timeframe aggregation (default: enabled, using 1-min TF) for smoother data.
Averages open and close premiums, clamps values, and scales/shifts for plotting (base: 150, scale: 1000x).
Upper threshold (default: 1.0%): Overheat for shorts.
Lower threshold (default: 1.0%): Overcool for longs.
Ultra level (default: 1.8%): Extreme for additional short signals.
Smoothing: Uses inverse weighted moving average (IWMA) or lower-TF aggregation to reduce noise.
Visualization: Shifted plot (green positive, red negative) with filled areas. Horizontal lines for overheat, overcool, base (0%), and ultra.
Notes: Custom ticker option for non-standard symbols.
3. Cumulative Volume Delta (CVD)
Group: CVD (Cumulative Volume Delta)
Purpose: Measures net buying/selling pressure via volume delta, normalized to identify divergences or confirmations with price.
Calculation:
Delta: +volume if close > open, -volume if close < open.
Cumulative: Rolling cumsum over a window (default: 500 bars), smoothed with EMA (default: 20).
Normalized: Scaled by absolute max in window (-1 to 1 range).
Scaled/shifted for plotting (base: 300 or 0 if anchored, scale: 120x).
Upper threshold (default: 1.0%): Over for shorts.
Lower threshold (default: 1.0%): Under for longs.
Visualization: Shifted plot (aqua positive, purple negative) with filled areas. Horizontal lines for over, under, and separator (default: 252).
Filter Options (for Signal A):
Enable filter (default: false).
Require sign match (Long ≥0, Short ≤0).
Require extreme zones.
Require momentum (rising/falling over N bars, default: 3).
Signal Logics for Entries
Entries are triggered by buy/sell signals from multiple systems (A, B, C, D), filtered by direction toggles and entry conditions.
Signal System A: OI + Funding (with optional CVD filter)
Enabled: Default true.
Sell (Short): nOI > upper threshold, falling over N bars (default: 3), delta ≥ threshold (default: 3%), funding > overheat, and CVD filter OK.
Buy (Long): nOI < lower threshold, rising over N bars (default: 3), delta ≥ threshold (default: 3%), funding < overcool, and CVD filter OK.
Signal System B: Short - Funding Crossunder + Filters
Enabled: Default true.
Sell (Short): Funding crosses under overheat level, optional: CVD > over, nOI < upper.
Signal System C: Short - Ultra Funding
Enabled: Default false.
Sell (Short): Funding crosses ultra level (up or down, both default true).
Signal System D: Long - Funding Crossover + Filters
Enabled: Default true.
Buy (Long): Funding crosses over overcool level, optional: CVD < under, nOI > lower.
Combined: Sell if A/B/C active; Buy if A/D active.
Entry Filters
Cooldown: Optional pause between entries (default: false, 3 bars).
Max Entries: Limit pyramiding (default: true, 6 max).
Entries only if both filters pass and direction allowed.
Opposite Signal Handling
Mode: Ignore (default), Reverse (close and enter opposite), or Close (exit only).
Processed before regular entries.
Position Management
Martingale (3 Steps):
Enabled per step (default: all true).
Triggers add-ons at loss levels (defaults: 5%, 8%, 11%) by adding % to position (default: 100% each).
Resets on position close.
Break Even:
Enabled (default: true).
Activates at profit threshold (default: 5%), sets SL better by offset (default: 0.1%).
Exit Systems
Multiple exits checked in sequence.
Exit 1: SL/TP
Enabled: Separate for long/short (default: true).
SL: % from avg price (defaults: 1% long/short).
TP: % from avg price (defaults: 2% long/short).
Exit 2: Funding
Enabled: Separate for long (up) / short (down) (default: true).
Long Exit: Funding > upper exit threshold (default: 0.8%).
Short Exit: Funding < lower exit threshold (default: 0.8%).
Exit 3: nOI
Enabled: Separate for long (up) / short (down) (default: true).
Long Exit: nOI > upper exit (default: 85%).
Short Exit: nOI < lower exit (default: 15%).
Exit 4: Global SL
Enabled: Default true.
Exit: If position loss ≥ % (default: 7%).
Exit 5: Break Even (integrated in position block)
Exit 6: Time Limit
Enabled: Separate for long/short (default: true).
Exit: After N bars in trade (defaults: 30 each).
Timer updates on add-ons if enabled (default: true).
Visual Elements
Buy/Sell Labels: Small labels ("BUY"/"SELL") on bars with signals, limited to last 30.
All indicators plotted on a separate pane (overlay=false).
Usage Notes
Backtesting: Adjust parameters based on asset/timeframe. Test on historical data.
Data Requirements: Works best on crypto perps with OI and funding data.
Risk Management: Incorporates SL/TP and global SL; monitor drawdowns with Martingale.
Customization: All thresholds, enables, and scales are inputs for fine-tuning.
Version: Pine Script v6.
For questions or improvements, contact the author. Happy trading!

AlgoWay GRSIM🧭 What this strategy tries to do
This strategy detects when a market move is losing strength and prepares for a potential reversal, but it waits for fresh momentum confirmation before acting.
It combines:
• RSI-based divergence (to spot exhaustion and potential turning points),
• Impulse MACD (to verify that the new direction actually has force behind it).
________________________________________
⚙️ When it takes trades
Long (Buy):
• A bullish RSI divergence appears (a clue that selling pressure is fading);
• Within a short time window, the Impulse MACD turns strongly positive;
• Optionally, the impulse line itself must be rising (if the Impulse Direction Filter is
enabled).
Short (Sell):
• A bearish RSI divergence appears (buying pressure fading);
• Within a short time window, the Impulse MACD turns strongly negative;
• Optionally, the impulse line must be falling (if the Impulse Direction Filter is enabled).
If momentum confirmation happens too late, the divergence “expires” and the signal is ignored.
________________________________________
🧩 How entries work
1. Reversal clue:
The strategy detects disagreement between price and RSI (price makes a new high/low, RSI doesn’t).
That suggests a shift in underlying strength.
2. Momentum confirmation:
Before entering, the Impulse MACD must agree — showing real push in the same direction.
3. Impulse direction filter (optional):
When enabled, the impulse itself must accelerate (rise for longs, fall for shorts), avoiding fake signals where price diverges but momentum is still fading.
4. No stacking:
It opens only one position at a time.
________________________________________
🚪 How exits work
Two main exit styles:
Conservative (default):
Longs close when impulse crosses below its signal line.
Shorts close when impulse crosses above its signal line.
✅ Keeps trades as long as momentum agrees.
Color-change (fast):
Longs close immediately when impulse flips bearish.
Shorts close immediately when impulse flips bullish.
⚡ Faster and more defensive.
Plus:
Stop Loss (%) and Take Profit (%) act as fixed-distance protective exits (set to 0 to disable either one).
________________________________________
📊 What you’ll see on the chart
A thick Impulse MACD line and thin signal line (oscillator view).
Diamonds — detected bullish/bearish divergence points.
Circles — where impulse crosses its signal (momentum change).
A performance panel (top-right) showing Net Profit, Trades, Win Rate, Profit Factor, Pessimistic PF, and Max Drawdown.
________________________________________
🔧 What you can tune
Signal Lifetime (bars): how long a divergence remains valid.
Impulse Direction Filter: ensure the impulse itself is moving in the trade’s direction.
Stop Loss / Take Profit (%): risk and target in percent.
Exit Style: conservative cross or faster color-change.
RSI / MA / Signal Lengths: adjust responsiveness (defaults are balanced).
________________________________________
💪 Strengths
Confirms reversals using momentum direction, not just divergence.
Avoids “early” signals where momentum is still fading.
Works symmetrically for longs and shorts.
Built-in stop/target protection.
Clear, visual confirmation of all logic components.
________________________________________
⚠️ Things to keep in mind
In sideways markets, the impulse can flip often — prefer conservative exits.
Too small SL/TP → constant stop-outs.
Too wide SL/TP → deep drawdowns.
Always test with different timeframes and markets.
________________________________________
💡 Practical tips
Start with default settings.
Enable “Use Impulse Direction Filter” in trending markets, disable it in very choppy ones.
Focus on Profit Factor, Win Rate, and Max Drawdown after several dozen trades.
Keep SL/TP roughly aligned with typical swing size.
“AlgoWay GRSIM” is a reversal-with-confirmation strategy: it spots likely turns, demands real momentum alignment (optionally verified by impulse direction), and manages exits with clear momentum cues plus built-in protective limits.

Supertrend + MACD + EMA200 (Pro) V2 — Strict & TrailingThis strategy uses Supertrend, MACD and EMA 200 as indicators. When all three indicators shows the sema direction, you enter the trade.

Stochastic Divergence StrategyBackground bars:
Bearish
gradient from slightly bearish divergence to strong bearish divergence for red and a double bounce for pink
Bullish
gradient from slightly bearish divergence to strong bearish divergence for green and a double bounce for yellow
removable buy and sell signals in options
Hazel nut BB Strategy, volume base- lite versionHazel nut BB Strategy, volume base — lite version
Having knowledge and information in financial markets is only useful when a trader operates with a well-defined trading strategy. Trading strategies assist in capital management, profit-taking, and reducing potential losses.
This strategy is built upon the core principle of supply and demand dynamics. Alongside this foundation, one of the widely used technical tools — the Bollinger Bands — is employed to structure a framework for profit management and risk control.
In this strategy, the interaction of these tools is explained in detail. A key point to note is that for calculating buy and sell volumes, a lower timeframe function is used. When applied with a tick-level resolution, this provides the most precise measurement of buyer/seller flows. However, this comes with a limitation of reduced historical depth. Users should be aware of this trade-off: if precise tick-level data is required, shorter timeframes should be considered to extend historical coverage .
The strategy offers multiple configuration options. Nevertheless, it should be treated strictly as a supportive tool rather than a standalone trading system. Decisions must integrate personal analysis and other instruments. For example, in highly volatile assets with narrow ranges, it is recommended to adjust profit-taking and stop-loss percentages to smaller values.
◉ Volume Settings
• Buyer and seller volume (up/down volume) are requested from a lower timeframe, with an option to override the automatic resolution.
• A global lookback period is applied to calculate moving averages and cumulative sums of buy/sell/delta volumes.
• Ratios of buyers/sellers to total volume are derived both on the current bar and across the lookback window.
◉ Bollinger Band
• Bands are computed using configurable moving averages (SMA, EMA, RMA, WMA, VWMA).
• Inputs allow control of length, standard deviation multiplier, and offset.
• The basis, upper, and lower bands are plotted, with a shaded background between them.
◉ Progress & Proximity
• Relative position of the price to the Bollinger basis is expressed as percentages (qPlus/qMinus).
• “Near band” conditions are triggered when price progress toward the upper or lower band exceeds a user-defined threshold (%).
• A signed score (sScore) represents how far the close has moved above or below the basis relative to band width.
◉ Info Table
• Optional compact table summarizing:
• - Upper/lower band margins
• - Buyer/seller volumes with moving averages
• - Delta and cumulative delta
• - Buyer/seller ratios per bar and across the window
• - Money flow values (buy/sell/delta × price) for bar-level and summed periods
• The table is neutral-colored and resizable for different chart layouts.
◉ Zone Event Gate
• Tracks entry into and exit from “near band” zones.
• Arming logic: a side is armed when price enters a band proximity zone.
• Trigger logic: on exit, a trade event is generated if cumulative buyer or seller volume dominates over a configurable window.
◉ Trading Logic
• Orders are placed only on zone-exit events, conditional on volume dominance.
• Position sizing is defined as a fixed percentage of strategy equity.
• Long entries occur when leaving the lower zone with buyer dominance; short entries occur when leaving the upper zone with seller dominance.
◉ Exit Rules
• Open positions are managed by a strict priority sequence:
• 1. Stop-loss (% of entry price)
• 2. Take-profit (% of entry price)
• 3. Opposite-side event (zone exit with dominance in the other direction)
• Stop-loss and take-profit levels are configurable
◉ Notes
• This lite version is intended to demonstrate the interaction of Bollinger Bands and volume-based dominance logic.
• It provides a framework to observe how price reacts at band boundaries under varying buy/sell pressure, and how zone exits can be systematically converted into entry/exit signals.
When configuring this strategy, it is essential to carefully review the settings within the Strategy Tester. Ensure that the chosen parameters and historical data options are correctly aligned with the intended use. Accurate back testing depends on applying proper configurations for historical reference. The figure below illustrates sample result and configuration type.

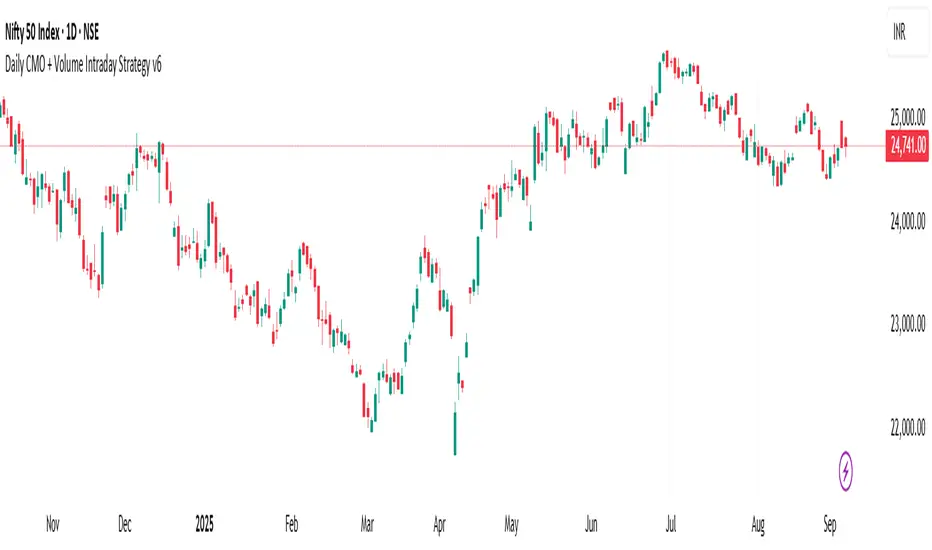
Daily CMO + Volume Intraday Strategy v6 by Subirrmomentum strategy. buy on next hourly candle after signal. target 5%, sl 1%
HMK-2 | PCA-1 + Rejim + Chebyshev + VWAP (Input'lu, v6)📌 HMK-2 | PCA-1 + Regime + Chebyshev + VWAP Strategy
1️⃣ Core Structure
Instead of relying on a single indicator, this system uses the Z-Score normalized average of three oscillators (RSI, MFI, ROC).
Signal (PCA-1):
RSI(14), MFI(14), ROC(5) → each is converted into a z-score.
Their average becomes the “composite signal,” our PCA-1 value.
Trend direction: If the Z-score EMA is rising → trend UP. If falling → trend DOWN.
2️⃣ Side Filters
Regime Filter (ADX + EMA)
ADX is calculated manually.
If ADX > 20 → trend exists → a 50-period EMA of this value smooths it.
This turns “trend regime” into a probability between 0–1.
Chebyshev Filter
A return series is checked against mean ± k*sigma bands.
If the return is within this band → valid signal. Extreme moves are filtered out.
VWAP Filter
Long trades: price must be above VWAP.
Short trades: price must be below VWAP.
Trades are only taken on the correct side of institutional cost averages.
3️⃣ Entry Conditions
Long:
PCA-1 signal crosses above threshold.
Trend Up + Regime OK + Chebyshev OK + Above VWAP.
Short:
PCA-1 signal crosses below threshold.
Trend Down + Regime OK + Chebyshev OK + Below VWAP.
4️⃣ Exit Mechanism
Main Exit: ATR-based stop/target.
Stop = entry price – ATR × (SL factor).
Take profit = entry price + ATR × (TP factor).
Additional Exit:
If price crosses to the opposite side of VWAP.
If PCA-1 signal crosses zero.
👉 Prevents trades from being locked, makes exits adaptive.
5️⃣ Labels / Visualization
AL / SHORT → entry points.
SAT / COVER → exit points.
VWAP line plotted in blue.
🧩 Strategy Features
Optimizable parameters:
Z-window (zWin)
Threshold
Chebyshev factor
ATR stop/target multipliers
This system works with:
Disciplined core (PCA-1 signal)
Triple protection (Regime + Chebyshev + VWAP)
Adaptive exits (ATR + VWAP/signal cross)
👉 Not a “single-indicator robot,” but a multi-filtered trade direction engine.
💡 Final Note
This is a base model of the system — open for further development.
I’ve shared the logic to give you a roadmap.
If you spot errors, fix them → that’s how you’ll improve it.
Don’t waste time asking me questions — refine and build it better yourselves.
Wishing you profitable trades. Stay well 🙏

Adaptive MVRV & RSI Strategy V6 (Dynamic Thresholds)Strategy Explanation
This is an advanced Dollar-Cost Averaging (DCA) strategy for Bitcoin that aims to adapt to long-term market cycles and changing volatility. Instead of relying on fixed buy/sell signals, it uses a dynamic, weighted approach based on a combination of on-chain data and classic momentum.
Core Components:
Dual-Indicator Signal: The strategy combines two powerful indicators for a more robust signal:
MVRV Ratio: An on-chain metric to identify when Bitcoin is fundamentally over or undervalued relative to its historical cost basis.
Weekly RSI: A classic momentum indicator to gauge long-term market strength and identify overbought/oversold conditions.
Dynamic, Self-Adjusting Thresholds: The core innovation of this strategy is that it avoids fixed thresholds (e.g., "sell when RSI is 70"). Instead, the buy and sell zones are dynamically calculated based on a long-term (2-year) moving average and standard deviation of each indicator. This allows the strategy to automatically adapt to Bitcoin's decreasing volatility and changing market structure over time.
Weighted DCA (Scaling In & Out): The strategy doesn't just buy or sell a fixed amount. The size of its trades is scaled based on conviction:
Buying: As the MVRV and RSI fall deeper into their "undervalued" zones, the percentage of available cash used for each purchase increases.
Selling: As the indicators rise further into "overvalued" territory, the percentage of the current position sold also increases.
This creates an adaptive system that systematically accumulates during periods of fear and distributes during periods of euphoria, with the intensity of its actions directly tied to the extremity of market conditions.

Energy Advanced Policy StrategyThis trading strategy emphasizes both technical trading as well as sentiment trading. Using news and government policy decisions, it can determine either positive or negative sentiment in the energy sector.
How the Strategy Works
This strategy has two main parts that work together to find good trades:
1. The "Policy & Sentiment Engine "
Policy Event Detection : The script spots potential big news or policy changes by looking for big, sudden price moves and huge trading volume. You can play with the Policy Event Volume Threshold and Policy Event Price Threshold (%) settings to make it more or less sensitive.
Sentiment Score : When the script finds a positive or negative event, it adds to a sentiment score. This score isn't forever, though; it fades over time, so the newest events matter the most.
Manual Override : The Manual News Sentiment setting lets you tell the script exactly what the market's mood is for a set time, which is perfect for when you already know about a big upcoming announcement.
The strategy only looks for a trade if the overall feeling is bullish enough. This makes sure you're trading with the big, fundamental forces of the market, not against them.
2. Technical Confirmation & Precision
After the policy and sentiment part gives a green light, the strategy uses a variety of technical indicators to confirm the trend and ideal entry positions.
Long-Term Trend : The script makes sure the market is in a strong uptrend by checking if the fast and medium-speed moving averages are going up, and if the price is above a long-term moving average.
Momentum : The MACD is used to make sure the price's upward momentum is getting stronger, not weaker.
Oscillator : It also uses the RSI to check if the market has gone up too much, too fast, which could mean it's about to turn around.
How to Use the Script
You can customize this strategy to fit your trading style and how much risk you're comfortable with. The inputs are grouped into logical sections for easy adjustment.
News & Policy Analysis : You can play with the Policy Event thresholds to make the script more or less sensitive to market shocks. And you can always use the Manual News Sentiment to take over when you're watching a specific news event.
Technical Analysis : Feel free to change the settings for things like the moving averages, RSI, and MACD to match what you like to trade and on what timeframe.
