Stoch.RSI+RSI+DoubleStrategy+CMWilliamsVixFix+DMI
/////////////////////////////////////////////////////////////////////////////////////////////////////////////////////////////////////////
//// STOCHASTIC_RSI+RSI+DOUBLE_STRATEGY+CM_WILLIAMS_VIX_FIX+DMI ////
////////////////////////////////////////////////////////////////////////////////////////////////////////////////////////////////////////
// This is a simple combination of integrated and published scripts, useful
// if you don't have a PRO account and want to bypass the 3 indicators limit.
// It includes:
// 1) Stoch.RSI
// 2) Relative strenght index
// 3) Stochastic + RSI, Double Strategy (by ChartArt)
// 4) CM_Williams_Vix_Fix Finds Market Bottoms (by ChrisMoody)
// 5) Directional Movement Index (DMI)
// For more details about 3) and 4) check the original scripts.
M-oscillator

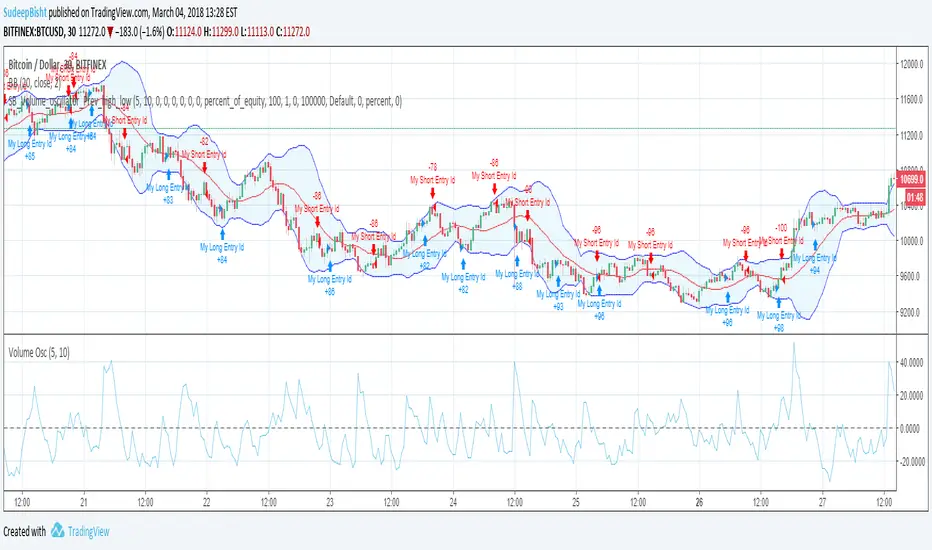
SB_Volume_oscillator_Prev_high_lowThe strategy is a take on traditional volume oscillator.
In Layman terms:
The script places an order when the oscillator crosses the zero mark in the volume oscillator.
If the previous high is greater than the absolute value of previous low then a long order is placed
And if the absolute previous low is greater than the previous high then a shrt order is placed.
Last script (bandwidth focus on other monetary works. If you have any opportunities ping me)
Message if you think of any modifications/ enhancements/ any opportunities. :)
Donations/Tips... :) -
BTC: 1BjswGcRR6c23pka7qh5t5k56j46cuyyy2
ETH: 0x64fed71c9d6c931639c7ba4671aeb6b05e6b3781
LTC: LKT2ykQ8QSzzfTDB6Tnsf12xwYPjgq95h4
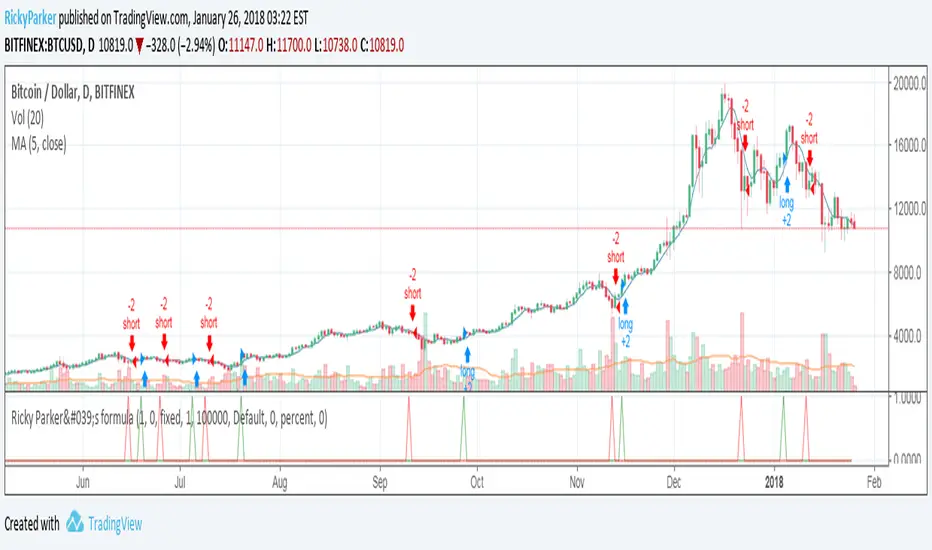
XBT Weekend Trade Strategy - 10x leverage and pyramiduses 10x leverage
Using Friday's XBT close price do the following:
- Go short when price rises above 4.5%
- Go long when price falls below 4.5%
- Add to long position when price falls another 4.5%, same with short position on the rise
- Close all orders when profits reach 10%
- Allow stacking up to 2 orders at once
- Close all orders start of Monday

XBT Weekend Trade Strategy (10x leverage)Using 10x leverage
Using Friday's GXBT close price do the following:
- Go short when price rises above 4.5%
- Go long when price falls below 4.5%
- Close all orders when profits reach 10%)
- Close all orders start of Monday
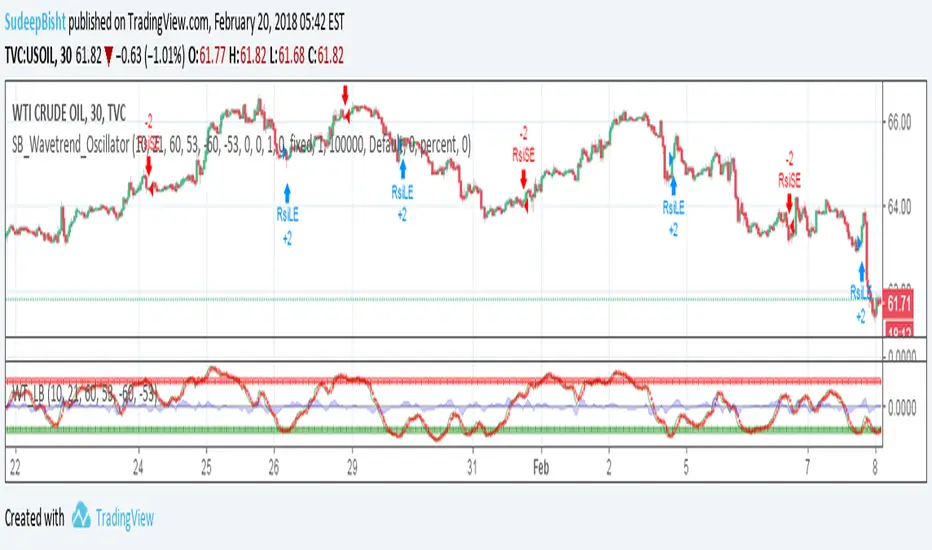
SB_Wavetrend_OscillatorA take on LazyBear's Wavetrend_Oscillator
The idea is bit modified.
Original Idea:
When the oscillator is above the overbought band (red lines) and crosses down the signal (dotted line), it is usually a good SELL signal. Similarly, when the oscillator crosses above the signal when below the Oversold band (green lines), it is a good BUY signal.
Modified Idea:
Carrying the original idea, if the oscillator crosses the overbought band (red lines) and crosses down the signal (dotted line) twice without crossing the Oversold band (green lines) and crosses above the signal (dotted line), a buy or sell signal will take place when the oscillator crosses the dotted line and the value of oscillator is >0(if sell order is to be placed) and <0(if buy order is to be placed).
For the original idea you can refer to:
Let me know if any refinements could improve the oscillator.
function bugFunctions with parameters do not work correctly: the returned value is sometimes different from the expected one.
The example script works correctly only when idx = 1 (instead of the current line 6).

LinearRegressionChannelBreakoutMy first idea about the linear regression channel... It is free and available for everybody.

Pramod’s Intraday StrategyIf Open = High, Short with 0.25% Stop Loss and 0.5% Take Profit
If Open = Low, Long with 0.25% Stop Loss and 0.5% Take Profit
This strategy is given by desipplz.


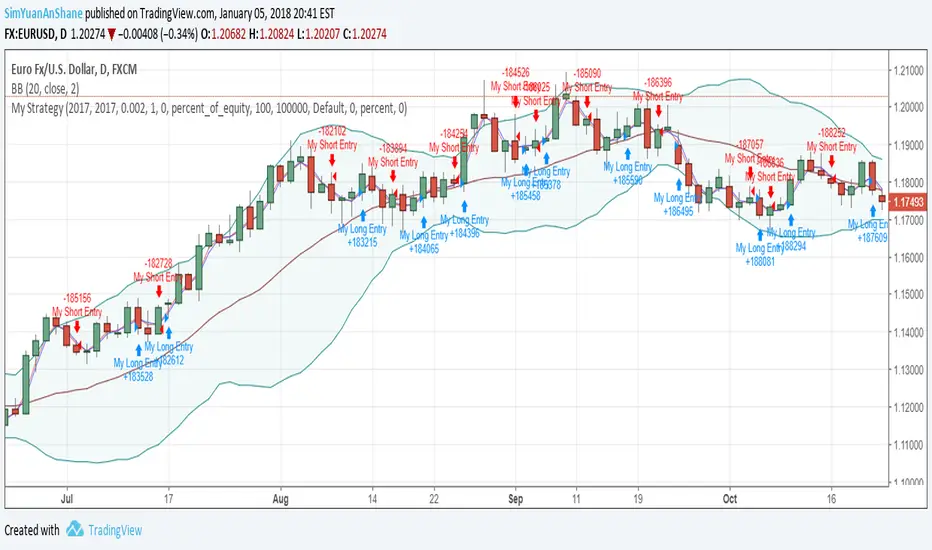
Parabolic SAR Strategy with good parametersI tested it on EURUSD with 2% profit:
Set input parameters like here: screenshots.firefox.com

Test1 based on Awesome and MACD oscillatorIf you know how to set stop-loss and take-profit limit based on prices, not tick, please comment.
Thanks!!

First script to be optimizedPlease, if you can help me to set stop-loss and take-profit rules based on prices and not on ticks, please comment that!

Trend following with HAThis is my first script and it is basically a MA crossover/under strategy that uses heikin ashi closing prices. I've also used limit orders based on HA opening prices of the previous day for entry which improves the performance. However, this impose a restriction when prices are moving too fast and the algo is unable to enter the trade, resulting in a bad position for a long period, which I believe is preventing this strategy from performing better. Will appreciate any comments/ suggestions to improve this (such as enter market prices the next day when failed to enter on HA price - not sure if this is possible) as I'm still starting out and will be more than happy to learn from the community here. Cheers!


CMARSI Strategy (on ETHUSD) Seems working goodthere it is, it's using the Connor RSI with little variations.
C onnor M oving A verage RSI

TFS: Volume Oscillator Backtest This is the second part of TFS trading strategy. The concept of this
indicator is similar to that of On-Balance Volume indicator (OBV). It
is calculated according to these rules:
If Close > Open, Volume is positive
If Close < Open, Volume is negative
If Close = Open, Volume is neutral
Then you take the 7-day MA of the results.
You can change long to short in the Input Settings
WARNING:
- For purpose educate only
- This script to change bars colors.

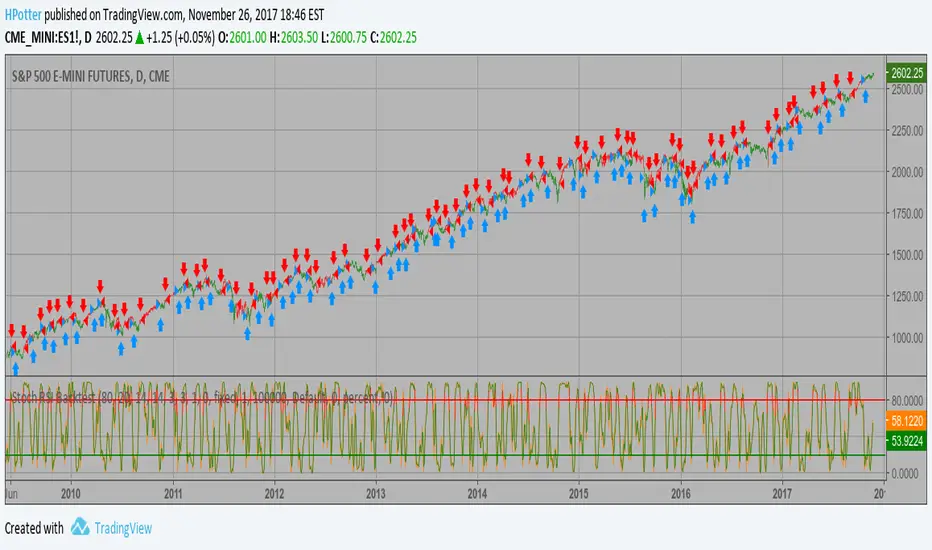
Stochastic RSI Backtest This strategy used to calculate the Stochastic RSI
You can change long to short in the Input Settings
WARNING:
- For purpose educate only
- This script to change bars colors.
Smoothed RSI Backtest ver.2 This is new version of RSI oscillator indicator, developed by John Ehlers.
The main advantage of his way of enhancing the RSI indicator is smoothing
with minimum of lag penalty.
You can change long to short in the Input Settings
WARNING:
- For purpose educate only
- This script to change bars colors.

Smoothed RSI Backtest This is new version of RSI oscillator indicator, developed by John Ehlers.
The main advantage of his way of enhancing the RSI indicator is smoothing
with minimum of lag penalty.
You can change long to short in the Input Settings
WARNING:
- For purpose educate only
- This script to change bars colors.

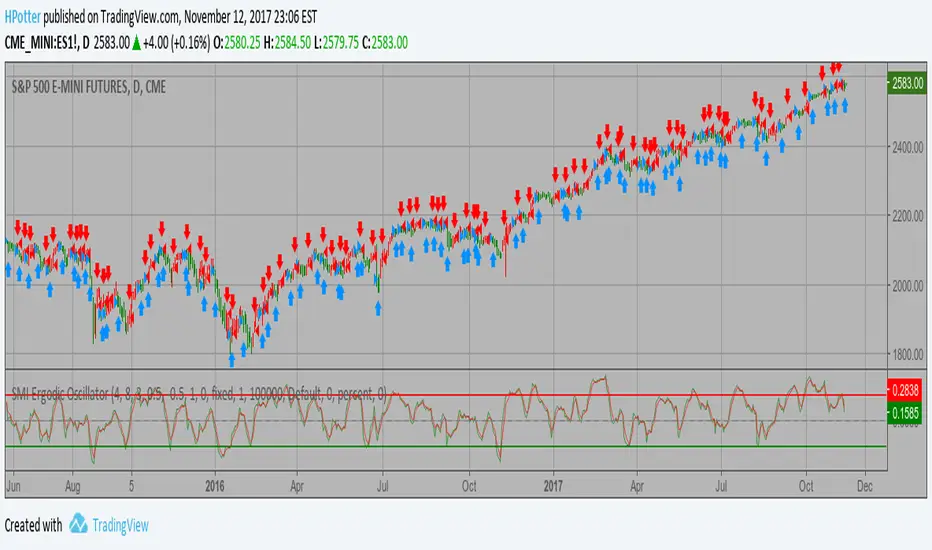
SMI Ergodic Oscillator Backtest ver.2 The SMI Ergodic Indicator is the same as the True Strength Index (TSI) developed by
William Blau, except the SMI includes a signal line. The SMI uses double moving averages
of price minus previous price over 2 time frames. The signal line, which is an EMA of the
SMI, is plotted to help trigger trading signals. Adjustable guides are also given to fine
tune these signals. The user may change the input (close), method (EMA), period lengths
and guide values.
You can use in the xPrice any series: Open, High, Low, Close, HL2, HLC3, OHLC4 and ect...
WARNING:
- For purpose educate only