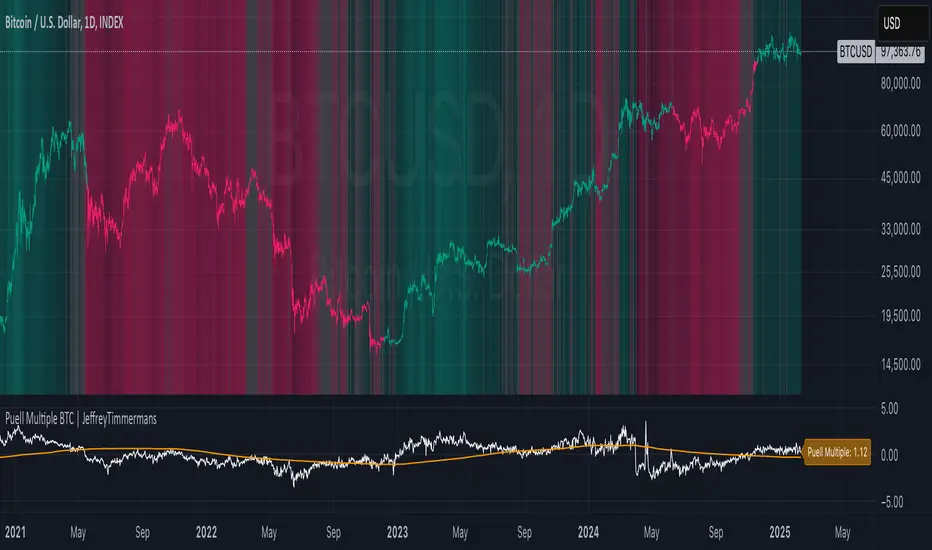
Puell Multiple BTC | JeffreyTimmermansThe Puell Multiple is a metric that assesses the relationship between mining profitability and market cycles. It is calculated by comparing the daily value of newly issued coins (USD) to the 365-day moving average of daily coin issuance (USD).
This indicator works best on the 1D BTC Chart. When interpreting the Puell Multiple, it can generally be understood as follows:
High values indicate that miner profitability is significantly higher than the yearly average. This may lead to an increased incentive for miners to sell off their holdings, putting additional selling pressure on the market.
Low values suggest that miner profitability is lower than the yearly average. In this case, miners might experience financial strain, causing some to reduce their hash power by shutting down mining rigs. This, in turn, can reduce the number of coins being sold into the market, as remaining miners need to liquidate fewer coins to maintain operations, thereby decreasing the impact on the liquid supply.
The Puell Multiple is a metric used primarily in the cryptocurrency space, specifically for Bitcoin, to assess whether Bitcoin is overvalued or undervalued in relation to its mining rewards. It helps to gauge the profitability of miners and, by extension, to assess market conditions.
Use:
This Puell Multiple is invented for Long-Term, Trend Following Systems.
The Puell Multiple trend can be visualized through the color of the bars, which represents the direction of the trend, while the background indicates the strength of that trend.
Bar Color: The color of the bars typically changes to reflect whether the trend is bullish or bearish. For example, green bars may indicate a strong bullish trend, while red bars signal a bearish or declining trend. The color coding helps to quickly interpret the market's overall movement in relation to mining profitability.
Background Color: The background of the chart is used to reflect the strength of the trend. A darker or more intense background may signify a stronger trend, indicating that the market conditions are more pronounced, while a lighter background can suggest a weaker or more uncertain trend, showing less certainty in the market’s direction.
Together, the combination of bar color and background provides a clearer picture of both the trend's direction and its strength, making it easier to assess potential market behavior based on miner profitability and market cycles.
Puell Multiple and Moving Average: They can be used as an extra tool to confirm the bullish or bearish trend. When the Puell Multiple is above the Moving Average, this will suggest and confirm that the trend is bullish.
How you score this for your own systems is up to you.
-Jeffrey
Miners
Puell Multiple BTC | JeffreyTimmermansThe Puell Multiple is a metric that assesses the relationship between mining profitability and market cycles. It is calculated by comparing the daily value of newly issued coins (USD) to the 365-day moving average of daily coin issuance (USD).
This indicator works best on the 1D BTC Chart. When interpreting the Puell Multiple, it can generally be understood as follows:
High values indicate that miner profitability is significantly higher than the yearly average. This may lead to an increased incentive for miners to sell off their holdings, putting additional selling pressure on the market.
Low values suggest that miner profitability is lower than the yearly average. In this case, miners might experience financial strain, causing some to reduce their hash power by shutting down mining rigs. This, in turn, can reduce the number of coins being sold into the market, as remaining miners need to liquidate fewer coins to maintain operations, thereby decreasing the impact on the liquid supply.
The Puell Multiple is a metric used primarily in the cryptocurrency space, specifically for Bitcoin, to assess whether Bitcoin is overvalued or undervalued in relation to its mining rewards. It helps to gauge the profitability of miners and, by extension, to assess market conditions.
Use:
This Puell Multiple is invented for Long-Term, Trend Following Systems.
The Puell Multiple trend can be visualized through the color of the bars, which represents the direction of the trend, while the background indicates the strength of that trend.
Bar Color: The color of the bars typically changes to reflect whether the trend is bullish or bearish. For example, green bars may indicate a strong bullish trend, while red bars signal a bearish or declining trend. The color coding helps to quickly interpret the market's overall movement in relation to mining profitability.
Background Color: The background of the chart is used to reflect the strength of the trend. A darker or more intense background may signify a stronger trend, indicating that the market conditions are more pronounced, while a lighter background can suggest a weaker or more uncertain trend, showing less certainty in the market’s direction.
Together, the combination of bar color and background provides a clearer picture of both the trend's direction and its strength, making it easier to assess potential market behavior based on miner profitability and market cycles.
Puell Multiple and Moving Average: They can be used as an extra tool to confirm the bullish or bearish trend. When the Puell Multiple is above the Moving Average, this will suggest and confirm that the trend is bullish.
How you score this for your own systems is up to you.
-Jeffrey

Bitcoin Puell Multiple (BPM)The Bitcoin Puell Multiple is a key indicator for evaluating buying and selling opportunities based on the profitability of Bitcoin miners.
The Idea
The Bitcoin Puell Multiple is a ratio that measures the daily profitability of Bitcoin miners in relation to the historical annual average of this profitability. It is calculated by dividing the amount of newly issued Bitcoins (in USD) each day by the 365-day moving average of that same amount. This indicator provides valuable information on Bitcoin's market cycles, helping investors to identify periods when Bitcoin is potentially undervalued or overvalued.
How to Use
To use the Bitcoin Puell Multiple, investors watch for extreme levels of the indicator. A high Puell Multiple suggests that miners are making exceptionally high profits compared to the previous year, which could indicate an overvaluation of Bitcoin and a selling opportunity (red zones). Conversely, a low Puell Multiple indicates that miners' earnings are low relative to history, suggesting an undervaluation of Bitcoin and a potential buying opportunity (green zones). The trigger thresholds for these zones can be configured in the tool's parameters.
What makes this tool different from the other "Puell Multiple" scripts available is that it is up to date in terms of its data sources, with a more precise calculation, and allows you to view the entire history.
Zone trigger limits and their visualization, as well as colors, are all configurable via the tool parameters.
Here, for example, is a configuration with more sensitive trigger levels and a different color:

Blockunity Miners Synthesis (BMS)Track the status of Bitcoin and Ethereum Miners' Netflows and their asset reserves.
The Idea
The goal is to provide a simple tool for visualizing the changes in miners' flows and reserves.
How to Use
Analysing the behaviour of miners enables you to detect long-term opportunities, in particular with the state of reserves, but also in the shorter term with the visualization of Netflows.
Elements
Miners Reserves
Miners Reserves represent the balances of addresses belonging to mining pools (in BTC or ETH).
This data can also be displayed in USD via the indicator parameters:
Miners Netflow
The Netflow is calculated by subtracting the outflows from the inflows originating from addresses associated with mining pools. When this result is negative, it indicates that more funds are exiting the miners' accounts than the funds they are receiving. Consequently, negative miner netflows suggests selling activity.
This data can also be displayed in USD via the indicator parameters. You can also choose the timeframe. For example, selecting "Yearly" will give a Netflow daily average taking into account the last 365 days:
Settings
In the settings, you can first choose which asset to view, between Bitcoin and Ethereum. Here are the reserves of Ethereum miners:
As with Bitcoin, Netflow can also be displayed in the timeframe of your choice. Here you can see the average daily netflow of Ethereum miners in USD over the last 30 days:
Here are all the parameters:
Asset Selector: Choose between Bitcoin or Ethereum miner data.
Get values in USD: Displays values in USD instead of assets.
Switch between Netflow and Reserve : If checked, displays Miners' Reserves data. If unchecked, displays Miners' Netflow data.
Display timeframe: Allows you to select the timeframe for displaying the Netflow plot.
Period Lookback (in days): Select the period to be taken into account when calculating the variation percentage of Miners' Reserves.
Lastly, you can modify all table and labels parameters.

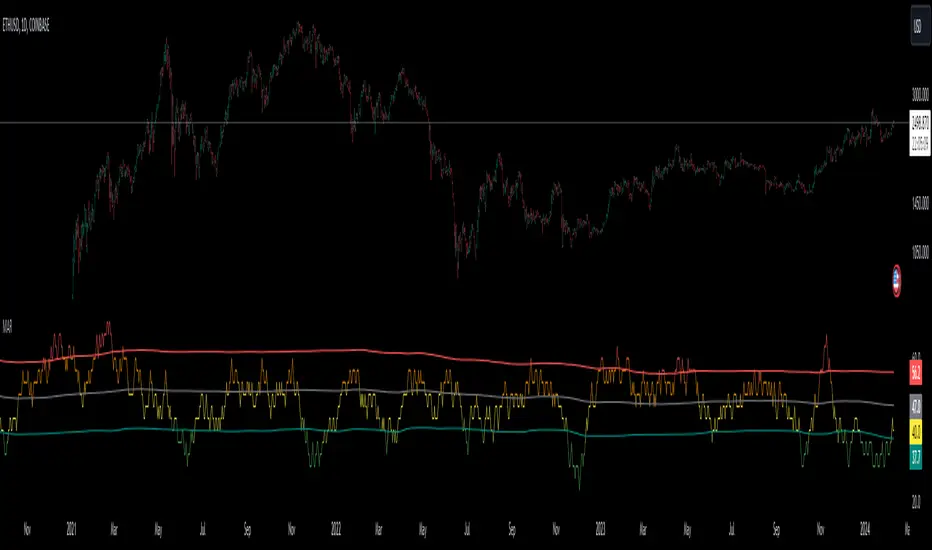
Market Activity Risk"Market Activity Risk" (MAR) - Is a dynamic tool designed to structurize the competitive landscape of blockchain transaction blocks, offering traders a strategic edge in anticipating market movements.
By capturing where market participants are actively buying and selling, the MAR indicator provides insights into areas of high competition, allowing traders to make informed decisions and potentially front-run transactions.
At the heart of this tool are blockchain transaction fees , they can represent daily shifts in transaction fee pressures.
By measuring momentum in fees, we can analyze the urgency and competition among traders to have their transactions processed first. This indicator is particularly good at revealing potential support or resistance zones, areas where traders are likely to defend their positions or increase their stakes, thus serving as critical junctures for strategic decision-making.
Key Features:
Adaptable Standard Deviation Settings: Users have the flexibility to adjust the length of the standard deviation and its multipliers, managing the risk bands to their individual risk tolerance.
Color-Coded Risk Levels: The MAR indicator employs an intuitive color scheme, making it easy to interpret the data at a glance.
Multi-Currency Compatibility: While designed with Bitcoin in mind, the MAR indicator is versatile, functioning effectively across various cryptocurrencies including Ethereum, XRP, and several other major altcoins. This broad compatibility ensures that traders across different market segments can leverage the insights provided by this tool.
Customizable Moving Average: The 730-day moving average setting is thoughtfully chosen to reflect the nuances of a typical cryptocurrency cycle, capturing long-term trends and fluctuations. However, recognizing the diverse needs and perspectives of traders, the indicator allows for the moving average period to be modified.
Bitcoin Miner Extreme SellingThis script is for identifying extreme selling. Judging by the chart, Bitcoin miners often (not always) sell hard for two reasons: to take profit into parabolic price rises, or to stay solvent when the price is very low.
Extreme selling thus often coincides with long-term tops and bottoms in Bitcoin price. This can be a useful EXTRA data point when trying to time long-term Bitcoin spot or crypto equity investment (NOT advice, you remain responsible, etc). The difference between selling measured in BTC and in USD gives a reasonable idea of whether miners are selling to make a profit or to stay solvent.
CREDITS
The idea for using the ratio of miner outflows to reserves comes from the "Bitcoin Miner Sell Pressure" script by the pioneering capriole_charles.
The two request.security calls are identical. Another similarity is that you have to sum the outflows to make it make sense. But it doesn't make much difference, it turns out from testing, to use an average of the reserves, so I didn't. All other code is different.
The script from capriole_charles uses Bollinger bands to highlight periods when sell pressure is high, uses a rolling 30-day sum, and only uses the BTC metrics.
My script uses a configurable 2-6 week rolling sum (there's nothing magical about one month), uses different calculations, and uses BTC, USD, and composite metrics.
INPUTS
Rolling Time Basis : Determines how much data is rolled up. At the lowest level, daily data is too volatile. If you choose, e.g., 1 week, then the indicator displays the relative selling on a weekly basis. Longer time periods, obviously, are smoother but delayed, while shorter time periods are more reactive. There is no "real" time period, only an explicit interpretation.
Show Data > Outflows : Displays the relative selling data, along with a long-term moving average. You might use this option if you want to compare the "real" heights of peaks across history.
Show Data > Delta (the default): Only the difference between the relative selling and the long-term moving average is displayed, along with an average of *that*. This is more signal and less noise.
Base Currency : Configure whether the calculations use BTC or USD as the metric. This setting doesn't use the BTC price at all; it switches the data requested from INTOTHEBLOCK.
If you choose Composite (the default), the script combines BTC and USD together in a relative way (you can't simply add them, as USD is a much bigger absolute value).
In Composite mode, the peaks are coloured red if BTC selling is higher than USD, which usually indicates forced selling, and green if USD is higher, which usually indicates profit-taking. This categorisation is not perfectly accurate but it is interesting insomuch as it is derived from block data and not Bitcoin price.
In BTC or USD mode, a gradient is used to give a rough visual idea of how far from the average the current value is, and to make it look pretty.
USAGE NOTES
Because of the long-term moving averages, the length of the chart does make a difference. I recommend running the script on the longest Bitcoin chart, ticker BLX.
To use it to compare selling with pivots in crypto equities, use a split chart: one BLX with the indicator applied, and one with the equity of your choice. Sync Interval, Crosshair, Time, and Date Range, but not Symbol.

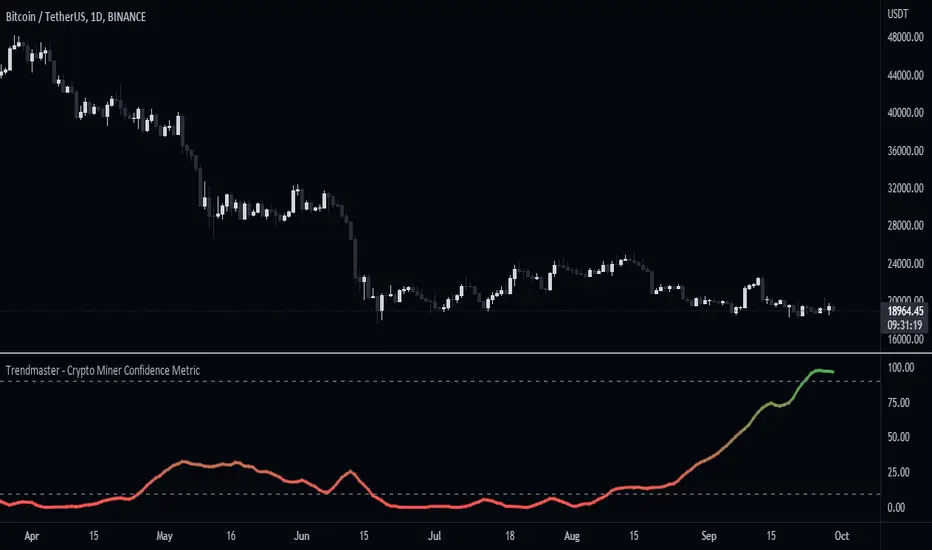
Trendmaster - Crypto Miner Confidence MetricWhat it is:
The Crypto Miner Confidence Metric analyses a handful of highly utilized Crypto networks to gain insight into the potential sentiment amongst those securing them and more specifically Crypto miners.
What it does:
It takes into account the overall trend in the increase or decrease of current computational power securing the networks, otherwise known as the hashrate - as well as the overall network inflows/outflows and holdings of those miners.
How to use it:
Using this data we can conclude whether their stance is currently Bullish or Bearish, with a value of 100 indicating an extremely positive future outlook from miners and a value of 0 representing a severe lack of confidence. Changes or pivots in the direction of miner confidence can indicate a shift in their Bullish or Bearish stance.
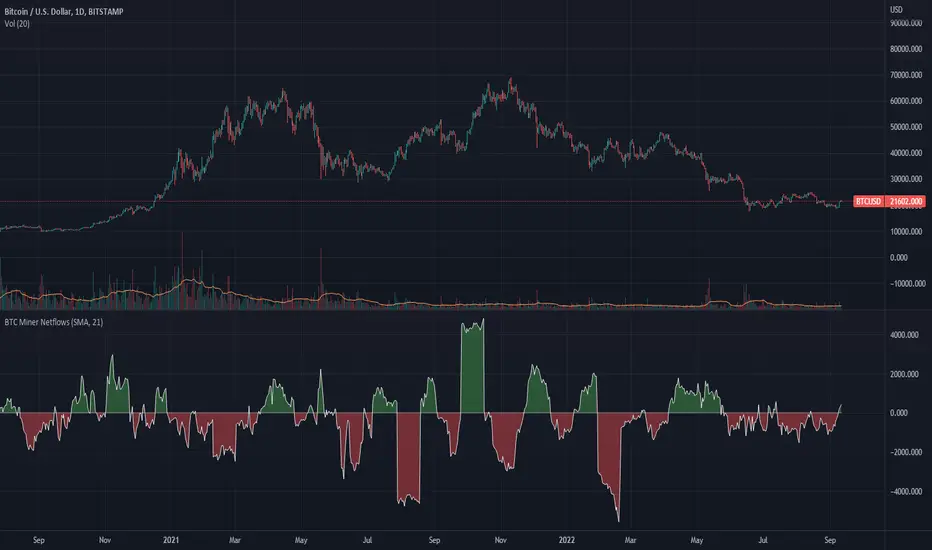
BTC Miner Netflows with smoothingBTC Miner Netflows with smoothing - shows the difference between Miner Inflow and Miner Outflow.
Miner income, sales as well as holdings, are generally considered to have a huge market impact, by analyzing miner Netflows, users can gauge if overall miners are accumulating or selling; high positive values point to accumulation, while negative numbers indicate net selling.
Data queried from IntoTheBlock.
BTC Hashrate ribbonsBTC Hash Rate ribbons / Hash Rate cross
This strategy goes long when BTCs Hash Rate 30 day moving average crosses above the 60 day moving average, signifying that miner capitulation is over and recovery has started.
When the opposite signal is given, which signifies the beginning of miner capitulation, the strategy goes short (or flat, depending on configuration). This is generally considered the most popular Hash Rate related strategy.
The strategy is based on this medium article: medium.com
Thanks to the recent integration of IntoTheBlock data into Tradingview, we can now effortlessly show Hash Rate data on our chart,
keep in mind however, that IntoTheBlock doesn't provide Hash Rate data on timeframes below daily, so this strategy is based used on the daily, weekly or even monthly time frames.
Hash Rate definition:
The Bitcoin hash rate is the number of times per second that computers on the Bitcoin network are hashing data to verify transactions and perform the encryption that secures the network. The hash rate is an indicator of how healthy the Bitcoin network is at any given time, and is driven primarily by difficulty mining and the number of miners. Generally, a high hash rate is considered a good thing.
More precisely, the Bitcoin hash rate is the number of times per second that computers on the Bitcoin network are hashing data to verify transactions and perform the encryption that secures the network.

BTC Hashrate with smoothingBTC Hashrate with smoothing - thanks to the recent integration of IntoTheBlock data into Tradingview, we can now effortlessly show Hashrate data on our chart.
One popular use for Hashrate is to buy when the 30 day moving average crosses above the 60 day moving average, signifying that miner capitulation is over and recovery has started.
Definition
The Bitcoin hash rate is the number of times per second that computers on the Bitcoin network are hashing data to verify transactions and perform the encryption that secures the network. The hash rate is an indicator of how healthy the Bitcoin network is at any given time, and is driven primarily by difficulty mining and the number of miners. Generally, a high hash rate is considered a good thing.
More precisely, the Bitcoin hash rate is the number of times per second that computers on the Bitcoin network are hashing data to verify transactions and perform the encryption that secures the network.

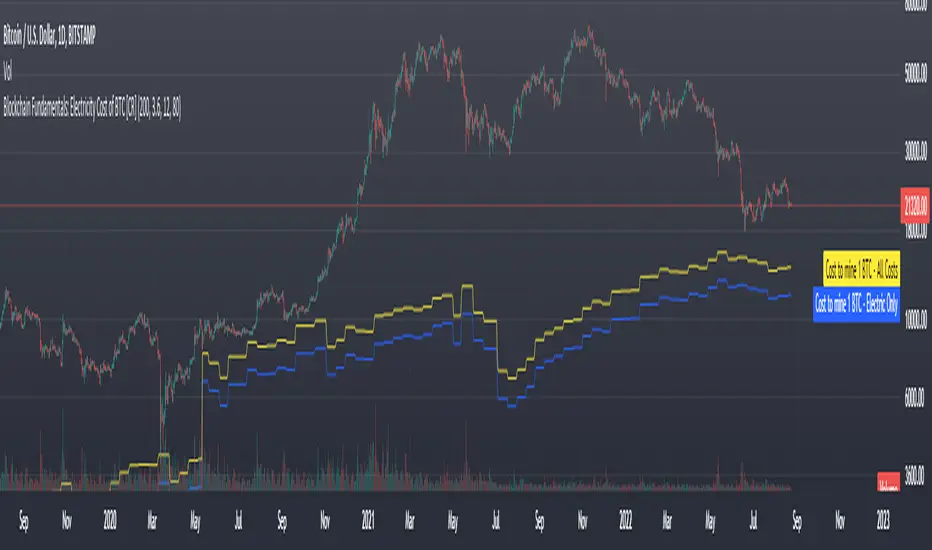
Blockchain Fundamentals: Electricity Cost of BTC [CR] Blockchain Fundamentals: Electricity Cost of BTC
After a hiatus, now a return to publishing tools and scripts for the community. This is my first script in over and year, and I have a number more coming soon as well! (so Stay Tuned!)
This is a simple calculator to estimate the cost of Bitcoin miners to mine one bitcoin. It works on all timeframes (doesnt have to be on daily).
By entering the inputs of total TH's, kWh used, cost of electricity per kWh (in USD cents) we can generate the electricity cost.
But miners also have other costs of operation including HVAC, maintenance, rent, etc. In light of that we include a multiplier that accounts for these extra costs. First, type in what percent of your total operating costs come from the electricity. Then check the enable total cost plot option and you will also see total costs in addition to electricity costs.
Its a simple model and gives anyone curious a starting point for their own testing and research.
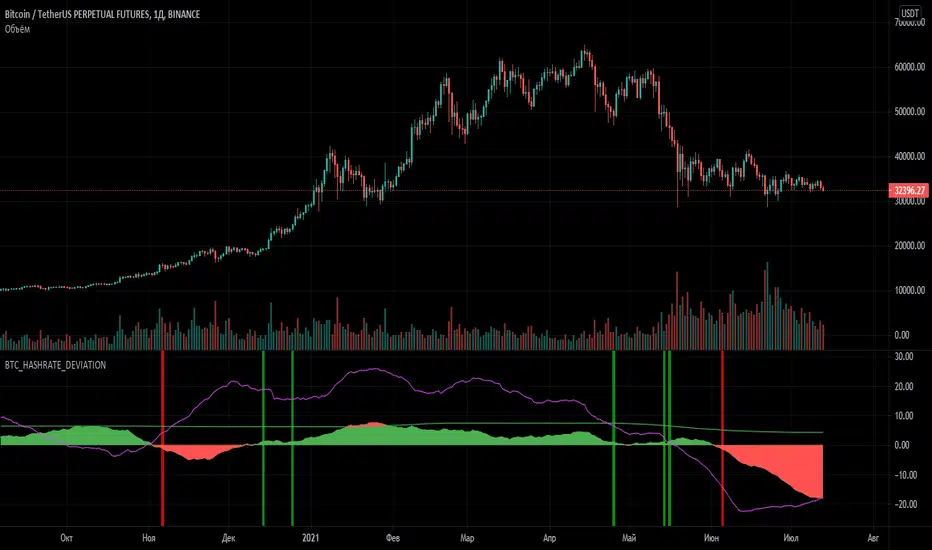
BTC_HASHRATE_DEVIATIONThe indicator shows the deviation of the hashrate in the Bitcoin network from its average value for the selected period. This indicator should be used on TF=1D.
When the hashrate drops below zero, you should look for points to buy Bitcoin , because after a decrease in the hashrate, the price of Bitcoin most often follows an increase.
Also in the indicator there is a line of deviation of the amount of remuneration of miners from its average value for the period that is set in the settings.
If we see a formed reversal in the part below the zero mark, we should buy bitcoin , since a low reward is not profitable for miners and its growth usually coincides with the rpost of the Bitcoin price.
Also on the chart there is a line of the average maximum by the value of the hashrate deviation and when the histogram intersects with this line, it indicates a likely "overheating" and you should closely monitor the price, since the hashrate is likely to fall, and with it the Bitcoin price.
If you have any questions, you can write to me in private messages or in Telegrams (the address is in my signature).
-----------------------------------------------
Индикатор отображает отклонение хэшрейта в сети Биткоин от его усредненного значения за выбранный период. Данный индикатор следует применять на ТФ=1день.
При снижении хэшрейта ниже нулевой отметки следует искать точки для покупки Биткоина, поскольку после снижения хэшрейта чаще всего следует рост цены Биткоина.
Также в индикаторе присутствует линия отклонения суммы вознаграждения майнеров от своего среднего значения за период, который задаётся в настройках.
Если мы видим сформировавшийся разворот в части ниже нулевой отметки, следует покупать биткоин, поскольку низкое вознаграждение не выгодно для майнеров и его рост обычно совпадает с ростом цены на Биткоин.
Также на графике есть линия среднего максимума по значению отклонения хешрейта и когда гистограмма пересекается с этой линией, это говорит о вероятном "перегреве" и следует внимательно следить за ценой, поскольку вероятно падение хэшрейта, а вместе с ним и цены Биткоина.
По всем вопросам Вы можете писать мне в личные сообщения, либо в Telegram (адрес в моей подписи).
[5F] Bitcoin Hash Rate + Miners revenue-═════════════════════════-
📋 Description :
This script display the Bitcoin' Hash Rate and the Miners revenue based on the data provided by Quandl.
Hashrate is displayed in TH/s : trillion hashes per second with an moving average.
Miners revenue is calculated by : (the number of bitcoins mined per day + transaction fees) * market price
The dates of previous halving are also displayed.
🛠 Note :
There is a multiplier on the miners revenue that you can configurate. It's only used to bring the 2 curves closer together for better visibility but the multiplier don't affect the revenue's data.
You can choose between different types of moving average for the hashrate's signal : SMA, EMA, DEMA, TEMA, WMA, VWMA or TMA.
You can show and hide each elements of the indicator
Thanks to all Pinecoders who share their work with the community.
-═════════════════════════-

[5F] Total circulating Bitcoin-═════════════════════════-
📋 Description :
This script displays several informations about Bitcoin :
the maximum number of Bitcoin
number of mined BTC
number of unmined BTC
calcul them in %
shows the previous halving date
📆 Note : need to be in dayli resolution or higher
Thanks to all Pinecoders who share their work with the community.
-═════════════════════════-

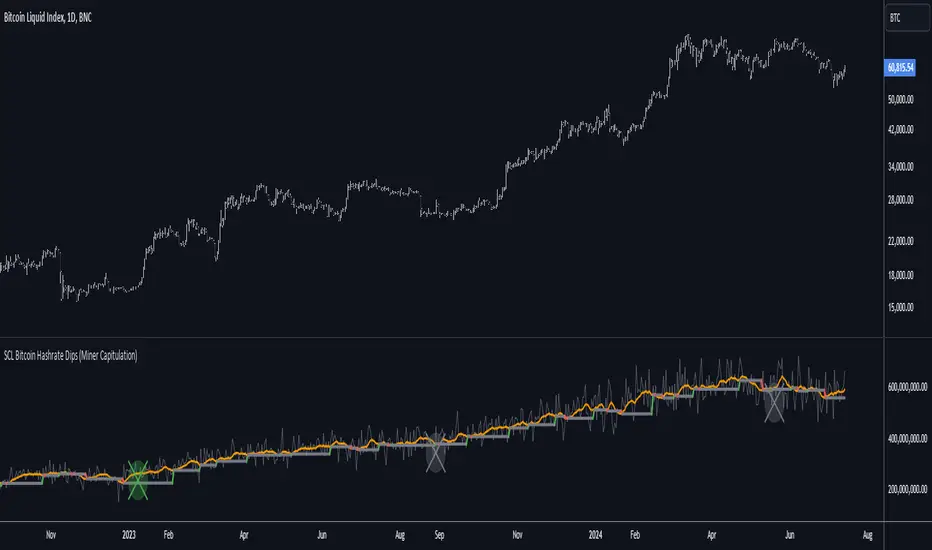
[SCL] Bitcoin Hashrate Dips (Miner Capitulation)Gives long-term buy signals for Bitcoin from dips and recoveries in the hashrate (the "miner capitulation" theory). It has an overlay and a standalone mode and is fully configurable. It uses Williams Lows and ATR instead of moving averages.
Features that might be interesting for Pinescripters:
+ Automatic (as far as is possible currently) adjustment of plots for overlay and standalone display modes.
+ A neat label function for debugging floats
+ Fully commented
+ The debug that I used to overcome problems in developing it is left in
+ Ideas for how to deal with a wildly oscillating and exponentially increasing data source
You need to run this indicator on the Bitcoin daily chart for it to make any sense. The best is a BTC/USD chart with a long history, such as BNC:BLX.
BITCOIN Miners Revenue VS Price Correlation OscillatorUse 3D(3-day candle) as timeframe for best reading.
------
original template for Correlation indicator was created by obaranova. credit goes to her.

Smooth Hash RibbonsSame as the popular hash ribbon indicator, but slightly more responsive and with a better smoothing kernel.

Hash RibbonsBuying during Miner Capitulation yields wonderful returns.
The best buy signals occur on Hash Rate "recovery", and when price momentum is also positive.
Historically, this strategy has yielded average returns to cycle peak of >5000%, with max Drawdown of -15%.
Follow me to learn more about this indicator.

Bitcoin Difficulty RibbonThe Bitcoin Difficulty Ribbon is based on Willy Woo's implementation and it gauges the selling pressure experienced by Bitcoin miners.
The Bitcoin Network Difficulty is a measure of how complicated it is to find the next block, compared to the ease of finding the easiest possible one.
When the difficulty decreases it's a hint that the mining sector is experiencing difficulties and the longer it contracts, the more miners might get out of business.
During these contracting times, the Difficulty Ribbon narrows and becomes a significant proxy to recognize cycle bottoms.
Default settings: Daily Time Frame and SMA mode.
Credit: Willy Woo

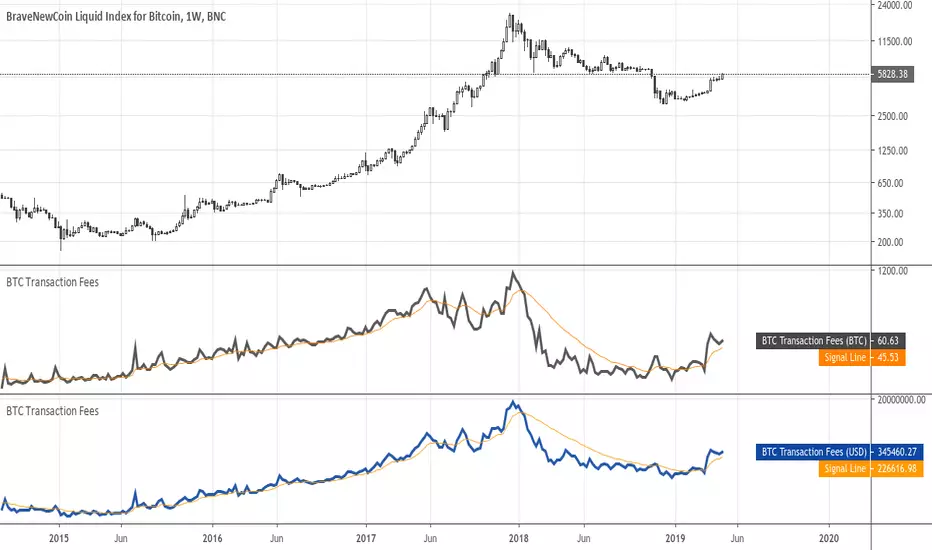
Bitcoin Transaction FeesThe Bitcoin Transaction Fees is the fee value that miners earn on a daily basis.
The indicator can show the value either in BTC or USD.
Bitcoin Cost of Transaction (%)The Bitcoin Relative Cost of Transaction shows the miners' revenue as a percentage of the transaction volume registered in the block.

Bitcoin Cost per Transaction (USD)The Bitcoin Cost per Transaction (USD) is the result of dividing the miners' revenue (Block Reward + Transaction Fees) between the number of transactions per block.
Here is an example with made up numbers:
Block reward is 12.5 BTC + 0.5 BTC in transaction fees.
There are 2700 transactions in the block.
Current exchange rate is 5700 USD/BTC.
(12.5 BTC + 0.5 BTC) / 2700 transactions = 0.00481481 BTC per transaction
5700 USD/BTC * 0.00481481 BTC per transaction = $27.44 per transaction
Hope that helps!
