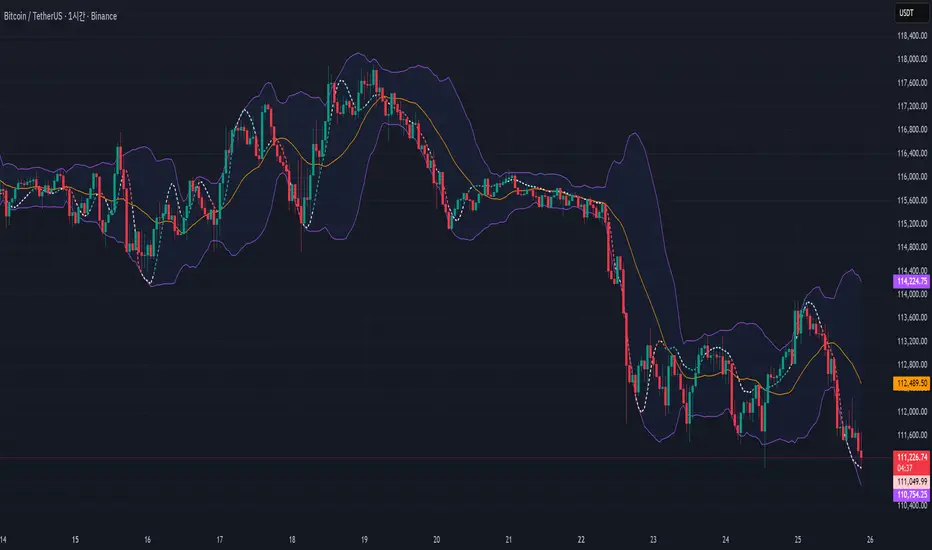
WaveMacBollI wanted to see the two indicators in the candle chart, not in a separate window. And within the Bollinger band, it seemed to put it fine.
Important Note on Line Styles
Due to TradingView's multi-timeframe environment restrictions (timeframe = '', timeframe_gaps = true), I couldn't implement dotted or dashed line styles programmatically. The indicator uses solid lines by default.
If you prefer dotted/dashed lines for better visual distinction:
Add the indicator to your chart
Click on the indicator settings (gear icon)
Go to "Style" tab
Manually change line styles for each plot
Unfortunately, PineScript doesn't support line.new() or similar drawing functions in multi-timeframe mode, limiting our styling options to basic plot styles.
If you know a good solution for implementing dotted/dashed lines in multi-timeframe indicators without using drawing objects, please share it in the comments! I'd love to improve this aspect of the indicator
Multitimeframe
Volume-Weighted RSI & Multi-Normalized MACD### Description for Publishing: Volume-Weighted RSI & Multi-Normalized MACD
**Overview**
The "Volume-Weighted RSI & Multi-Normalized MACD" indicator is a powerful and versatile tool designed for traders seeking enhanced momentum and trend analysis. Combining a volume-weighted Relative Strength Index (VW-RSI) with a customizable Moving Average Convergence Divergence (MACD) featuring multiple normalization methods, this indicator provides deep insights into market dynamics. It supports multi-timeframe (MTF) analysis and includes an optional stepped plotting mode for discrete signal visualization, making it ideal for both trend-following and mean-reversion strategies across various markets (stocks, forex, crypto, etc.).
**Key Features**
1. **Volume-Weighted RSI (VW-RSI)**:
- A modified RSI that incorporates trading volume for greater sensitivity to market activity.
- Normalized to a user-defined range (default: -50 to +50) for consistent analysis.
- Optional smoothing with multiple moving average types (SMA, EMA, WMA, VWMA, SMMA, or SMA with Bollinger Bands) to reduce noise and highlight trends.
- Overbought (+20) and oversold (-20) levels for quick reference.
2. **Multi-Normalized MACD**:
- Offers six normalization methods for MACD, allowing traders to tailor the output to their strategy:
- Normalized Volume Weighted MACD (unbounded).
- Min-Max Normalization (bounded).
- Volatility Normalization (unbounded, volatility-adjusted).
- Volatility Normalization with Min-Max (bounded).
- Hyperbolic Tangent Normalization (bounded).
- Arctangent Normalization (bounded).
- Min-Max with Smoothing (bounded).
- All bounded methods scale to the user-defined range (default: -50 to +50), ensuring comparability with VW-RSI.
- Dynamic color changes for MACD line (lime/red) and histogram (aqua/blue/red/maroon) based on momentum and signal line crosses.
3. **Stepped Plotting Mode**:
- Optional mode to plot RSI and MACD as discrete, stepped lines, reducing noise by only updating when values change significantly (configurable thresholds).
- Ideal for traders focusing on clear, actionable signal changes.
4. **Multi-Timeframe Support**:
- Configurable timeframe input (default: chart timeframe) for analyzing RSI and MACD on higher or lower timeframes, enhancing cross-timeframe strategies.
5. **Customizable Display**:
- Toggle options to show/hide MACD line, signal line, histogram, and cross dots.
- Bollinger Bands for RSI smoothing (optional) with adjustable standard deviation multiplier.
- Clear visual cues with horizontal lines for overbought/oversold levels, midline, and MACD bounds.
**Usage Instructions**
1. **Add to Chart**: Apply the indicator to any symbol (e.g., BTCUSD, SPY) on any timeframe (1H, 1D, etc.).
2. **Configure Settings**:
- **General**: Adjust `Lower Bound` (-50 default) and `Upper Bound` (+50 default) for the output range. Set `Timeframe` for MTF analysis. Enable `Stepped?` for discrete plotting.
- **RSI**: Choose `Price Source` (default: ohlc4), `RSI Length` (default: 9), and smoothing options (e.g., EMA, Bollinger Bands). Adjust `RSI Diff Threshold` for stepped mode.
- **MACD**: Select `Price Source`, `Fast Length` (9), `Slow Length` (21), `Signal Length` (9), and a normalization method (default: Volatility Min-Max). Adjust `MACD Diff Threshold` for stepped mode.
- **Display Options**: Toggle MACD components and histogram colors for clarity.
3. **Interpretation**:
- **VW-RSI**: Watch for crosses above +20 (overbought) or below -20 (oversold) for potential reversals. Use smoothed RSI or Bollinger Bands for trend confirmation.
- **MACD**: Look for MACD/Signal line crosses (dots indicate crossings) and histogram changes for momentum shifts. Bounded normalizations align with RSI for unified analysis.
- **Stepped Mode**: Focus on significant changes in RSI/MACD for clearer signals.
4. **Companion Overlay**: For visualization on the main price chart, use the companion script "VW-RSI & MACD Price Overlay" (available separately, requires this script to be published). It plots RSI and MACD as price-scaled echo lines, with toggles to show/hide and customizable scaling (high/low or ATR).
**Who Is This For?**
- **Trend Traders**: Use MACD normalizations and MTF to identify momentum shifts across timeframes.
- **Mean-Reversion Traders**: Leverage VW-RSI’s overbought/oversold signals for entry/exit points.
- **Technical Analysts**: Customize normalization and smoothing to match specific market conditions.
- **All Markets**: Works on stocks, forex, cryptocurrencies, and more, with any timeframe.
**Notes**
- Unbounded MACD normalizations (`enable_nvw`, `enable_vol`) may produce values outside -50/+50, suitable for volatility-focused strategies.
- For price chart overlay, publish this script and use its ID in the companion script’s `request.security` call.
- Adjust scaling inputs in the companion script for optimal visualization on volatile or stable assets.
**Author’s Note**
Developed by NEPOLIX, this indicator combines volume-weighted precision with flexible normalization for robust technical analysis. Feedback and suggestions are welcome to enhance future versions!


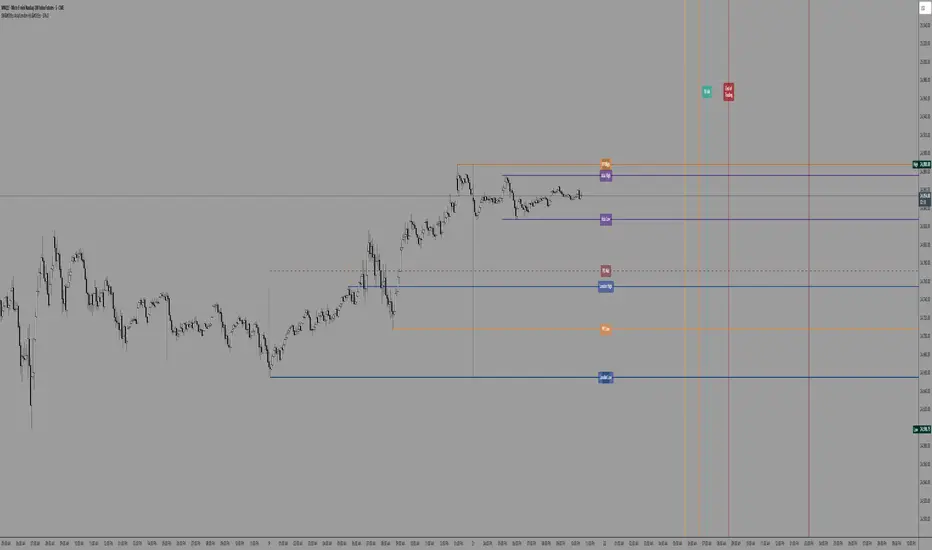
cd_bsl_ssl_CxGeneral
This indicator is designed to show the levels where stop-loss orders from buyers and sellers are most likely clustered.
Swing levels formed on the aligned higher time frame (HTF) are displayed on the chart as Buy Side Liquidity (BSL) and Sell Side Liquidity (SSL).
________________________________________
Menu & Usage
• HTF Selection:
o In “Auto” mode, the HTF is selected automatically.
o In “Manual” mode, the user can choose the HTF themselves.
• Bar Control:
By adjusting the bar control value, the user can define the number of bars required for a valid BSL or SSL sweep.
This option helps keep the number of alerts under control.
________________________________________
I’d be happy to hear your feedback and suggestions.
Happy trading! 🎉

One White Soldier & One Black Crow DetectorOne white soldier & one black crow.
Blue and yellow highlights

Elliott Wave Auto (Impulse + Correction) — stable deleteAutomatic pivot detection: The script identifies swing highs and swing lows using ta.pivothigh and ta.pivotlow.
Impulse wave labeling (1–5):
Detects 5 alternating pivots and labels them as waves 1 to 5.
Uses green/red labels for impulse and correction legs.
Connects waves with blue lines for visual clarity.
Corrective wave labeling (A–B–C):
Detects the next 3 alternating pivots after wave 5.
Labels them as A, B, C with orange lines connecting them.
Dynamic cleanup:
Stores labels and lines in arrays.
Deletes previous drawings automatically before redrawing, keeping the chart clean.
Optional pivot markers:
Plots tiny triangles for detected pivots (green for lows, red for highs).
Information table:
Displays the direction (Bullish/Bearish) and percentage move of the 1–5 impulse waves.
Pine Script v5 compliant:
Uses str.tostring() and array-based deletion to avoid tostring() or line.deleteall() errors.
If you want, I can also add an alert feature to notify you when a full impulse + corrective wave pattern completes. This makes it actionable for trading.

Vortag High/LowThe script displays the previous day's high/low during trading hours from 9:30 to 16:00 EST. This gives us a clean chart.

MTF EMA Smooth Indicator By : KaizenotradingPH (Open Source)This indicator script can display three different timeframe MTF EMA indicators simultaneously. The special thing of this script is that it has smoothing feature that can smooth the MTF EMA but only in minutes and hours timeframe (script limitation). You can enable the anti repainting as well which reference the previous bar. These features are useful for customize strategies scripts to avoid repainting. Additionally, this script have customizable length for the three MTF EMA indicators.
This is the open source version of the script.

EvoTrend-X Indicator — Evolutionary Trend Learner ExperimentalEvoTrend-X Indicator — Evolutionary Trend Learner
NOTE: This is an experimental Pine Script v6 port of a Python prototype. Pine wasn’t the original research language, so there may be small quirks—your feedback and bug reports are very welcome. The model is non-repainting, MTF-safe (lookahead_off + gaps_on), and features an adaptive (fitness-based) candidate selector, confidence gating, and a volatility filter.
⸻
What it is
EvoTrend-X is adaptive trend indicator that learns which moving-average length best fits the current market. It maintains a small “population” of fast EMA candidates, rewards those that align with price momentum, and continuously selects the best performer. Signals are gated by a multi-factor Confidence score (fitness, strength vs. ATR, MTF agreement) and a volatility filter (ATR%). You get a clean Fast/Slow pair (for the currently best candidate), optional HTF filter, a fitness ribbon for transparency, and a themed info panel with a one-glance STATUS readout.
Core outputs
• Selected Fast/Slow EMAs (auto-chosen from candidates via fitness learning)
• Spread cross (Fast – Slow) → visual BUY/SELL markers + alert hooks
• Confidence % (0–100): Fitness ⊕ Distance vs. ATR ⊕ MTF agreement
• Gates: Trend regime (Kaufman ER), Volatility (ATR%), MTF filter (optional)
• Candidate Fitness Ribbon: shows which lengths the learner currently prefers
• Export plot: hidden series “EvoTrend-X Export (spread)” for downstream use
⸻
Why it’s different
• Evolutionary learning (on-chart): Each candidate EMA length gets rewarded if its slope matches price change and penalized otherwise, with a gentle decay so the model forgets stale regimes. The best fitness wins the right to define the displayed Fast/Slow pair.
• Confidence gate: Signals don’t light up unless multiple conditions concur: learned fitness, spread strength vs. volatility, and (optionally) higher-timeframe trend.
• Volatility awareness: ATR% filter blocks low-energy environments that cause death-by-a-thousand-whipsaws. Your “why no signal?” answer is always visible in the STATUS.
• Preset discipline, Custom freedom: Presets set reasonable baselines for FX, equities, and crypto; Custom exposes all knobs and honors your inputs one-to-one.
• Non-repainting rigor: All MTF calls use lookahead_off + gaps_on. Decisions use confirmed bars. No forward refs. No conditional ta.* pitfalls.
⸻
Presets (and what they do)
• FX 1H (Conservative): Medium candidates, slightly higher MinConf, modest ATR% floor. Good for macro sessions and cleaner swings.
• FX 15m (Active): Shorter candidates, looser MinConf, higher ATR% floor. Designed for intraday velocity and decisive sessions.
• Equities 1D: Longer candidates, gentler volatility floor. Suits index/large-cap trend waves.
• Crypto 1H: Mid-short candidates, higher ATR% floor for 24/7 chop, stronger MinConf to avoid noise.
• Custom: Your inputs are used directly (no override). Ideal for systematic tuning or bespoke assets.
⸻
How the learning works (at a glance)
1. Candidates: A small set of fast EMA lengths (e.g., 8/12/16/20/26/34). Slow = Fast × multiplier (default ×2.0).
2. Reward/decay: If price change and the candidate’s Fast slope agree (both up or both down), its fitness increases; otherwise decreases. A decay constant slowly forgets the distant past.
3. Selection: The candidate with highest fitness defines the displayed Fast/Slow pair.
4. Signal engine: Crosses of the spread (Fast − Slow) across zero mark potential regime shifts. A Confidence score and gates decide whether to surface them.
⸻
Controls & what they mean
Learning / Regime
• Slow length = Fast ×: scales the Slow EMA relative to each Fast candidate. Larger multiplier = smoother regime detection, fewer whipsaws.
• ER length / threshold: Kaufman Efficiency Ratio; above threshold = “Trending” background.
• Learning step, Decay: Larger step reacts faster to new behavior; decay sets how quickly the past is forgotten.
Confidence / Volatility gate
• Min Confidence (%): Minimum score to show signals (and fire alerts). Raising it filters noise; lowering it increases frequency.
• ATR length: The ATR window for both the ATR% filter and strength normalization. Shorter = faster, but choppier.
• Min ATR% (percent): ATR as a percentage of price. If ATR% < Min ATR% → status shows BLOCK: low vola.
MTF Trend Filter
• Use HTF filter / Timeframe / Fast & Slow: HTF Fast>Slow for longs, Fast threshold; exit when spread flips or Confidence decays below your comfort zone.
2) FX index/majors, 15m (active intraday)
• Preset: FX 15m (Active).
• Gate: MinConf 60–70; Min ATR% 0.15–0.30.
• Flow: Focus on session opens (LDN/NY). The ribbon should heat up on shorter candidates before valid crosses appear—good early warning.
3) SPY / Index futures, 1D (positioning)
• Preset: Equities 1D.
• Gate: MinConf 55–65; Min ATR% 0.05–0.12.
• Flow: Use spread crosses as regime flags; add timing from price structure. For adds, wait for ER to remain trending across several bars.
4) BTCUSD, 1H (24/7)
• Preset: Crypto 1H.
• Gate: MinConf 70–80; Min ATR% 0.20–0.35.
• Flow: Crypto chops—volatility filter is your friend. When ribbon and HTF OK agree, favor continuation entries; otherwise stand down.
⸻
Reading the Info Panel (and fixing “no signals”)
The panel is your self-diagnostic:
• HTF OK? False means the higher-timeframe EMAs disagree with your intended side.
• Regime: If “Chop”, ER < threshold. Consider raising the threshold or waiting.
• Confidence: Heat-colored; if below MinConf, the gate blocks signals.
• ATR% vs. Min ATR%: If ATR% < Min ATR%, status shows BLOCK: low vola.
• STATUS (composite):
• BLOCK: low vola → increase Min ATR% down (i.e., allow lower vol) or wait for expansion.
• BLOCK: HTF filter → disable HTF or align with the HTF tide.
• BLOCK: confidence → lower MinConf slightly or wait for stronger alignment.
• OK → you’ll see markers on valid crosses.
⸻
Alerts
Two static alert hooks:
• BUY cross — spread crosses up and all gates (ER, Vol, MTF, Confidence) are open.
• SELL cross — mirror of the above.
Create them once from “Add Alert” → choose the condition by name.
⸻
Exporting to other scripts
In your other Pine indicators/strategies, add an input.source and select EvoTrend-X → “EvoTrend-X Export (spread)”. Common uses:
• Build a rule: only trade when exported spread > 0 (trend filter).
• Combine with your oscillator: oscillator oversold and spread > 0 → buy bias.
⸻
Best practices
• Let it learn: Keep Learning step moderate (0.4–0.6) and Decay close to 1.0 (e.g., 0.99–0.997) for smooth regime memory.
• Respect volatility: Tune Min ATR% by asset and timeframe. FX 1H ≈ 0.10–0.20; crypto 1H ≈ 0.20–0.35; equities 1D ≈ 0.05–0.12.
• MTF discipline: HTF filter removes lots of “almost” trades. If you prefer aggressive entries, turn it off and rely more on Confidence.
• Confidence as throttle:
• 40–60%: exploratory; expect more signals.
• 60–75%: balanced; good daily driver.
• 75–90%: selective; catch the clean stuff.
• 90–100%: only A-setups; patient mode.
• Watch the ribbon: When shorter candidates heat up before a cross, momentum is forming. If long candidates dominate, you’re in a slower trend cycle.
⸻
Non-repainting & safety notes
• All request.security() calls use lookahead=barmerge.lookahead_off, gaps=barmerge.gaps_on.
• No forward references; decisions rely on confirmed bar data.
• EMA lengths are simple ints (no series-length errors).
• Confidence components are computed every bar (no conditional ta.* traps).
⸻
Limitations & tips
• Chop happens: ER helps, but sideways microstructure can still flicker—use Confidence + Vol filter as brakes.
• Presets ≠ oracle: They’re sensible baselines; always tune MinConf and Min ATR% to your venue and session.
• Theme “Auto”: Pine cannot read chart theme; “Auto” defaults to a Dark-friendly palette.
⸻
Publisher’s Screenshots Checklist
1) FX swing — EURUSD 1H
• Preset: FX 1H (Conservative)
• Params: MinConf=70, ATR Len=14, Min ATR%=0.12, MTF ON (TF=4H, 20/50)
• Show: Clear BUY cross, STATUS=OK, green regime background; Fitness Ribbon visible.
2) FX intraday — GBPUSD 15m
• Preset: FX 15m (Active)
• Params: MinConf=60, ATR Len=14, Min ATR%=0.20, MTF ON (TF=60m)
• Show: SELL cross near London session open. HTF lines enabled (translucent).
• Caption: “GBPUSD 15m • Active session sell with MTF alignment.”
3) Indices — SPY 1D
• Preset: Equities 1D
• Params: MinConf=60, ATR Len=14, Min ATR%=0.08, MTF ON (TF=1W, 20/50)
• Show: Longer trend run after BUY cross; regime shading shows persistence.
• Caption: “SPY 1D • Trend run after BUY cross; weekly filter aligned.”
4) Crypto — BINANCE:BTCUSDT 1H
• Preset: Crypto 1H
• Params: MinConf=75, ATR Len=14, Min ATR%=0.25, MTF ON (TF=4H)
• Show: BUY cross + quick follow-through; Ribbon warming (reds/yellows → greens).
• Caption: “BTCUSDT 1H • Momentum break with high confidence and ribbon turning.”

SW's Asia/London H/L'sAccurate Asia and London (with other session) High's and Low's. As well as NY Pre-market and opening bell, and end of day vertical lines. Also created 4 slots in UI to be able to set specific vertical lines with custom label options.
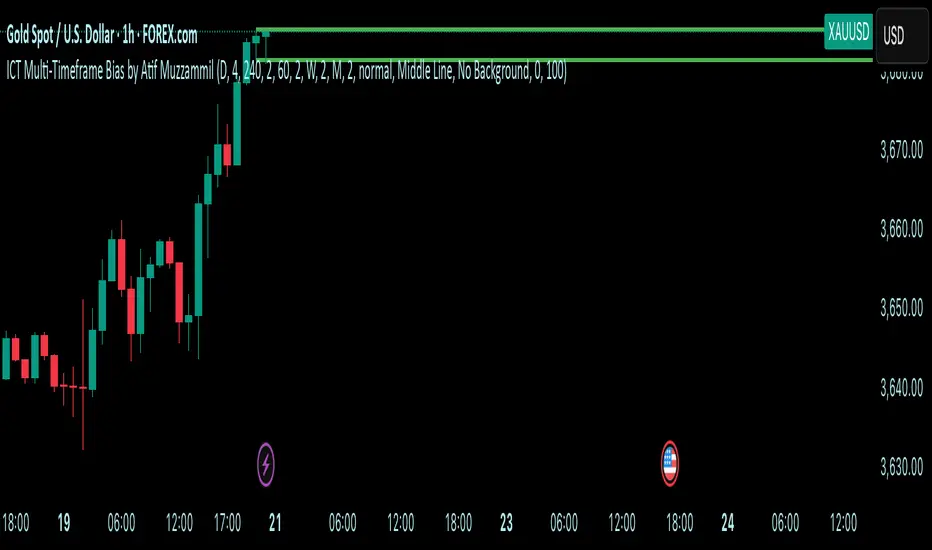
Multi-Timeframe Bias by Atif MuzzammilMulti-Timeframe Bias Indicator
This indicator implements multi TF bias concepts across multiple timeframes simultaneously. It identifies and displays bias levels.
Key Features:
Multi-Timeframe Analysis (Up to 5 Timeframes)
Supports all major timeframes: 5m, 15m, 30m, 1H, 4H, Daily, Weekly, Monthly
Each timeframe displays independently with customisable colors and line weights
Clean visual separation between different timeframe bias levels
ICT Bias Logic
Bearish Bias: Previous period close below the prior period's low
Bullish Bias: Previous period close above the prior period's high
Ranging Bias: Previous period close within the prior period's range
Draws horizontal lines at previous period's high and low levels
Advanced Customisation
Individual enable/disable for each timeframe
Custom colors and line thickness per timeframe
Comprehensive label settings with 4 position options
Adjustable label size, style (background/no background/text only)
Horizontal label positioning (0-100%) for optimal placement
Vertical offset controls for fine-tuning
Smart Detection
Automatic timeframe change detection using multiple methods
Enhanced detection for 4H, Weekly, and Monthly periods
Works correctly when viewing same timeframe as bias timeframe
Proper handling of market session boundaries
Clean Interface
Simple timeframe identification labels
Non-intrusive design that doesn't obstruct price action
Organized settings grouped by function
Debug mode available for troubleshooting
Compatible with all chart timeframes and works on any market that follows standard session timing.
Apex Edge – HTF Overlay Candles“Trade your 5m chart with the eyes of the 1H — Apex Edge brings higher-timeframe structure and liquidity sweeps directly onto your execution chart.”
Apex Edge – HTF Overlay Candles
The Apex Edge – HTF Overlay Candles indicator overlays higher-timeframe (HTF) candles directly onto your lower-timeframe chart. Instead of flipping between timeframes, you see HTF structure “breathe” live on your execution chart.
What It Does
• HTF Body Boxes → open/close zones drawn as semi-transparent rectangles.
• HTF Wick Boxes → high/low extremes projected as envelopes around each body.
• Midpoint Line → a dynamic equilibrium line that flips bias as price trades above or below.
• Sweep Arrows → one-time markers showing the first liquidity raid at HTF highs or lows.
Under the Hood
This isn’t just a visual overlay — it’s engineered for accuracy and performance in PineScript.
1. HTF Data Retrieval
• Uses request.security() to import open, high, low, close, time from any selected HTF.
• lookahead=barmerge.lookahead_off ensures OHLC values update bar by bar as the HTF
candle builds.
• When the HTF bar closes, boxes and midpoint lock to historical values — matching the
native HTF chart exactly.
2. Box Construction
• Body box: built from HTF open → close.
• Wick box: built from HTF high → low.
• Boxes extend dynamically across each HTF period, updating in real time, then freeze at
close.
3. Midpoint Logic
• (htfOpen + htfClose) / 2 calculates intrabar midpoint.
• Line drawn edge-to-edge across the active HTF body.
• Style, width, color, and opacity are user-controlled.
4. Sweep Detection
• Flags (sweepedHigh / sweepedLow) prevent clutter: only the first tap per side per HTF
candle is marked.
• Lower-timeframe price breaking the HTF high/low triggers the sweep arrow.
• Arrows are offset above/below wick envelopes for clean visuals.
5. Customisation
• Every layer (body, wick, midpoint, arrows) has independent color + opacity settings.
• Arrow size, arrow color, and transparency are adjustable.
• Default HTF = 1H (perfect for 5m/15m traders) but can be switched to 30m, 4H, Daily,
etc.
Why It’s Useful
• HTF intent + LTF execution without chart hopping.
• Liquidity mapping: see where liquidity is swept in real time.
• Bias clarity: midpoint line defines HTF equilibrium.
• Clean signals: only the first sweep prints — no spam.
What Makes It Different
Most MTF overlays just plot candles or single lines. This tool:
• Splits body vs wick zones for institutional precision.
• Updates live intrabar (no repainting).
• Highlights liquidity sweeps clearly.
• Built for readability and professional use — not another retail signal toy.
Cheat-Sheet Playbook
1️⃣ Structure Bias
• Above midpoint line = bullish intent.
• Below midpoint line = bearish intent.
• Chop around midpoint = no clear direction.
2️⃣ Liquidity Sweeps
• ▲ Green up arrow below wick box = sell-side liquidity taken → watch for longs.
• ▼ Red down arrow above wick box = buy-side liquidity taken → watch for shorts.
• First sweep is the cleanest.
3️⃣ Trade Logic
• Body box = where institutions transact.
• Wick box = liquidity traps.
• Midpoint = bias filter.
• Best setups occur when sweep + midpoint flip align.
4️⃣ Example (5m + 1H Overlay)
1. ▲ Green up arrow prints below HTF wick.
2. Price reclaims the body box.
3. Midpoint flips to support.
4. Enter long → stop below sweep → targets = midpoint first, opposite wick second.
In short:
• Boxes = structure
• Wicks = liquidity pools
• Midpoint = bias line
• Arrows = liquidity sweeps
This is your SMC edge on one chart — HTF structure and liquidity fused directly into your execution timeframe.

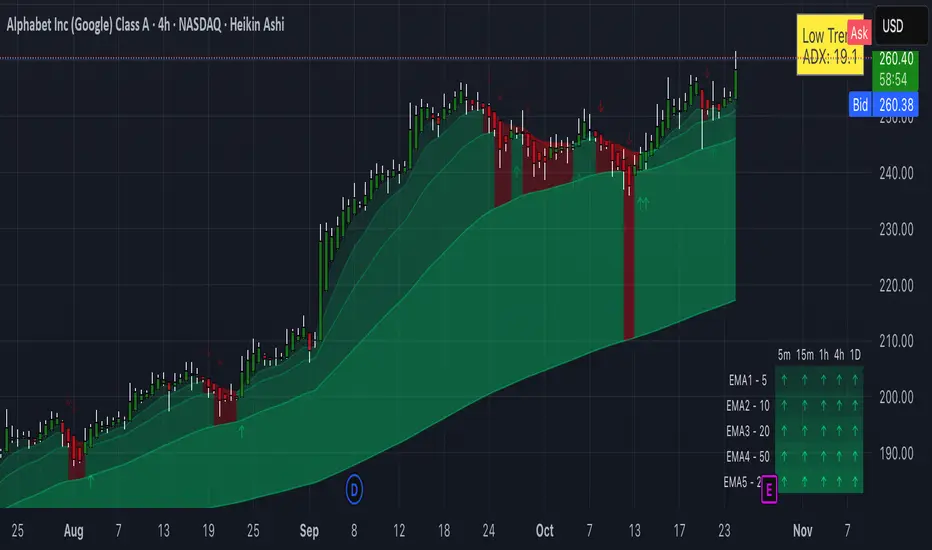
Trinity Multi-Timeframe MA TrendOriginal script can be found here: {Multi-Timeframe Trend Analysis } www.tradingview.com
1. all credit the original author www.tradingview.com
2. why change this script:
- added full transparency function to each EMA
- changed to up and down arrows
- change the dashboard to be able to resize and reposition
How to Use This Indicator
This indicator, "Trinity Multi-Timeframe MA Trend," is designed for TradingView and helps visualize Exponential Moving Average (EMA) trends across multiple timeframes. It plots EMAs on your chart, fills areas between them with directional colors (up or down), shows crossover/crossunder labels, and displays a dashboard table summarizing EMA directions (bullish ↑ or bearish ↓) for selected timeframes. It's useful for multi-timeframe analysis in trading strategies, like confirming trends before entries.
Configure Settings (via the Gear Icon on the Indicator Title):
Timeframes Group: Set up to 5 custom timeframes (e.g., "5" for 5 minutes, "60" for 1 hour). These determine the multi-timeframe analysis in the dashboard. Defaults: 5m, 15m, 1h, 4h, 5h.
EMA Group: Adjust the lengths of the 5 EMAs (defaults: 5, 10, 20, 50, 200). These are the moving averages plotted on the chart.
Colors (Inline "c"): Choose uptrend color (default: lime/green) and downtrend color (default: purple). These apply to plots, fills, labels, and dashboard cells.
Transparencies Group: Set transparency levels (0-100) for each EMA's plot and fill (0 = opaque, 100 = fully transparent). Defaults decrease from EMA1 (80) to EMA5 (0) for a gradient effect.
Dashboard Settings Group (newly added):
Dashboard Position: Select where the table appears (Top Right, Top Left, Bottom Right, Bottom Left).
Dashboard Size: Choose text size (Tiny, Small, Normal, Large, Huge) to scale the table for better visibility on crowded charts.
Understanding the Visuals:
EMA Plots: Five colored lines on the chart (EMA1 shortest, EMA5 longest). Color changes based on direction: uptrend (your selected up color) if rising, downtrend (down color) if falling.
Fills Between EMAs: Shaded areas between consecutive EMAs, colored and transparent based on the faster EMA's direction and your transparency settings.
Crossover Labels: Arrow labels (↑ for crossover/uptrend start, ↓ for crossunder/downtrend start) appear on the chart at EMA direction changes, with tooltips like "EMA1".
Dashboard Table (top-right by default):
Rows: EMA1 to EMA5 (with lengths shown).
Columns: Selected timeframes (converted to readable format, e.g., "5m", "1h").
Cells: ↑ (bullish/up) or ↓ (bearish/down) arrows, colored green/lime or purple based on trend, with fading transparency for visual hierarchy.
Use this to quickly check alignment across timeframes (e.g., all ↑ in multiple TFs might signal a strong uptrend).
Trading Tips:
Trend Confirmation: Look for alignment where most EMAs in higher timeframes are ↑ (bullish) or ↓ (bearish).
Entries/Exits: Use crossovers on the chart EMAs as signals, confirmed by the dashboard (e.g., enter long if lower TF EMA crosses up and higher TFs are aligned).
Customization: On lower timeframe charts, set dashboard timeframes to higher ones for top-down analysis. Adjust transparencies to avoid chart clutter.
Limitations: This is a trend-following tool; combine with volume, support/resistance, or other indicators. Backtest on historical data before live use.
Performance: Works best on trending markets; may whipsaw in sideways conditions.
DashBoard 2.3.1📌 Indicator Name:
DashBoard 2.3 – Smart Visual Market Overlay
📋 Description:
DashBoard 2.3 is a clean, efficient, and highly informative market overlay, designed to give you real-time context directly on your chart — without distractions. Whether you're swing trading or investing long-term, this tool keeps critical market data at your fingertips.
🔍 Key Features:
Symbol + Timeframe + Market Cap
Shows the current ticker and timeframe, optionally with real-time market cap.
ATR 14 with Volatility Signal
Displays ATR with color-coded risk levels:
🟢 Low
🟡 Moderate
🔴 High
⚫️ Extreme
You can choose between Daily ATR or timeframe-based ATR (auto-adjusted to chart resolution).
Adaptive Labeling
The ATR label updates to reflect the resolution:
ATR 14d (daily)
ATR 14W (weekly)
ATR 14H (hourly), etc.
Moving Average Tracker
Instantly shows whether price is above or below your selected moving average (e.g., 150 MA), with green/red indication.
Earnings Countdown
Clearly shows how many days remain until the next earnings report.
Industry & Sector Info (optional)
Useful for thematic or sector-based trading strategies.
Fully Customizable UI
Choose positioning, padding, font size, and which data to show. Designed for minimalism and clarity.
✅ Smart Logic:
Color dots appear only in relevant conditions (e.g., ATR color signals shown only on daily when enabled).
ATR display automatically reflects your time frame, if selected.
Clean chart integration – the overlay sits quietly in a corner, enhancing your analysis without intruding.
🧠 Ideal for:
Swing traders, position traders, and investors who want fast, high-impact insights directly from the chart.
Anyone looking for a compact, beautiful, and informative dashboard while they trade.

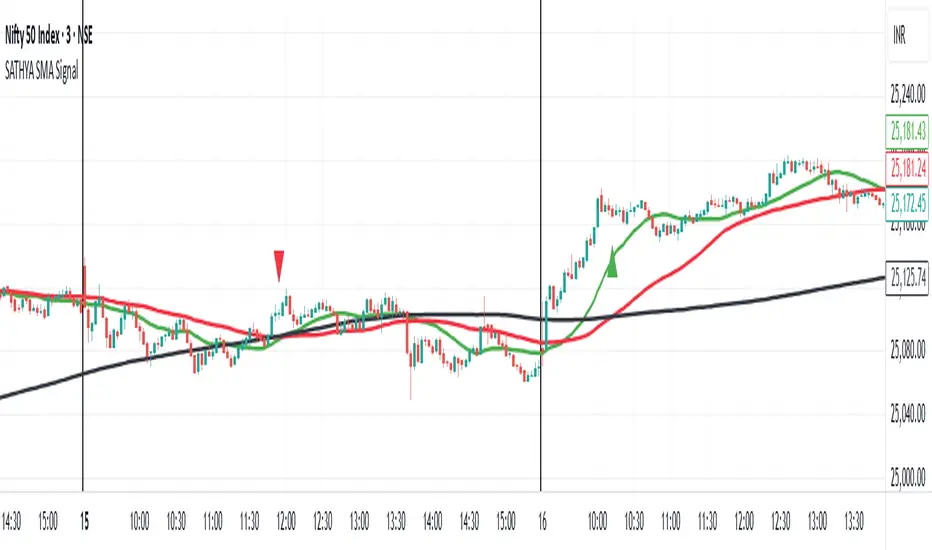
SATHYA SMA Signal)This indicator overlays 20, 50, and 200 Simple Moving Averages (SMAs) on the chart. It generates bullish signals when the 20 SMA crosses above the 200 SMA before the 50 SMA, with both above 200 SMA. Bearish signals occur when the 20 SMA crosses below the 200 SMA before the 50 SMA, with both below 200 SMA. Signals appear as distinct triangles on the chart, helping traders identify trend reversals based on systematic SMA crossovers and order of crossing.
BTC Spread: Coinbase Spot vs CME Futures (skullcap)BTC Spread: Coinbase Spot vs CME Futures
This indicator plots the real-time spread between Coinbase Spot BTC (COINBASE:BTCUSD) and CME Bitcoin Futures (CME:BTC1!).
It allows traders to monitor the premium or discount between spot and futures markets directly in one chart.
⸻
📊 How it Works
• The script pulls Coinbase spot BTC closing prices and CME front-month BTC futures prices on your selected timeframe.
• The spread is calculated as:
Spread = CME Price – Coinbase Spot Price
🔧 How to Use
1. Add the indicator to your chart (set to any timeframe you prefer).
2. The orange line represents the spread (USD difference).
3. The grey dashed line marks the zero level (parity between CME and Coinbase).
4. Use it to:
• Compare futures vs. spot market structure
• Track premium/discount cycles around funding or expiry
• Identify arbitrage opportunities or market dislocations
⸻
⚠️ Notes
• This indicator is informational only and does not provide trading signals.
• Useful for traders analysing derivatives vs spot price action.
• Works best when paired with order flow, funding rate, and open interest data.

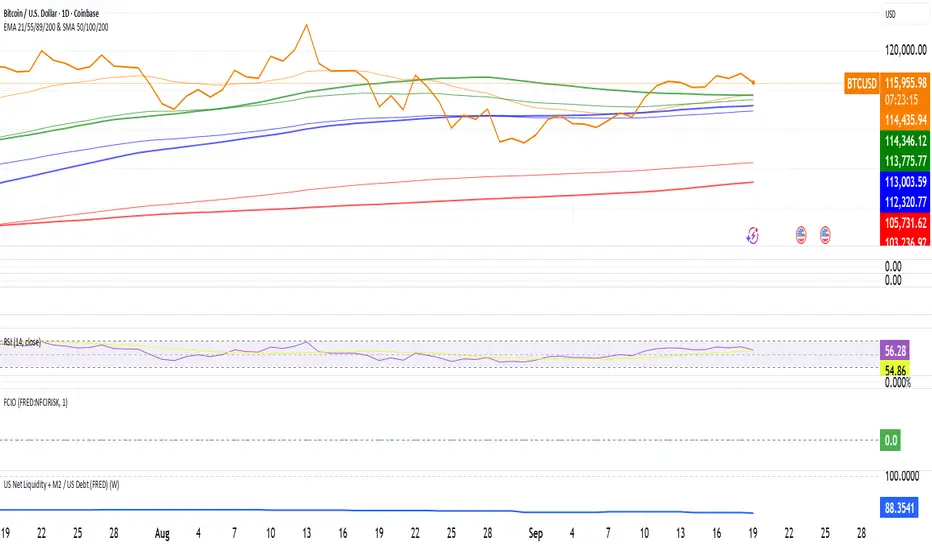
US Net Liquidity + M2 / US Debt (FRED)US Net Liquidity + M2 / US Debt
🧩 What this chart shows
This indicator plots the ratio of US Net Liquidity + M2 Money Supply divided by Total Public Debt.
US Net Liquidity is defined here as the Federal Reserve Balance Sheet (WALCL) minus the Treasury General Account (TGA) and the Overnight Reverse Repo facility (ON RRP).
M2 Money Supply represents the broad pool of liquid money circulating in the economy.
US Debt uses the Federal Government’s total outstanding debt.
By combining net liquidity with M2, then dividing by total debt, this chart provides a structural view of how much monetary “fuel” is in the system relative to the size of the federal debt load.
🧮 Formula
Ratio
=
(
Fed Balance Sheet
−
(
TGA
+
ON RRP
)
)
+
M2
Total Public Debt
Ratio=
Total Public Debt
(Fed Balance Sheet−(TGA+ON RRP))+M2
An optional normalization feature scales the ratio to start at 100 on the first valid bar, making long-term trends easier to compare.
🔎 Why it matters
Liquidity vs. Debt Growth: The numerator (Net Liquidity + M2) captures the monetary resources available to markets, while the denominator (Debt) reflects the expanding obligation of the federal government.
Market Signal: Historically, shifts in net liquidity and money supply relative to debt have coincided with major turning points in risk assets like equities and Bitcoin.
Context: A rising ratio may suggest that liquidity conditions are improving relative to debt expansion, which can be supportive for risk assets. Conversely, a falling ratio may highlight tightening conditions or debt outpacing liquidity growth.
⚙️ How to use it
Overlay this chart against S&P 500, Bitcoin, or gold to analyze correlations with asset performance.
Watch for trend inflections—does the ratio bottom before equities rally, or peak before risk-off periods?
Use normalization for long historical comparisons, or raw values to see the absolute ratio.
📊 Data sources
This indicator pulls from FRED (Federal Reserve Economic Data) tickers available in TradingView:
WALCL: Fed balance sheet
RRPONTSYD: Overnight Reverse Repo
WTREGEN: Treasury General Account
M2SL: M2 money stock
GFDEBTN: Total federal public debt
⚠️ Notes
Some FRED series are updated weekly, others monthly—set your chart timeframe accordingly.
If any ticker is unavailable in your plan, replace it with the equivalent FRED symbol provided in TradingView.
This indicator is intended for macro analysis, not short-term trading signals.
Dynamic Levels This indicator plots key price levels (Open, High, Low, Mid, Close) from multiple higher timeframes (Monday, Daily, Weekly, Monthly, Yearly).
It allows you to track how price interacts with important reference levels without switching timeframes.
🔑 Features
✅ Monday levels (MO, MH, MM)
By default: shows the last completed Monday (fixed values).
Option: “live mode” to update Monday High/Low/Mid while Monday’s candle is forming.
✅ Daily levels (DO, DH, DL, DM, DC)
Live: Daily High/Low/Mid update dynamically while today’s candle is forming.
Previous Daily Close (DC) is always fixed.
✅ Weekly levels (WO, WH, WL, WM)
Live: Weekly High/Low/Mid update dynamically while this week’s candle is forming.
Weekly Open is fixed.
✅ Monthly levels (MO(n), MH(n-1), ML(n-1), MM(n-1), MC(n-1))
Shows last completed month’s values (constant, never changing).
Current Monthly Open is also shown (naturally fixed).
✅ Yearly levels (YO(n), YH(n-1), YL(n-1), YM(n-1), YC(n-1))
Shows last completed year’s values (constant, never changing).
Current Yearly Open is also shown (naturally fixed).
🎨 Customization
Toggle each level (on/off) in indicator settings.
Individual color settings for Monday, Daily, Weekly, Monthly, and Yearly.
Adjustable line width and transparency.
Optional short labels (MO, DO, WM, etc.) displayed on the right side of the chart.
🔄 Dynamic Logic
Daily and Weekly → update dynamically while their candle is forming.
Monday, Monthly, and Yearly → use fixed values from the last completed bar (do not “breathe”).
📌 Use cases
Quickly see where price stands relative to previous close, current open, or mid-levels.
Use Monday Open/High/Mid as strong intraday references.
Use Monthly/Yearly levels as long-term support/resistance zones.
Estrategia Cava - IndicadorSimplified Criteria of the Cava Strategy
Below is the logic behind the Cava strategy, broken down into conditions for a buy operation:
Variables and Necessary Data
EMA 55: 55-period Exponential Moving Average.
MACD: Two lines (MACD Line and Signal Line) and the histogram.
RSI: Relative Strength Index.
Stochastic: Two lines (%K and %D).
Closing Price: The closing price of the current period.
Previous Closing Price: The closing price of the previous period.
Entry Logic (Buy Operation)
Trend Condition (EMA 55):
The price must be above the EMA 55.
The EMA 55 must have a positive slope (or at least not a negative one). This can be checked if the current EMA 55 is greater than the previous period's EMA 55.
Momentum Conditions (Oscillators):
MACD: The MACD line must have crossed above the signal line. For a strong signal, this cross should occur near or above the zero line.
RSI: The RSI must have exited the "oversold" zone (generally below 30) and be rising.
Stochastic: The Stochastic must have crossed upwards from the "oversold" zone (generally below 20).
Confirmation Condition (Price):
The current closing price must be higher than the previous closing price. This confirms the strength of the signal.
Position Management (Exit)
Take Profit: An exit can be programmed at a predetermined price target (e.g., the next resistance level) or when the momentum of the move begins to decrease.
Stop Loss: A stop loss should be placed below a significant support level or the entry point to limit losses in case the trade does not evolve as expected. The Cava strategy focuses on dynamic stop-loss management, moving it in the trader's favor as the price moves.
In summary, the strategy is a filtering system. If all conditions are met, the trade is considered high probability. If only some are met, the signal is discarded, and you wait for the next one. It's crucial to understand that discipline and risk management are just as important as the indicators themselves.

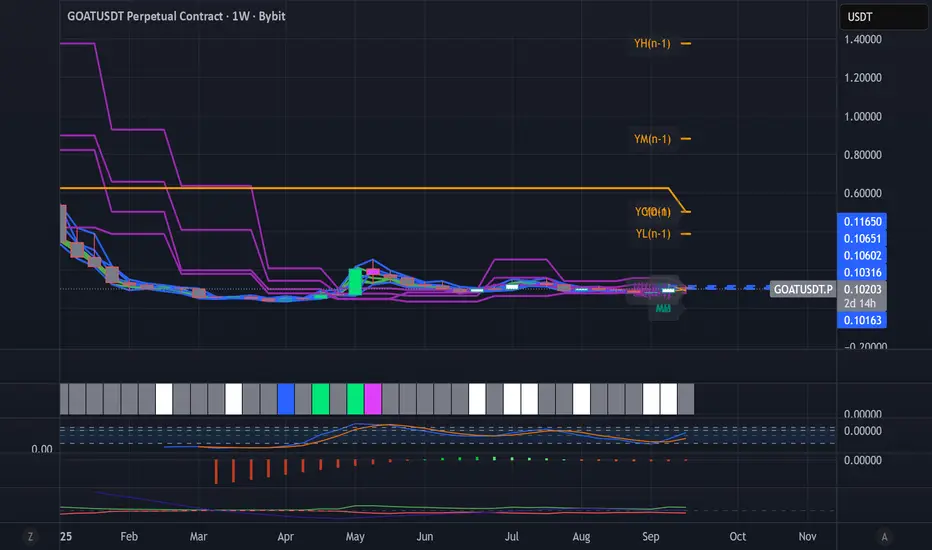
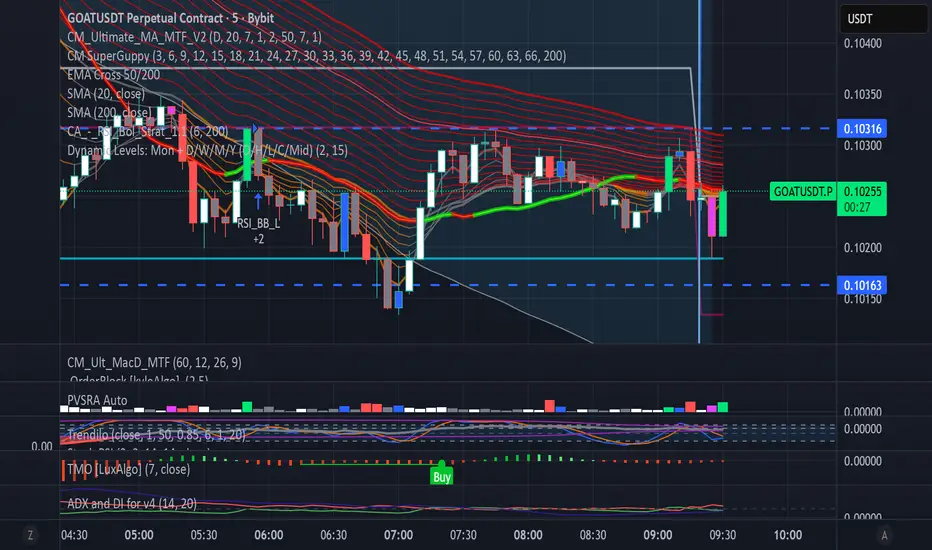
Dynamic Levels: Mon + D/W/M/Y (O/H/L/C/Mid)Purpose!
This Pine Script plots key reference levels (Open,High,Low,Close,Mid) for Monday,Daily,Weekly, Monthly, and Yearly timeframes.
All levels update live while the bar is forming. ( intrabar updates).
USAGE
Add the script to Pine Editor on TradingView (desktop Web)
Save - Add to chart
On mobile app: Find it under indicators - My scripts.
Great for identifying key reaction zones (opens,mids,previous closes).
Interval Price AlertsInterval Price Alerts
A versatile indicator that creates horizontal price levels with customizable alerts. Perfect for tracking multiple price levels simultaneously without having to create individual horizontal lines manually.
Features:
• Create evenly spaced price levels between a start and end price
• Customizable price interval spacing
• Optional price labels with flexible positioning
• Alert capabilities for both price crossovers and crossunders
• Highly customizable visual settings
Settings Groups:
1. Price Settings
• Start Price: The lower boundary for price levels
• End Price: The upper boundary for price levels
• Price Interval: The spacing between price levels
2. Line Style
• Line Color: Choose any color for the price level lines
• Line Style: Choose between Solid, Dashed, or Dotted lines
• Line Width: Adjustable from 2-4 pixels (optimized for opacity)
• Line Opacity: Control the transparency of lines (0-100%)
3. Label Style
• Show Price Labels: Toggle price labels on/off
• Label Color: Customize label text color
• Label Size: Choose from Tiny, Small, Normal, or Large
• Label Position: Place labels on Left or Right side
• Label Background: Set the background color
• Background Opacity: Control label background transparency
• Text Opacity: Adjust label text transparency
4. Alert Settings
• Alert on Crossover: Enable/disable upward price cross alerts
• Alert on Crossunder: Enable/disable downward price cross alerts
Usage Tips:
• Great for marking key price levels, support/resistance zones
• Useful for tracking multiple entry/exit points
• Perfect for scalping when you need to monitor multiple price levels
• Ideal for pre-market planning and level setting
Notes:
• Line width starts at 2 for optimal opacity rendering
• Labels can be fully customized or hidden completely
• Alert messages include the symbol and price level crossed

MTF Stochastic Range FinderThis indicator compares Stochastic RSI from 2 timeframes to signal possible reversals. Default 5 minute and 2 minute. Both Stochastic RSIs are customizable.
Allows for 6 support/resistance lines and allows a tolerance to filter proximity to levels for entry.
Can filter price level by manual support/resistance levels and/or VWAP

cd_indiCATor_CxGeneral:
This indicator is the redesigned, simplified, and feature-enhanced version of the previously shared indicators:
cd_cisd_market_Cx, cd_HTF_Bias_Cx, cd_sweep&cisd_Cx, cd_SMT_Sweep_CISD_Cx, and cd_RSI_divergence_Cx.
Within the holistic setup, the indicator tracks:
• HTF bias
• Market structure (trend) in the current timeframe
• Divergence between selected pairs (SMT)
• Divergence between price and RSI values
• Whether the price is in an important area (FVG, iFVG, and Volume Imbalance)
• Whether the price is at a key level
• Whether the price is within a user-defined special timeframe
The main condition and trigger of the setup is an HTF sweep with CISD confirmation on the aligned timeframe.
When the main condition occurs, the indicator provides the user with a real-time market status summary, enriched with other data.
________________________________________
What’s new?
-In the SMT module:
• Triad SMT analysis (e.g.: NQ1!, ES1!, and YM1!)
• Dyad SMT analysis (e.g.: EURUSD, GBPUSD)
• Alternative pair definition and divergence analysis for non-correlated assets
o For crypto assets (xxxUSDT <--> xxxUSDT.P) (e.g.: SOLUSDT.P, SOLUSDT)
o For stocks, divergence analysis by comparing the asset with its value in another currency
(BIST:xxx <--> BIST:xxx / EURTRY), (BAT:xxx <--> BAT:xxx / EURUSD)
-Special timeframe definition
-Configurable multi-option alarm center
-Alternative summary presentation (check list / status table / stickers)
________________________________________
Details and usage:
The user needs to configure four main sections:
• Pair and correlated pairs
• Timeframes (Auto / Manual)
• Alarm center
• Visual arrangement and selections
Pair Selections:
The user should adjust trading pairs according to their trade preferences.
Examples:
• Triad: NQ1!-ES1!-YM1!, BTC-ETH-Total3
• Dyad: NAS100-US500, XAUUSD-XAGUSD, XRPUSDT-XLMUSDT
Single pairs:
-Crypto Assets:
If crypto assets are not in the triad or dyad list, they are automatically matched as:
Perpetual <--> Spot (e.g.: DOGEUSDT.P <--> DOGEUSDT)
If the asset is already defined in a dyad list (e.g., DOGE – SHIB), the dyad definition takes priority.
________________________________________
-Stocks:
If stocks are defined in the dyad list (e.g.: BIST:THYAO <--> BIST:PGSUS), the dyad definition takes priority.
If not defined, the stock is compared with its value in the selected currency.
For example, in the Turkish Stock Exchange:
BIST:FENER stock, if EUR is chosen from the menu, is compared as BIST:FENER / OANDA:EURTRY.
Here, “OANDA” and the stock market currency (TRY) are automatically applied for the exchange rate.
For NYSE:XOM, its pair will be NYSE:XOM / EURUSD.
________________________________________
Timeframes:
By default, the menu is set to “Auto.” In this mode, aligned timeframes are automatically selected.
Aligned timeframes (LTF-HTF):
1m-15m, 3m-30m, 5m-1h, 15m-4h, 1h-D, 4h-W, D-M
Example: if monitoring the chart on 5m:
• 1h sweep + 5m CISD confirmation
• D sweep + 1h CISD confirmation (bias)
• 5m market structure
• 1h SMT and 1h RSI divergence analysis
For manual selections, the user must define the timeframes for Sweep and HTF bias.
FVG, iFVG, and Volume Imbalance timeframes must be manually set in both modes.
________________________________________
Alarm Center:
The user can choose according to preferred criteria.
Each row has options.
“Yes” → included in alarm condition.
“No” → not included in alarm condition.
If special timeframe criteria are added to the alarm, the hour range must also be entered in the same row, and the “Special Zone” tab (default: -4) should be checked.
Key level timeframes and plot options must be set manually.
Example alarm setup:
Alongside the main Sweep + CISD condition, if we also want HTF bias + Trend alignment + key level (W, D) and special timeframe (09:00–11:00), we should set up the menu as follows:
________________________________________
Visual Arrangement and Selections:
Users can control visibility with checkboxes according to their preferences.
In the Table & Sticker tab, table options and labels can be controlled.
• Summary Table has two options: Check list and Status Table
• From the HTF bias section, real-time bias and HTF sweep zone (optional) are displayed
• The RSI divergence section only shows divergence analysis results
• The SMT 2 sub-section only functions when triad is selected
Labels are shown on the bar where the sweep + CISD condition occurs, displaying the current situation.
With the Check box option, all criteria’s real-time status is shown (True/False).
Status Table provides a real-time summary table.
Although the menu may look crowded, most settings only need to be adjusted once during initial use.
________________________________________
What’s next?
• Suggestions from users
• Standard deviation projection
• Mitigation/order blocks (cd special mtg)
• PSP /TPD
________________________________________
Final note:
Every additional criterion in the alarm settings will affect alarm frequency.
Multiple conditions occurring at the same time is not, by itself, sufficient to enter a trade—you should always apply your own judgment.
Looking forward to your feedback and suggestions.
Happy trading! 🎉
