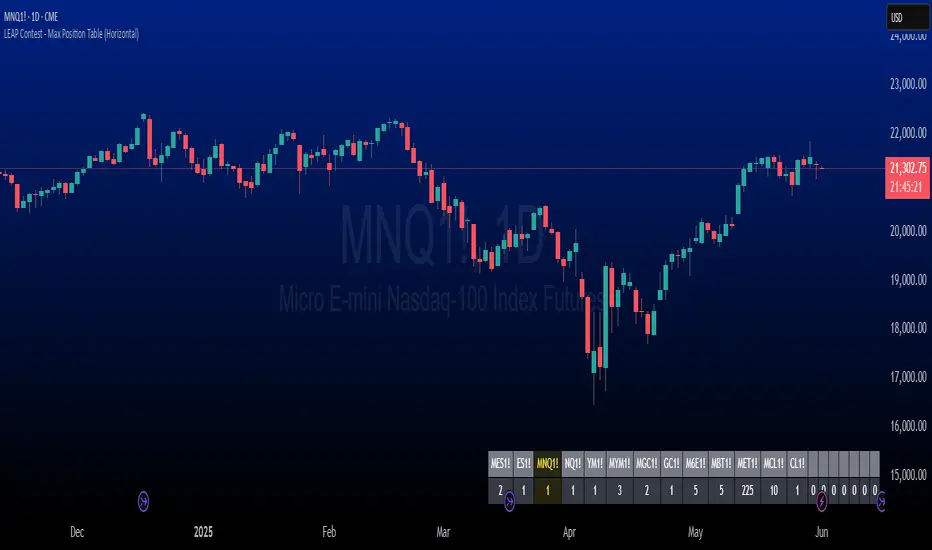
The LEAP Contest - Symbol & Max Position Table TrackerDescription:
This indicator tracks the maximum contracts allowed to be traded for TradingView’s *"The Leap"* Contest. It displays a horizontal table at the bottom right of your chart showing up to 20 symbols along with their maximum allowable open contract positions.
Use case:
Designed specifically for traders participating in *The Leap* Contest on TradingView.
Users need to enter the symbol and the maximum contracts allowed for that symbol in the settings menu for each new contest.
It provides a quick reference to ensure compliance with contest rules on maximum position sizes.
How it works:
The table shows two rows: the top row displays the symbol name, and the bottom row shows the max contract limit.
If the currently loaded chart symbol matches any symbol in the list, its text color changes to yellow .
Customization:
Symbols and limits must be updated in the indicator’s settings before each contest to reflect the current rules.
Multitimeframe
Support and Resistance MTFSupport and Resistance MTF
Support and Resistance MTF is a powerful tool that automatically detects and visualizes key support and resistance levels based on pivot highs and lows, using a higher timeframe of your choice. It is designed for traders who focus on price action and market structure, and want an adaptive, clean, and customizable indicator that helps identify important market zones.
The script uses configurable pivot logic to identify levels, with user-defined parameters for pivot strength and timeframe. Once a support or resistance level is detected, it is displayed on the chart either as a horizontal line, a shaded box, or both, depending on your display settings. You can fully customize the visual appearance including color, transparency, and line thickness. Levels are automatically extended into the future, and optionally into the past, to give better context.
Each level is monitored for breakout behavior. If price breaks through a level, it can change its role — a former resistance may become support, and vice versa. After a certain number of breakouts (which you define), the level is considered invalid and is automatically removed from the chart. This helps to maintain a clean visual layout and ensures only relevant levels are shown.
The indicator supports multi-timeframe analysis, allowing you to overlay higher-timeframe structure directly on your lower-timeframe trading chart. It is also compatible with Heikin Ashi candles internally for reference, without affecting your main chart type.
Support and Resistance MTF is ideal for traders looking to align intraday setups with higher-timeframe zones, manage risk around structural levels, or simply highlight market turning points in a clear and automated way. Built with Pine Script v5 and optimized for performance, it is both powerful and lightweight.
⚙️ Input Parameters – Description
[Time-Frame
Defines the higher timeframe used for detecting support and resistance levels. For example, you can set this to 1h, 4h, or D to visualize significant levels from a broader market perspective on a lower-timeframe chart.
Left / Right (Pivot Left / Pivot Right)
These parameters control the sensitivity of the pivot detection. A pivot high/low is confirmed if it is higher/lower than the defined number of candles to its left and right. Higher values reduce noise but may miss smaller turning points.
Extend Left
When enabled, the drawn levels (lines and/or boxes) are extended to the left side of the chart, allowing you to see the historical alignment of these levels.
Max Breaks Before Delete
Defines how many times a level can be broken by price before it is removed from the chart. This helps to avoid clutter from outdated or invalidated levels and keeps your chart relevant to current price action.
Draw Lines Only
If enabled, the indicator will draw only horizontal lines for support and resistance zones, omitting the colored background boxes. Useful for a cleaner chart appearance.
Line Width Broken Level
Sets the thickness of the support/resistance lines. Thicker lines can emphasize key levels, especially after a breakout.
Transparency Boxes
Controls the transparency (0–100) of the background boxes representing the zones. A higher value makes the boxes more transparent, lower values make them more opaque.
Transparency Lines
Controls the transparency (0–100) of the horizontal support and resistance lines. This allows for visual fine-tuning based on chart background and personal preference.
Support (Color, Group: Display)
Lets you choose the color used for support zones and lines. By default, it's green, but you can change it to fit your theme or visual preference.
Resistance (Color, Group: Display)
Defines the color for resistance zones and lines. The default is red, but it can be customized freely.

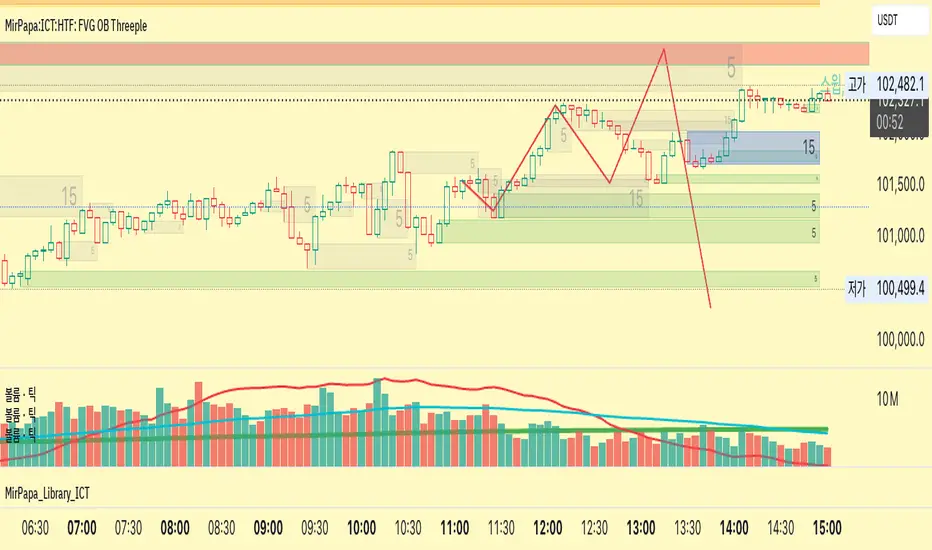
MirPapa:ICT:HTF: FVG OB Threeple# MirPapa:ICT:HTF: FVG OB (Fair Value Gap Order Block)
**Version:** Pine Script® v6
**Author:** © goodia
**License:** MPL-2.0 (Mozilla Public License 2.0)
---
## Overview
“FVG OB” (Fair Value Gap Order Block) identifies higher-timeframe candle ranges where a gap (imbalance) exists between two non-consecutive candles, signaling potential institutional order blocks. This module draws bullish or bearish FVG OB boxes on your lower-timeframe chart, extends them until price interacts a specified number of times, and then finalizes (recolors) the box.
---
## Inputs
- **Enable FVG OB Boxes** (`bool`)
Toggle drawing of HTF FVG OB boxes on the chart.
- **Enable FVG OB Midlines** (`bool`)
Toggle drawing of a midpoint line inside each FVG OB box.
- **FVG OB Close Count** (`int` 1–10)
Number of HTF closes beyond the FVG range required to finalize (recolor) the box.
- **FVG OB Bull Color** (`color`)
Fill & border color for bullish FVG OB boxes.
- **FVG OB Bear Color** (`color`)
Fill & border color for bearish FVG OB boxes.
- **FVG OB Box Transparency** (`int` 1–100)
Opacity level for FVG OB box fills (higher = more transparent).
---
## How It Works
1. **HTF Data Retrieval**
- The script uses `request.security()` (via `GetHTFrevised()`) to fetch HTF OHLC and historical values:
- `_htfHigh3` (high three bars ago) and `_htfLow1` (low one bar ago) for bullish FVG OB.
- `_htfLow3` (low three bars ago) and `_htfHigh1` (high one bar ago) for bearish FVG OB.
- It also tracks the HTF `bar_index` on the lower timeframe to align drawing.
2. **FVG OB Detection**
- **Bullish FVG OB**: Occurs when the HTF low of the previous bar (`low `) is strictly above the HTF high of three bars ago (`high `), creating a gap.
- **Bearish FVG OB**: Occurs when the HTF high of the previous bar (`high `) is strictly below the HTF low of three bars ago (`low `), creating a gap.
3. **Box Creation**
- On each new HTF bar (`ta.change(time(HTF)) != 0`), if a bullish or bearish FVG OB condition is met, the script calls `CreateBoxData()` with:
- **Bullish**: `bottom = HTF low `, `top = HTF high `, `_isBull = true`.
- **Bearish**: `bottom = HTF low `, `top = HTF high `, `_isBull = false`.
- Midline toggled by input.
- A `BoxData` struct is created and stored in either the Bull or Bear array.
4. **Box Extension & Finalization**
- On **every LTF bar**, `ProcessBoxDatas(...)` iterates over all active FVG OB boxes:
1. **Extend Right Edge**: `box.set_right(bar_index)` ensures the box follows the latest bar.
2. **Record Volume Delta**: Tracks buy/sell volume inside the box.
3. **Touch Stage Update**: `modBoxUpdateStage()` increments `_stage` when price touches its “basePoint” (for FVG OB, the basePrice is one side of the gap).
4. **Finalize**: `setBoxFinalize()` checks if the configured number of closes beyond the FVG gap (`FVG OB Close Count`) has occurred. If so:
- `_isActive := false`
- Border and background colors are changed to the “Box Close Color” (input).
- Finalized boxes remain on screen semi-transparent, indicating that the FVG OB zone has been tested.
5. **Midline (Optional)**
- If “Enable FVG OB Midlines” is checked, `ProcessBoxDatas()` also extends a horizontal midpoint line inside the box with `line.set_x2(bar_index)`.
---
## Usage Instructions
1. **Installation**
- Copy the FVG OB section of the Pine Script into TradingView’s Pine Editor (ensure the library import is included).
- Click “Add to Chart.”
2. **Configure Inputs**
- Choose a Higher Time Frame via the dropdown (e.g., “4시간” maps to a 4H timeframe).
- Toggle “Enable FVG OB Boxes” and “Enable FVG OB Midlines.”
- Select colors for bullish and bearish boxes and set transparency.
- Adjust “FVG OB Close Count” to control how many closes beyond the gap finalize the box.
3. **Interpretation**
- **Active FVG OB Boxes** extend to the right until price closes beyond the gap range the specified number of times.
- When finalized, each box changes to the “Box Close Color,” signaling that institutional orders in that gap have likely been filled.
Enjoy precise visualization of higher-timeframe Fair Value Gap Order Blocks on your lower-timeframe chart!
RSI Multi-TF TabRSI Multi-Timeframe Table 📊
A tool for multi-timeframe RSI analysis with visual overbought/oversold level highlighting.
Description
This indicator calculates the Relative Strength Index (RSI) for the current chart and displays RSI values across five additional timeframes (15m, 1h, 4h, 1d, 1w) in a dynamic table. The color-coded system simplifies identifying overbought (>70), oversold (<30), and neutral zones. Visual signals on the chart enhance analysis for the current timeframe.
Key Features
✅ Multi-Timeframe Analysis :
Track RSI across 15m, 1h, 4h, 1d, and 1w in a compact table.
Color-coded alerts:
🔴 Red — Overbought (potential pullback),
🔵 Blue — Oversold (potential rebound),
🟡 Yellow — Neutral zone.
✅ Visual Signals :
Background shading for oversold/overbought zones on the main chart.
Horizontal lines at 30 and 70 levels for reference.
✅ Customizable Settings :
Adjust RSI length (default: 14), source (close, open, high, etc.), and threshold levels.
How to Use
Table Analysis :
Compare RSI values across timeframes to spot divergences (e.g., overbought on 15m vs. oversold on D).
Use colors for quick decisions.
Chart Signals :
Blue background suggests bullish potential (oversold), red hints at bearish pressure (overbought).
Always confirm with other tools (volume, trends, or candlestick patterns).
Examples :
RSI(1h) > 70 while RSI(4h) < 30 → Possible reversal upward.
Sustained RSI(1d) above 50 may indicate a bullish trend.
Settings
RSI Length : Period for RSI calculation (default: 14).
RSI Source : Data source (close, open, high, low, hl2, hlc3, ohlc4).
Overbought/Oversold Levels : Thresholds for alerts (default: 70/30).
Important Notes
No direct trading signals : Use this as an analytical tool, not a standalone strategy.
Test strategies historically and consider market context before trading.

Swing High Low Detector by RV5📄 Description
The Swing High Low Detector is a visual indicator that automatically detects and displays swing highs and swing lows on the chart. Swings are determined based on configurable strength parameters (number of bars before and after a high/low), allowing users to fine-tune the sensitivity of the swing points.
🔹 Current swing levels are shown as solid (or user-defined) lines that dynamically extend until broken.
🔹 Past swing levels are preserved as dashed/dotted lines once broken, allowing traders to see previous support/resistance zones.
🔹 Customizable line colors, styles, and thickness for both current and past levels.
This indicator is useful for:
Identifying key market structure turning points
Building breakout strategies
Spotting trend reversals and swing zones
⚙️ How to Use
1. Add the indicator to any chart on any timeframe.
2. Adjust the Swing Strength inputs to change how sensitive the detector is:
A higher value will filter out smaller moves.
A lower value will capture more frequent swing points.
3. Customize the line styles for visual preference.
Choose different colors, line styles (solid/dashed/dotted), and thickness for:
Current Swing Highs (SH)
Past Swing Highs
Current Swing Lows (SL)
Past Swing Lows
4. Observe:
As new swing highs/lows are detected, the indicator draws a new current level.
Once price breaks that level, the line is archived as a past level and a new current swing is drawn.
✅ Features
Fully customizable styling for all lines
Real-time updates and automatic level tracking
Supports all chart types and instruments
👨💻 Credits
Script logic and implementation by RV5. This script was developed as a tool to improve price action visualization and trading structure clarity. Not affiliated with any financial institution. Use responsibly.

[Top] Simple Position + SL CalculatorThis indicator is a user-friendly tool designed to help traders easily calculate optimal position sizing, determine suitable stop-loss levels, and quantify maximum potential losses in dollar terms based on their personalized trading parameters.
Key Features:
Position Size Calculation: Automatically computes the number of shares to purchase based on the trader’s total account size and specified percentage of the account allocated per trade.
Stop-Loss Level: Suggests an appropriate stop-loss price point calculated based on the trader’s defined risk percentage per trade.
Max Loss Visualization: Clearly displays the maximum potential loss (in dollars) should the stop-loss be triggered.
Customizable Interface: Provides the flexibility to place the calculation table in different chart positions (Top Left, Top Right, Bottom Left, Bottom Right) according to user preference.
How to Use:
Enter your total Account Size.
Set the desired Position Size as a percentage of your account. (Typically, 1%–5% per trade is recommended for cash accounts.)
Define the Risk per Trade percentage (commonly between 0.05%–0.5%).
Choose your preferred Table Position to comfortably integrate with your trading chart.
Note:
If you identify a technical support level below the suggested stop-loss point, consider reducing your position size to manage the increased risk effectively.
Keep in mind that the calculations provided by this indicator are based solely on standard industry best practices and the specific inputs entered by you. They do not account for market volatility, news events, or any other factors outside the provided parameters. Always complement this indicator with sound technical and fundamental analysis.

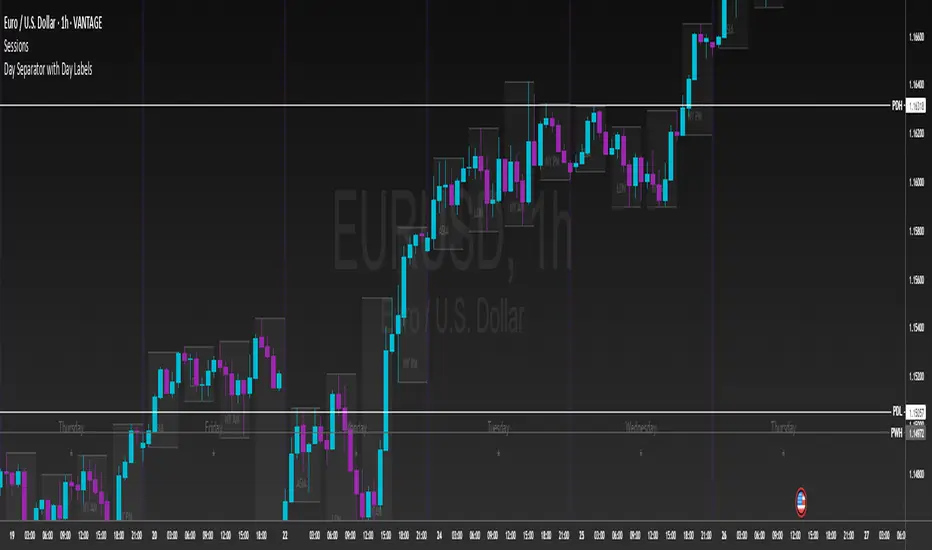
Day Separator with Day LabelsAdjustable day separator that paints vertical lines through the start of day. Default set to GMT however totally customisable.
Has the day of week ladled also which is also optional in position.
there is a check box for a light chart background chart but default is dark background.
Vertical lines are customisable regarding thickness and colour.
Pretty new to it all so welcome feedback and amendment ideas.
Advanced Moving Average ChannelAdvanced Moving Average Channel (MAC) is a comprehensive technical analysis tool that combines multiple moving average types with volume analysis to provide a complete market perspective.
Key Features:
1. Dynamic Channel Formation
- Configurable moving average types (SMA, EMA, WMA, VWMA, HMA, TEMA)
- Separate upper and lower band calculations
- Customizable band offsets for precise channel adjustment
2. Volume Analysis Integration
- Multi-timeframe volume analysis (1H, 24H, 7D)
- Relative volume comparison against historical averages
- Volume trend detection with visual indicators
- Price-level volume distribution profile
3. Market Context Indicators
- RSI integration for overbought/oversold conditions
- Channel position percentage
- Volume-weighted price levels
- Breakout detection with visual signals
Usage Guidelines:
1. Channel Interpretation
- Price within channel: Normal market conditions
- Price above upper band: Potential overbought condition
- Price below lower band: Potential oversold condition
- Channel width: Indicates market volatility
2. Volume Analysis
- High relative volume (>150%): Strong market interest
- Low relative volume (<50%): Weak market interest
- Volume trend arrows: Indicate increasing/decreasing market participation
- Volume profile: Shows price levels with highest trading activity
3. Trading Signals
- Breakout arrows: Potential trend continuation
- RSI extremes: Confirmation of overbought/oversold conditions
- Volume confirmation: Validates price movements
Customization:
- Adjust MA length for different market conditions
- Modify band offsets for tighter/looser channels
- Fine-tune volume analysis parameters
- Customize visual appearance
This indicator is designed for traders who want to combine price action, volume analysis, and market structure in a single, comprehensive tool.

Timeframe % TrakcerPulls historical closes from nine higher-timeframe look-backs (1 H, 12 H, 1 D, 7 D, 14 D, 1 M, 3 M, 6 M, 1 Y, 3 Y) with request.security().
2. Calculates the percent change between each look-back close and the current price:
(close − close₍look-back₎) / close₍look-back₎ × 100
3. Renders a two-column table in the chart’s top-right corner.
• Left column = timeframe label
• Right column = % move, rounded to two decimals
4. Heat-codes the cells — green if the asset is up, red if it’s down — so you can spot momentum (or pain) instantly.
5. Stays lightweight by updating only on the last bar; no excess runtimes.

Previous Highs & Lows (Customizable)Previous Highs & Lows (Customizable)
This Pine Script indicator displays horizontal lines and labels for high, low, and midpoint levels across multiple timeframes. The indicator plots levels from the following periods:
Today's session high, low, and midpoint
Yesterday's high, low, and midpoint
Current week's high, low, and midpoint
Last week's high, low, and midpoint
Last month's high, low, and midpoint
Last quarter's high, low, and midpoint
Last year's high, low, and midpoint
Features
Individual Controls: Each timeframe has separate toggles for showing/hiding high/low levels and midpoint levels.
Custom Colors: Independent color selection for lines and labels for each timeframe group.
Display Options:
Adjustable line width (1-5 pixels)
Variable label text size (tiny, small, normal, large, huge)
Configurable label offset positioning
Organization: Settings are grouped by timeframe in a logical sequence from most recent (today) to least recent (last year).
Display Logic: Lines span the current trading day only. Labels are positioned to the right of the price action. The indicator automatically removes previous drawings to prevent chart clutter.

Volume pressure by GSK-VIZAG-AP-INDIA🔍 Volume Pressure by GSK-VIZAG-AP-INDIA
🧠 Overview
“Volume Pressure” is a multi-timeframe, real-time table-based volume analysis tool designed to give traders a clear and immediate view of buying and selling pressure across custom-selected timeframes. By breaking down buy volume, sell volume, total volume, and their percentages, this indicator helps traders identify demand/supply imbalances and volume momentum in the market.
🎯 Purpose / Trading Use Case
This indicator is ideal for intraday and short-term traders who want to:
Spot aggressive buying or selling activity
Track volume dynamics across multiple timeframes *1 min time frame will give best results*
Use volume pressure as a confirming tool alongside price action or trend-based systems
It helps determine when large buying/selling activity is occurring and whether such behavior is consistent across timeframes—a strong signal of institutional interest or volume-driven trend shifts.
🧩 Key Features & Logic
Real-Time Table Display: A clean, dynamic table showing:
Buy Volume
Sell Volume
Total Volume
Buy % of total volume
Sell % of total volume
Multi-Time frame Analysis: Supports 8 user-selectable custom time frames from 1 to 240 minutes, giving flexibility to analyze volume pressure at various granularities.
Color-Coded Volume Bias:
Green for dominant Buy pressure
Red for dominant Sell pressure
Yellow for Neutral
Intensity-based blinking for extreme values (over 70%)
Dynamic Data Calculation:
Uses volume * (close > open) logic to estimate buy vs sell volumes bar-by-bar, then aggregates by timeframe.
⚙️ User Inputs & Settings
Timeframe Selectors (TF1 to TF8): Choose any 8 timeframes you want to monitor volume pressure across.
Text & Color Settings:
Customize text colors for Buy, Sell, Total volumes
Choose Buy/Sell bias colors
Enable/disable blinking for visual emphasis on extremes
Table Appearance:
Set header color, metric background, and text size
Table positioning: top-right, bottom-right, etc.
Blinking Highlight Toggle: Enable this to visually highlight when Buy/Sell % exceeds 70%—a sign of strong pressure.
📊 Visual Elements Explained
The table has 6 rows and 10 columns:
Row 0: Headers for Today and TF1 to TF8
Rows 1–3: Absolute values (Buy Vol, Sell Vol, Total Vol)
Rows 4–5: Relative percentages (Buy %, Sell %), with dynamic background color
First column shows the metric names (e.g., “Buy Vol”)
Cells blink using alternate background colors if volume pressure crosses thresholds
💡 How to Use It Effectively
Use Buy/Sell % rows to confirm potential breakout trades or identify volume exhaustion zones
Look for multi-timeframe confluence: If 5 or more TFs show >70% Buy pressure, buyers are in control
Combine with price action (e.g., breakouts, reversals) to increase conviction
Suitable for equities, indices, futures, crypto, especially on lower timeframes (1m to 15m)
🏆 What Makes It Unique
Table-based MTF Volume Pressure Display: Most indicators only show volume as bars or histograms; this script summarizes and color-codes volume bias across timeframes in a tabular format.
Customization-friendly: Full control over colors, themes, and timeframes
Blinking Alerts: Rare visual feature to capture user attention during extreme pressure
Designed with performance and readability in mind—even for fast-paced scalping environments.
🚨 Alerts / Extras
While this script doesn’t include TradingView alert functions directly, the visual blinking serves as a strong real-time alert mechanism.
Future versions may include built-in alert conditions for buy/sell bias thresholds.
🔬 Technical Concepts Used
Volume Dissection using close > open logic (to estimate buyer vs seller pressure)
Simple aggregation of volume over custom timeframes
Table plotting using Pine Script table.new, table.cell
Dynamic color logic for bias identification
Custom blinking logic using na(bar_index % 2 == 0 ? colorA : colorB)
⚠️ Disclaimer
This indicator is a tool for analysis, not financial advice. Always backtest and validate strategies before using any indicator for live trading. Past performance is not indicative of future results. Use at your own risk and apply proper risk management.
✍️ Author & Signature
Indicator Name: Volume Pressure
Author: GSK-VIZAG-AP-INDIA
TradingView Username: prowelltraders

HTF Candle Breakout Fibonacci LevelsThis indicator automatically plots Fibonacci retracement levels on a lower timeframe (LTF) after detecting a breakout candle on a selected higher timeframe (HTF).
🔍 How It Works
When a candle on your selected HTF closes beyond the high or low of the previous candle, the indicator automatically draws Fibonacci levels on the LTF.
These levels remain visible until the next HTF candle is formed — allowing you to trade retracements with contextual precision.
⸻
⚙️ Customization Options
From the indicator settings, you can modify:
• The HTF candle timeframe (default is 1D)
• Fibonacci levels and colors
• Enable or disable “Show Only the Latest Levels” — ideal for live trading to keep the chart clean and focused.
⸻
🟪 HTF Candles Preview
After applying the indicator, you’ll see 3 vertical bars on the right edge of your LTF chart. These represent a live preview of the last three HTF candles and update in real-time.
If you prefer a cleaner chart, disable this feature via the “Show HTF Candles” toggle in the settings.
⸻
Feel free to reach out if you have any questions.

FVG Premium [no1x]█ OVERVIEW
This indicator provides a comprehensive toolkit for identifying, visualizing, and tracking Fair Value Gaps (FVGs) across three distinct timeframes (current chart, a user-defined Medium Timeframe - MTF, and a user-defined High Timeframe - HTF). It is designed to offer traders enhanced insight into FVG dynamics through detailed state monitoring (formation, partial fill, full mitigation, midline touch), extensive visual customization for FVG representation, and a rich alert system for timely notifications on FVG-related events.
█ CONCEPTS
This indicator is built upon the core concept of Fair Value Gaps (FVGs) and their significance in price action analysis, offering a multi-layered approach to their detection and interpretation across different timeframes.
Fair Value Gaps (FVGs)
A Fair Value Gap (FVG), also known as an imbalance, represents a range in price delivery where one side of the market (buying or selling) was more aggressive, leaving an inefficiency or an "imbalance" in the price action. This concept is prominently featured within Smart Money Concepts (SMC) and Inner Circle Trader (ICT) methodologies, where such gaps are often interpreted as footprints left by "smart money" due to rapid, forceful price movements. These methodologies suggest that price may later revisit these FVG zones to rebalance a prior inefficiency or to seek liquidity before continuing its path. These gaps are typically identified by a three-bar pattern:
Bullish FVG : This is a three-candle formation where the second candle shows a strong upward move. The FVG is the space created between the high of the first candle (bottom of FVG) and the low of the third candle (top of FVG). This indicates a strong upward impulsive move.
Bearish FVG : This is a three-candle formation where the second candle shows a strong downward move. The FVG is the space created between the low of the first candle (top of FVG) and the high of the third candle (bottom of FVG). This indicates a strong downward impulsive move.
FVGs are often watched by traders as potential areas where price might return to "rebalance" or find support/resistance.
Multi-Timeframe (MTF) Analysis
The indicator extends FVG detection beyond the current chart's timeframe (Low Timeframe - LTF) to two higher user-defined timeframes: Medium Timeframe (MTF) and High Timeframe (HTF). This allows traders to:
Identify FVGs that might be significant on a broader market structure.
Observe how FVGs from different timeframes align or interact.
Gain a more comprehensive perspective on potential support and resistance zones.
FVG State and Lifecycle Management
The indicator actively tracks the lifecycle of each detected FVG:
Formation : The initial identification of an FVG.
Partial Fill (Entry) : When price enters but does not completely pass through the FVG. The indicator updates the "current" top/bottom of the FVG to reflect the filled portion.
Midline (Equilibrium) Touch : When price touches the 50% level of the FVG.
Full Mitigation : When price completely trades through the FVG, effectively "filling" or "rebalancing" the gap. The indicator records the mitigation time.
This state tracking is crucial for understanding how price interacts with these zones.
FVG Classification (Large FVG)
FVGs can be optionally classified as "Large FVGs" (LV) if their size (top to bottom range) exceeds a user-defined multiple of the Average True Range (ATR) for that FVG's timeframe. This helps distinguish FVGs that are significantly larger relative to recent volatility.
Visual Customization and Information Delivery
A key concept is providing extensive control over how FVGs are displayed. This control is achieved through a centralized set of visual parameters within the indicator, allowing users to configure numerous aspects (colors, line styles, visibility of boxes, midlines, mitigation lines, labels, etc.) for each timeframe. Additionally, an on-chart information panel summarizes the nearest unmitigated bullish and bearish FVG levels for each active timeframe, providing a quick glance at key price points.
█ FEATURES
This indicator offers a rich set of features designed to provide a highly customizable and comprehensive Fair Value Gap (FVG) analysis experience. Users can tailor the FVG detection, visual representation, and alerting mechanisms across three distinct timeframes: the current chart (Low Timeframe - LTF), a user-defined Medium Timeframe (MTF), and a user-defined High Timeframe (HTF).
Multi-Timeframe FVG Detection and Display
The core strength of this indicator lies in its ability to identify and display FVGs from not only the current chart's timeframe (LTF) but also from two higher, user-selectable timeframes (MTF and HTF).
Timeframe Selection: Users can specify the exact MTF (e.g., "60", "240") and HTF (e.g., "D", "W") through dedicated inputs in the "MTF (Medium Timeframe)" and "HTF (High Timeframe)" settings groups. The visibility of FVGs from these higher timeframes can be toggled independently using the "Show MTF FVGs" and "Show HTF FVGs" checkboxes.
Consistent Detection Logic: The FVG detection logic, based on the classic three-bar imbalance pattern detailed in the 'Concepts' section, is applied consistently across all selected timeframes (LTF, MTF, HTF)
Timeframe-Specific Visuals: Each timeframe's FVGs (LTF, MTF, HTF) can be customized with unique colors for bullish/bearish states and their mitigated counterparts. This allows for easy visual differentiation of FVGs originating from different market perspectives.
Comprehensive FVG Visualization Options
The indicator provides extensive control over how FVGs are visually represented on the chart for each timeframe (LTF, MTF, HTF).
FVG Boxes:
Visibility: Main FVG boxes can be shown or hidden per timeframe using the "Show FVG Boxes" (for LTF), "Show Boxes" (for MTF/HTF) inputs.
Color Customization: Colors for bullish, bearish, active, and mitigated FVG boxes (including Large FVGs, if classified) are fully customizable for each timeframe.
Box Extension & Length: FVG boxes can either be extended to the right indefinitely ("Extend Boxes Right") or set to a fixed length in bars ("Short Box Length" or "Box Length" equivalent inputs).
Box Labels: Optional labels can display the FVG's timeframe and fill percentage on the box. These labels are configurable for all timeframes (LTF, MTF, and HTF). Please note: If FVGs are positioned very close to each other on the chart, their respective labels may overlap. This can potentially lead to visual clutter, and it is a known behavior in the current version of the indicator.
Box Borders: Visibility, width, style (solid, dashed, dotted), and color of FVG box borders are customizable per timeframe.
Midlines (Equilibrium/EQ):
Visibility: The 50% level (midline or EQ) of FVGs can be shown or hidden for each timeframe.
Style Customization: Width, style, and color of the midline are customizable per timeframe. The indicator tracks if this midline has been touched by price.
Mitigation Lines:
Visibility: Mitigation lines (representing the FVG's opening level that needs to be breached for full mitigation) can be shown or hidden for each timeframe. If shown, these lines are always extended to the right.
Style Customization: Width, style, and color of the mitigation line are customizable per timeframe.
Mitigation Line Labels: Optional price labels can be displayed on mitigation lines, with a customizable horizontal bar offset for positioning. For optimal label placement, the following horizontal bar offsets are recommended: 4 for LTF, 8 for MTF, and 12 for HTF.
Persistence After Mitigation: Users can choose to keep mitigation lines visible even after an FVG is fully mitigated, with a distinct color for such lines. Importantly, this option is only effective if the general setting 'Hide Fully Mitigated FVGs' is disabled, as otherwise, the entire FVG and its lines will be removed upon mitigation.
FVG State Management and Behavior
The indicator tracks and visually responds to changes in FVG states.
Hide Fully Mitigated FVGs: This option, typically found in the indicator's general settings, allows users to automatically remove all visual elements of an FVG from the chart once price has fully mitigated it. This helps maintain chart clarity by focusing on active FVGs.
Partial Fill Visualization: When price enters an FVG, the indicator offers a dynamic visual representation: the portion of the FVG that has been filled is shown as a "mitigated box" (typically with a distinct color), while the original FVG box shrinks to clearly highlight the remaining, unfilled portion. This two-part display provides an immediate visual cue about how much of the FVG's imbalance has been addressed and what potential remains within the gap.
Visual Filtering by ATR Proximity: To help users focus on the most relevant price action, FVGs can be dynamically hidden if they are located further from the current price than a user-defined multiple of the Average True Range (ATR). This behavior is controlled by the "Filter Band Width (ATR Multiple)" input; setting this to zero disables the filter entirely, ensuring all detected FVGs remain visible regardless of their proximity to price.
Alternative Usage Example: Mitigation Lines as Key Support/Resistance Levels
For traders preferring a minimalist chart focused on key Fair Value Gap (FVG) levels, the indicator's visualization settings can be customized to display only FVG mitigation lines. This approach leverages these lines as potential support and resistance zones, reflecting areas where price might revisit to address imbalances.
To configure this view:
Disable FVG Boxes: Turn off "Show FVG Boxes" (for LTF) or "Show Boxes" (for MTF/HTF) for the desired timeframes.
Hide Midlines: Disable the visibility of the 50% FVG Midlines (Equilibrium/EQ).
Ensure Mitigation Lines are Visible: Keep "Mitigation Lines" enabled.
Retain All Mitigation Lines:
Disable the "Hide Fully Mitigated FVGs" option in the general settings.
Enable the feature to "keep mitigation lines visible even after an FVG is fully mitigated". This ensures lines from all FVGs (active or fully mitigated) remain on the chart, which is only effective if "Hide Fully Mitigated FVGs" is disabled.
This setup offers:
A Decluttered Chart: Focuses solely on the FVG opening levels.
Precise S/R Zones: Treats mitigation lines as specific points for potential price reactions.
Historical Level Analysis: Includes lines from past, fully mitigated FVGs for a comprehensive view of significant price levels.
For enhanced usability with this focused view, consider these optional additions:
The on-chart Information Panel can be activated to display a quick summary of the nearest unmitigated FVG levels.
Mitigation Line Labels can also be activated for clear price level identification. A customizable horizontal bar offset is available for positioning these labels; for example, offsets of 4 for LTF, 8 for MTF, and 12 for HTF can be effective.
FVG Classification (Large FVG)
This feature allows for distinguishing FVGs based on their size relative to market volatility.
Enable Classification: Users can enable "Classify FVG (Large FVG)" to identify FVGs that are significantly larger than average.
ATR-Based Threshold: An FVG is classified as "Large" if its height (price range) is greater than or equal to the Average True Range (ATR) of its timeframe multiplied by a user-defined "Large FVG Threshold (ATR Multiple)". The ATR period for this calculation is also configurable.
Dedicated Colors: Large FVGs (both bullish/bearish and active/mitigated) can be assigned unique colors, making them easily distinguishable on the chart.
Panel Icon: Large FVGs are marked with a special icon in the Info Panel.
Information Panel
An on-chart panel provides a quick summary of the nearest unmitigated FVG levels.
Visibility and Position: The panel can be shown/hidden and positioned in any of the nine standard locations on the chart (e.g., Top Right, Middle Center).
Content: It displays the price levels of the nearest unmitigated bullish and bearish FVGs for LTF, MTF (if active), and HTF (if active). It also indicates if these nearest FVGs are Large FVGs (if classification is enabled) using a selectable icon.
Styling: Text size, border color, header background/text colors, default text color, and "N/A" cell background color are customizable.
Highlighting: Background and text colors for the cells displaying the overall nearest bullish and bearish FVG levels (across all active timeframes) can be customized to draw attention to the most proximate FVG.
Comprehensive Alert System
The indicator offers a granular alert system for various FVG-related events, configurable for each timeframe (LTF, MTF, HTF) independently. Users can enable alerts for:
New FVG Formation: Separate alerts for new bullish and new bearish FVG formations.
FVG Entry/Partial Fill: Separate alerts for price entering a bullish FVG or a bearish FVG.
FVG Full Mitigation: Separate alerts for full mitigation of bullish and bearish FVGs.
FVG Midline (EQ) Touch: Separate alerts for price touching the midline of a bullish or bearish FVG.
Alert messages are detailed, providing information such as the timeframe, FVG type (bull/bear, Large FVG), relevant price levels, and timestamps.
█ NOTES
This section provides additional information regarding the indicator's usage, performance considerations, and potential interactions with the TradingView platform. Understanding these points can help users optimize their experience and troubleshoot effectively.
Performance and Resource Management
Maximum FVGs to Track : The "Max FVGs to Track" input (defaulting to 25) limits the number of FVG objects processed for each category (e.g., LTF Bullish, MTF Bearish). Increasing this value significantly can impact performance due to more objects being iterated over and potentially drawn, especially when multiple timeframes are active.
Drawing Object Limits : To manage performance, this script sets its own internal limits on the number of drawing objects it displays. While it allows for up to approximately 500 lines (max_lines_count=500) and 500 labels (max_labels_count=500), the number of FVG boxes is deliberately restricted to a maximum of 150 (max_boxes_count=150). This specific limit for boxes is a key performance consideration: displaying too many boxes can significantly slow down the indicator, and a very high number is often not essential for analysis. Enabling all visual elements for many FVGs across all three timeframes can cause the indicator to reach these internal limits, especially the stricter box limit
Optimization Strategies : To help you manage performance, reduce visual clutter, and avoid exceeding drawing limits when using this indicator, I recommend the following strategies:
Maintain or Lower FVG Tracking Count: The "Max FVGs to Track" input defaults to 25. I find this value generally sufficient for effective analysis and balanced performance. You can keep this default or consider reducing it further if you experience performance issues or prefer a less dense FVG display.
Utilize Proximity Filtering: I suggest activating the "Filter Band Width (ATR Multiple)" option (found under "General Settings") to display only those FVGs closer to the current price. From my experience, a value of 5 for the ATR multiple often provides a good starting point for balanced performance, but you should feel free to adjust this based on market volatility and your specific trading needs.
Hide Fully Mitigated FVGs: I strongly recommend enabling the "Hide Fully Mitigated FVGs" option. This setting automatically removes all visual elements of an FVG from the chart once it has been fully mitigated by price. Doing so significantly reduces the number of active drawing objects, lessens computational load, and helps maintain chart clarity by focusing only on active, relevant FVGs.
Disable FVG Display for Unused Timeframes: If you are not actively monitoring certain higher timeframes (MTF or HTF) for FVG analysis, I advise disabling their display by unchecking "Show MTF FVGs" or "Show HTF FVGs" respectively. This can provide a significant performance boost.
Simplify Visual Elements: For active FVGs, consider hiding less critical visual elements if they are not essential for your specific analysis. This could include box labels, borders, or even entire FVG boxes if, for example, only the mitigation lines are of interest for a particular timeframe.
Settings Changes and Platform Limits : This indicator is comprehensive and involves numerous calculations and drawings. When multiple settings are changed rapidly in quick succession, it is possible, on occasion, for TradingView to issue a "Runtime error: modify_study_limit_exceeding" or similar. This can cause the indicator to temporarily stop updating or display errors.
Recommended Approach : When adjusting settings, it is advisable to wait a brief moment (a few seconds) after each significant change. This allows the indicator to reprocess and update on the chart before another change is made
Error Recovery : Should such a runtime error occur, making a minor, different adjustment in the settings (e.g., toggling a checkbox off and then on again) and waiting briefly will typically allow the indicator to recover and resume correct operation. This behavior is related to platform limitations when handling complex scripts with many inputs and drawing objects.
Multi-Timeframe (MTF/HTF) Data and Behavior
HTF FVG Confirmation is Essential: : For an FVG from a higher timeframe (MTF or HTF) to be identified and displayed on your current chart (LTF), the three-bar pattern forming the FVG on that higher timeframe must consist of fully closed bars. The indicator does not draw speculative FVGs based on incomplete/forming bars from higher timeframes.
Data Retrieval and LTF Processing: The indicator may use techniques like lookahead = barmerge.lookahead_on for timely data retrieval from higher timeframes. However, the actual detection of an FVG occurs after all its constituent bars on the HTF have closed.
Appearance Timing on LTF (1 LTF Candle Delay): As a natural consequence of this, an FVG that is confirmed on an HTF (i.e., its third bar closes) will typically become visible on your LTF chart one LTF bar after its confirmation on the HTF.
Example: Assume an FVG forms on a 30-minute chart at 15:30 (i.e., with the close of the 30-minute bar that covers the 15:00-15:30 period). If you are monitoring this FVG on a 15-minute chart, the indicator will detect this newly formed 30-minute FVG while processing the data for the 15-minute bar that starts at 15:30 and closes at 15:45. Therefore, the 30-minute FVG will become visible on your 15-minute chart at the earliest by 15:45 (i.e., with the close of that relevant 15-minute LTF candle). This means the HTF FVG is reflected on the LTF chart with a delay equivalent to one LTF candle.
FVG Detection and Display Logic
Fair Value Gaps (FVGs) on the current chart timeframe (LTF) are detected based on barstate.isconfirmed. This means the three-bar pattern must be complete with closed bars before an FVG is identified. This confirmation method prevents FVGs from being prematurely identified on the forming bar.
Alerts
Alert Setup : To receive alerts from this indicator, you must first ensure you have enabled the specific alert conditions you are interested in within the indicator's own settings (see 'Comprehensive Alert System' under the 'FEATURES' section). Once configured, open TradingView's 'Create Alert' dialog. In the 'Condition' tab, select this indicator's name, and crucially, choose the 'Any alert() function call' option from the dropdown list. This setup allows the indicator to trigger alerts based on the precise event conditions you have activated in its settings
Alert Frequency : Alerts are designed to trigger once per bar close (alert.freq_once_per_bar_close) for the specific event.
User Interface (UI) Tips
Settings Group Icons: In the indicator settings menu, timeframe-specific groups are marked with star icons for easier navigation: 🌟 for LTF (Current Chart Timeframe), 🌟🌟 for MTF (Medium Timeframe), and 🌟🌟🌟 for HTF (High Timeframe).
Dependent Inputs: Some input settings are dependent on others being enabled. These dependencies are visually indicated in the settings menu using symbols like "↳" (dependent setting on the next line), "⟷" (mutually exclusive inline options), or "➜" (directly dependent inline option).
Settings Layout Overview: The indicator settings are organized into logical groups for ease of use. Key global display controls – such as toggles for MTF FVGs, HTF FVGs (along with their respective timeframe selectors), and the Information Panel – are conveniently located at the very top within the '⚙️ General Settings' group. This placement allows for quick access to frequently adjusted settings. Other sections provide detailed customization options for each timeframe (LTF, MTF, HTF), specific FVG components, and alert configurations.
█ FOR Pine Script® CODERS
This section provides a high-level overview of the FVG Premium indicator's internal architecture, data flow, and the interaction between its various library components. It is intended for Pine Script™ programmers who wish to understand the indicator's design, potentially extend its functionality, or learn from its structure.
System Architecture and Modular Design
The indicator is architected moduarly, leveraging several custom libraries to separate concerns and enhance code organization and reusability. Each library has a distinct responsibility:
FvgTypes: Serves as the foundational data definition layer. It defines core User-Defined Types (UDTs) like fvgObject (for storing all attributes of an FVG) and drawSettings (for visual configurations), along with enumerations like tfType.
CommonUtils: Provides utility functions for common tasks like mapping user string inputs (e.g., "Dashed" for line style) to their corresponding Pine Script™ constants (e.g., line.style_dashed) and formatting timeframe strings for display.
FvgCalculations: Contains the core logic for FVG detection (both LTF and MTF/HTF via requestMultiTFBarData), FVG classification (Large FVGs based on ATR), and checking FVG interactions with price (mitigation, partial fill).
FvgObject: Implements an object-oriented approach by attaching methods to the fvgObject UDT. These methods manage the entire visual lifecycle of an FVG on the chart, including drawing, updating based on state changes (e.g., mitigation), and deleting drawing objects. It's responsible for applying the visual configurations defined in drawSettings.
FvgPanel: Manages the creation and dynamic updates of the on-chart information panel, which displays key FVG levels.
The main indicator script acts as the orchestrator, initializing these libraries, managing user inputs, processing data flow between libraries, and handling the main event loop (bar updates) for FVG state management and alerts.
Core Data Flow and FVG Lifecycle Management
The general data flow and FVG lifecycle can be summarized as follows:
Input Processing: User inputs from the "Settings" dialog are read by the main indicator script. Visual style inputs (colors, line styles, etc.) are consolidated into a types.drawSettings object (defined in FvgTypes). Other inputs (timeframes, filter settings, alert toggles) control the behavior of different modules. CommonUtils assists in mapping some string inputs to Pine constants.
FVG Detection:
For the current chart timeframe (LTF), FvgCalculations.detectFvg() identifies potential FVGs based on bar patterns.
For MTF/HTF, the main indicator script calls FvgCalculations.requestMultiTFBarData() to fetch necessary bar data from higher timeframes, then FvgCalculations.detectMultiTFFvg() identifies FVGs.
Newly detected FVGs are instantiated as types.fvgObject and stored in arrays within the main script. These objects also undergo classification (e.g., Large FVG) by FvgCalculations.
State Update & Interaction: On each bar, the main indicator script iterates through active FVG objects to manage their state based on price interaction:
Initially, the main script calls FvgCalculations.fvgInteractionCheck() to efficiently determine if the current bar's price might be interacting with a given FVG.
If a potential interaction is flagged, the main script then invokes methods directly on the fvgObject instance (e.g., updateMitigation(), updatePartialFill(), checkMidlineTouch(), which are part of FvgObject).
These fvgObject methods are responsible for the detailed condition checking and the actual modification of the FVG's state. For instance, the updateMitigation() and updatePartialFill() methods internally utilize specific helper functions from FvgCalculations (like checkMitigation() and checkPartialMitigation()) to confirm the precise nature of the interaction before updating the fvgObject’s state fields (such as isMitigated, currentTop, currentBottom, or isMidlineTouched).
Visual Rendering:
The FvgObject.updateDrawings() method is called for each fvgObject. This method is central to drawing management; it creates, updates, or deletes chart drawings (boxes, lines, labels) based on the FVG's current state, its prev_* (previous bar state) fields for optimization, and the visual settings passed via the drawSettings object.
Information Panel Update: The main indicator script determines the nearest FVG levels, populates a panelData object (defined in FvgPanelLib), and calls FvgPanel.updatePanel() to refresh the on-chart display.
Alert Generation: Based on the updated FVG states and user-enabled alert settings, the main indicator script constructs and triggers alerts using Pine Script's alert() function."
Key Design Considerations
UDT-Centric Design: The fvgObject UDT is pivotal, acting as a stateful container for all information related to a single FVG. Most operations revolve around creating, updating, or querying these objects.
State Management: To optimize drawing updates and manage FVG lifecycles, fvgObject instances store their previous bar's state (e.g., prevIsVisible, prevCurrentTop). The FvgObject.updateDrawings() method uses this to determine if a redraw is necessary, minimizing redundant drawing calls.
Settings Object: A drawSettings object is populated once (or when inputs change) and passed to drawing functions. This avoids repeatedly reading numerous input() values on every bar or within loops, improving performance.
Dynamic Arrays for FVG Storage: Arrays are used to store collections of fvgObject instances, allowing for dynamic management (adding new FVGs, iterating for updates).

Dr Avinash Talele momentum indicaterTrend and Volatility Metrics
EMA10, EMA20, EMA50:
Show the percentage distance of the current price from the 10, 20, and 50-period Exponential Moving Averages.
Positive values indicate the price is above the moving average (bullish momentum).
Negative values indicate the price is below the moving average (bearish or corrective phase).
Use: Helps traders spot if a stock is extended or pulling back to support.
RVol (Relative Volume):
Compares current volume to the 20-day average.
Positive values mean higher-than-average trading activity (potential institutional interest).
Negative values mean lower activity (less conviction).
Use: High RVol often precedes strong moves.
ADR (Average Daily Range):
Shows the average daily price movement as a percentage.
Use: Higher ADR = more volatility = more trading opportunities.
50D Avg. Vol & 50D Avg. Vol ₹:
The 50-day average volume (in millions) and value traded (in crores).
Use: Confirms liquidity and suitability for larger trades.
ROC (Rate of Change) Section
1W, 1M, 3M, 6M, 12M:
Show the percentage price change over the last 1 week, 1 month, 3 months, 6 months, and 12 months.
Positive values (green) = uptrend, Negative values (red) = downtrend.
Use: Quickly see if the stock is gaining or losing momentum over different timeframes.
Momentum Section
1M, 3M, 6M:
Show the percentage gain from the lowest price in the last 1, 3, and 6 months.
Use: Measures how much the stock has bounced from recent lows, helping find strong rebounds or new leaders.
52-Week High/Low Section
From 52WH / From 52WL:
Show how far the current price is from its 52-week high and low, as a percentage.
Closer to 52WH = strong uptrend; Closer to 52WL = possible value or turnaround setup.
Use: Helps traders identify stocks breaking out to new highs or rebounding off lows.
U/D Ratio
U/D Ratio:
The ratio of up-volume to down-volume over the last 50 days.
Above 1 = more buying volume (bullish), Below 1 = more selling volume (bearish).
Use: Confirms accumulation or distribution.
How This Table Helps Analysts and Traders
Instant Trend Assessment:
With EMA distances and ROC, analysts can instantly see if the stock is trending, consolidating, or reversing.
Momentum Confirmation:
ROC and Momentum sections highlight stocks with strong recent moves, ideal for momentum and breakout traders.
Liquidity and Volatility Check:
Volume and ADR ensure the stock is tradable and has enough price movement to justify a trade.
Relative Positioning:
52-week high/low stats show whether the stock is near breakout levels or potential reversal zones.
Volume Confirmation:
RVol and U/D ratio help confirm if moves are backed by real buying/selling interest.
Actionable Insights:
By combining these metrics, traders can filter for stocks with strong trends, robust momentum, and institutional backing—ideal for swing, position, or even intraday trading.

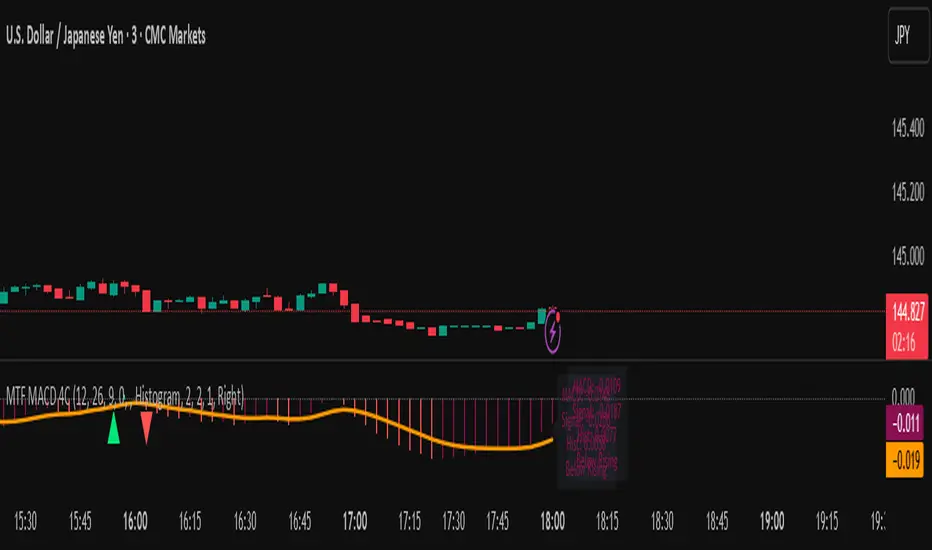
MTF MACD 4-Color Momentum System🎯 Overview
The MTF MACD 4-Color Momentum System is an advanced MACD indicator that provides crystal-clear momentum visualization through an innovative 4-color state system. Unlike traditional MACD indicators that only show positive/negative values, this indicator identifies four distinct market states to help traders make more informed decisions.
📊 Key Features
1. Four-State Color System:
🟢 Lime: Above zero + Rising (Strong Bullish Momentum)
🟢 Dark Green: Above zero + Falling (Weakening Bullish Momentum)
🔴 Red: Below zero + Falling (Strong Bearish Momentum)
🔴 Maroon: Below zero + Rising (Weakening Bearish Momentum)
2. Multi-Timeframe Analysis:
View higher timeframe MACD on lower timeframe charts
Confirm trends across multiple timeframes
Reduce false signals with multi-timeframe confluence
3. Flexible Display Options:
Three visualization styles: Histogram, Columns, or Line
Toggle individual color states on/off
Customizable colors and line widths
4. Advanced Features:
Optional histogram smoothing to reduce noise
Zero-cross alerts with visual markers
Color state change alerts
Real-time value display
Customizable signal line overlay
💡 How to Use
1. Momentum Identification:
Lime bars indicate strong upward momentum - ideal for long entries
Dark green suggests momentum is slowing - consider taking profits
Red bars show strong downward momentum - ideal for short entries
Maroon indicates potential reversal brewing - prepare for direction change
2. Zero Line Crosses:
Blue triangles mark bullish crosses above zero
Pink triangles mark bearish crosses below zero
Use these as confirmation signals with other indicators
3. Multi-Timeframe Confirmation:
Set to higher timeframe (e.g., 4H on 15m chart)
Look for alignment between timeframes before entering trades
Avoid trades against higher timeframe momentum
⚙️ Settings Guide
MACD Parameters:
Fast EMA: 12 (default) - Adjust for more/less sensitivity
Slow EMA: 26 (default) - Standard MACD setting
Signal: 9 (default) - Smoothing period
Display Customization:
Choose between Histogram, Columns, or Line display
Enable/disable specific color states
Adjust visual properties to match your chart theme
Alerts:
Zero cross alerts for trend changes
Color state alerts for momentum shifts
📈 Trading Strategies
1. Momentum Continuation:
Enter longs when MACD turns lime (above zero + rising)
Enter shorts when MACD turns red (below zero + falling)
Exit when color shifts to "weakening" state
2. Reversal Trading:
Watch for maroon in downtrends (potential bottom)
Watch for dark green in uptrends (potential top)
Confirm with price action and support/resistance
3. Multi-Timeframe Confluence:
Use daily MACD on 1H chart for trend direction
Enter on lower timeframe signals in direction of higher timeframe
Avoid counter-trend trades when higher timeframe shows strong momentum
🎓 Pro Tips
Combine with volume indicators for confirmation
Use with support/resistance levels for better entries
Enable smoothing in choppy markets to reduce false signals
Pay attention to divergences between price and MACD
⚠️ Risk Disclaimer
This indicator is for educational purposes only. Always use proper risk management and combine with other analysis methods. Past performance does not guarantee future results.
Hull Moving Average RibbonGradient Wave HMA - Multi-Ribbon Hull Moving Average System
Overview
The Gradient Wave HMA is an advanced technical indicator that transforms Alan Hull's Hull Moving Average (HMA) into a dynamic multi-layered ribbon system. Unlike traditional moving average ribbons that use simple or exponential calculations, this indicator applies Hull's innovative lag-reduction formula across 12 different timeframes simultaneously, creating a visually striking gradient effect that flows with market momentum.
Technical Foundation
This indicator is built upon the Hull Moving Average, developed by Alan Hull in 2005. The HMA uses a weighted moving average calculation designed to almost eliminate lag while maintaining curve smoothness:
HMA = WMA(2*WMA(n/2) − WMA(n), sqrt(n))
Credit: Alan Hull (www.alanhull.com)
Key Features
Multi-Period Ribbon Structure
12 individual HMA lines with customizable periods
Preset configurations for different trading styles:
Fast: 3-30 period range (scalping/intraday)
Swing: 8-55 period range (swing trading)
Position: 20-100 period range (position trading)
Custom: User-defined periods
2. Neon Gradient Visualization
Bullish Gradient: Transitions from blue-purple to hot purple
Bearish Gradient: Flows from hot pink to purple-pink
Each line has a unique color in the spectrum
Gradient fills between lines create depth and visual flow
3. Advanced Alert System
Trend Reversal Alerts: Notifies when ribbon changes direction
Price Breakout Alerts: Triggers when price crosses the ribbon
Compression Alerts: Signals potential breakouts during consolidation
Expansion Alerts: Confirms strong trending conditions
Momentum Surge Alerts: Catches explosive moves early
How It Works
The indicator calculates 12 Hull Moving Averages, each with a different period length. The trend direction is determined by the middle HMA (6th line), which triggers the color change across the entire ribbon. When trending up, the ribbon displays a purple gradient; when trending down, it shifts to a pink gradient.
Trading Applications
1. Trend Identification
Ribbon color indicates overall trend direction
All lines moving in sync confirms strong trend
Mixed signals suggest choppy or transitioning markets
2. Dynamic Support/Resistance
In uptrends, the ribbon acts as moving support
In downtrends, it provides resistance levels
Multiple layers offer various strength levels
3. Momentum Analysis
Expanding ribbon = Increasing momentum
Contracting ribbon = Decreasing momentum/consolidation
Ribbon angle indicates trend strength
4. Trading Example
Advantages Over Traditional MAs
Reduced Lag: Hull's formula provides faster response than SMA/EMA ribbons
Visual Clarity: Gradient effect makes trend changes immediately visible
Multiple Timeframes: 12 periods provide comprehensive market view
Flexibility: Presets adapt to different trading styles
Best Practices
Use higher timeframes (4H, Daily) for position trading
Combine with volume indicators for confirmation
Watch for ribbon compression before major moves
Consider overall market conditions when interpreting signals
Customization Options
Adjust individual HMA periods
Fine-tune transparency for different backgrounds
Choose between WMA and EMA base calculations
The Gradient Wave HMA combines Alan Hull's breakthrough moving average formula with modern visualization techniques to create a powerful trend-following tool that's both technically sophisticated and visually intuitive.

Breakout Volume PROBreakout Volume PRO
Real + Projected Volume Detection
This advanced volume indicator detects breakouts based on both actual and projected volume, allowing you to anticipate strong market moves before the current candle closes.
🔹 Key Features:
Volume breakout detection based on configurable moving average and multiplier.
Early signal when projected volume exceeds threshold before candle close.
Distinct coloring for bullish, bearish, and early breakout volume.
Customizable volume threshold area and base average.
Compatible with any timeframe, including daily and intraday.
Colors:
🔵 Blue: Bullish breakout
🔴 Red: Bearish breakout
🟠 Orange: Projected breakout in progress
⚪️ Gray: Normal volume
Perfect for identifying accumulation, distribution, or high-volume events that may precede price breakouts.
Liquidity LinesLiquidity Lines Indicator
This advanced TradingView indicator identifies key liquidity zones on your price chart by detecting bullish and bearish engulfing candles, which often signify areas where liquidity accumulates. It helps traders visually spot potential support and resistance levels created by market participants’ stop-loss orders or pending orders.
Key Features :
-Aggregated Bars Option : Smooth out price data by grouping bars together, enabling clearer liquidity zone identification on higher timeframes or noisy charts.
-Upper Liquidity Lines : Displays dashed lines at recent highs where bearish engulfing patterns indicate potential resistance or supply zones.
-Lower Liquidity Lines : Displays dashed lines at recent lows where bullish engulfing patterns suggest potential support or demand zones.
-Customizable Colors : Choose your preferred colors for bullish (default black) and bearish (default white) liquidity lines for better visual distinction.
-Automatic Line Cleanup : Maintains chart clarity by automatically removing old liquidity lines after a configurable limit.
-Dynamic Alerts : Trigger alerts when price breaches upper or lower liquidity lines, signaling potential breakout or reversal opportunities.
Use Cases :

ICT Opening Range Projections (tristanlee85)ICT Opening Range Projections
This indicator visualizes key price levels based on ICT's (Inner Circle Trader) "Opening Range" concept. This 30-minute time interval establishes price levels that the algorithm will refer to throughout the session. The indicator displays these levels, including standard deviation projections, internal subdivisions (quadrants), and the opening price.
🟪 What It Does
The Opening Range is a crucial 30-minute window where market algorithms establish significant price levels. ICT theory suggests this range forms the basis for daily price movement.
This script helps you:
Mark the high, low, and opening price of each session.
Divide the range into quadrants (premium, discount, and midpoint/Consequent Encroachment).
Project potential price targets beyond the range using configurable standard deviation multiples .
🟪 How to Use It
This tool aids in time-based technical analysis rooted in ICT's Opening Range model, helping you observe price interaction with algorithmic levels.
Example uses include:
Identifying early structural boundaries.
Observing price behavior within premium/discount zones.
Visualizing initial displacement from the range to anticipate future moves.
Comparing price reactions at projected standard deviation levels.
Aligning price action with significant times like London or NY Open.
Note: This indicator provides a visual framework; it does not offer trade signals or interpretations.
🟪 Key Information
Time Zone: New York time (ET) is required on your chart.
Sessions: Supports multiple sessions, including NY midnight, NY AM, NY PM, and three custom timeframes.
Time Interval: Supports multi-timeframe up to 15 minutes. Best used on a 1-minute chart for accuracy.
🟪 Session Options
The Opening Range interval is configurable for up to 6 sessions:
Pre-defined ICT Sessions:
NY Midnight: 12:00 AM – 12:30 AM ET
NY AM: 9:30 AM – 10:00 AM ET
NY PM: 1:30 PM – 2:00 PM ET
Custom Sessions:
Three user-defined start/end time pairs.
This example shows a custom session from 03:30 - 04:00:
🟪 Understanding the Levels
The Opening Price is the open of the first 1-minute candle within the chosen session.
At session close, the Opening Range is calculated using its High and Low . An optional swing-based mode uses swing highs/lows for range boundaries.
The range is divided into quadrants by its midpoint ( Consequent Encroachment or CE):
Upper Quadrant: CE to high (premium).
Lower Quadrant: Low to CE (discount).
These subdivisions help visualize internal range dynamics, where price often reacts during algorithmic delivery.
🟪 Working with Ranges
By default, the range is determined by the highest high and lowest low of the 30-minute session:
A range can also be determined by the highest/lowest swing points:
Quadrants outline the premium and discount of a range that price will reference:
Small ranges still follow the same algorithmic logic, but may be deemed insignificant for one's trading. These can be filtered in the settings by specifying a minimum ticks limit. In this example, the range is 42 ticks (10.5 points) but the indicator is configured for 80 ticks (20 points). We can select which levels will plot if the range is below the limit. Here, only the 00:00 opening price is plotted:
You may opt to include the range high/low, quadrants, and projections as well. This will plot a red (configurable) range bracket to indicate it is below the limit while plotting the levels:
🟪 Price Projections
Projections extend beyond the Opening Range using standard deviations, framing the market beyond the initial session and identifying potential targets. You define the standard deviation multiples (e.g., 1.0, 1.5, 2.0).
Both positive and negative extensions are displayed, symmetrically projected from the range's high and low.
The Dynamic Levels option plots only the next projection level once price crosses the previous extreme. For example, only the 0.5 STDEV level plots until price reaches it, then the 1.0 level appears, and so on. This continues up to your defined maximum projections, or indefinitely if standard deviations are set to 0.
This example shows dynamic levels for a total of 6 sessions, only 1 of which meet a configured minimum limit of 50 ticks:
Small ranges followed by significant displacement are impacted the most with the number of levels plotted. You may hide projections when configuring the minimum ticks.
A fixed standard deviation will plot levels in both directions, regardless of the price range. Here, we plot up to 3.0 which hiding projections for small ranges:
🟪 Legal Disclaimer
This indicator is provided for informational and educational purposes only. It is not financial advice, and should not be construed as a recommendation to buy or sell any financial instrument. Trading involves substantial risk, and you could lose a significant amount of money. Past performance is not indicative of future results. Always consult with a qualified financial professional before making any trading or investment decisions. The creators and distributors of this indicator assume no responsibility for your trading outcomes.

Hybrid Adaptive Momentum Average (HAMA)Hybrid Adaptive Momentum Average (HAMA)
Imagine you want a moving average line on your chart that's usually smooth but gets really quick to follow the price when the market suddenly makes a big, fast move. That's what HAMA tries to be.
Here's the simple breakdown:
Slightly Better Starting Price: Instead of just using the closing price, HAMA first creates a slightly "smarter" starting price by giving a bit more importance to the very latest prices (like a quick WMA).
Checks Market Speed (Momentum): It then looks at how fast this "smarter price" has been moving recently.
-If the price is shooting up or down quickly, HAMA knows there's strong momentum.
-If the price is just drifting sideways, momentum is low.
Adjusts Its Own Speed: Based on this momentum:
-Strong Momentum (Fast Market): HAMA makes itself "faster." This means its line will stick closer to the current price and react quickly to changes. (It uses a shorter "period" internally).
-Weak Momentum (Slow/Choppy Market): HAMA makes itself "slower." Its line will be smoother and less jumpy, ignoring minor wiggles. (It uses a longer "period" internally).
-Draws the Line: Finally, it calculates and draws the moving average line using this automatically adjusted speed.
Why "Hybrid"?
It's called "hybrid" because it takes bits and pieces of ideas from several standard moving averages:
-Like an EMA, it's built to be responsive.
-Like a WMA, it initially focuses on recent prices.
-Inspired by the HMA, it tries to be smart about detecting momentum to adjust itself.
In a Nutshell:
The HAMA is a custom moving average that tries to be the best of both worlds: smooth in calm markets and quick to react in fast-moving markets by automatically changing its own calculation speed based on price momentum.

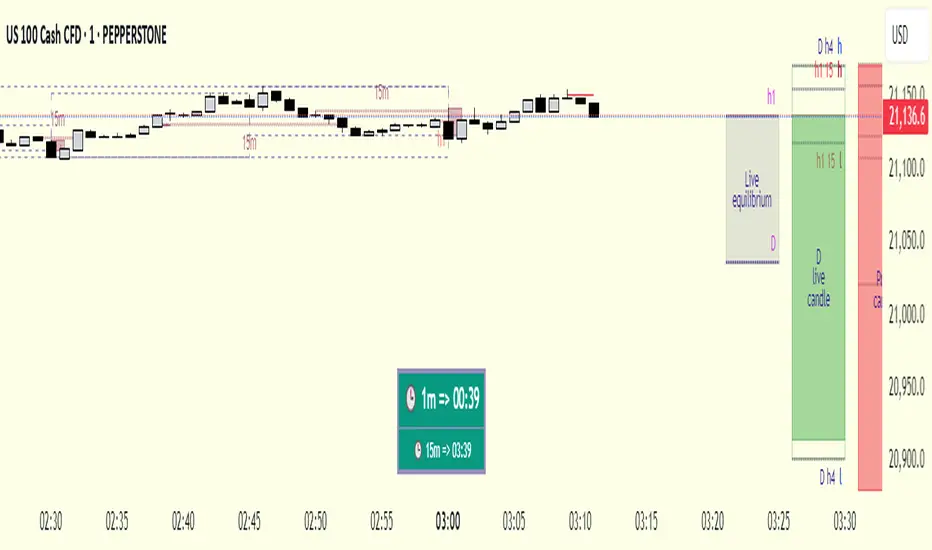
cd_respect2_EQ_Cx🔹 Overview:
Many traders form a bias or look for trade setups by analyzing the high (H) and low (L) of previous higher timeframe candles. For example: a close above the previous daily high, a failure to close after breaking the high, or approaching the level without making a new high. As we’ve been taught to focus on these key levels, I wanted to draw attention to what's happening at the mid-levels (Equilibrium) of the current and higher timeframe candles.
We’ve all heard the phrase “Strong price reacts from equilibrium,” yet most of us wait at the extremes.
While working on equilibrium levels of both higher timeframes and the current timeframe, I noticed that when a current candle closes above/below the previous HTF candle's high/low, price often respects the part of the candle that caused the break — which I refer to as the Last Block. When respected, price tends to continue with momentum; when lost, a pullback or reversal often follows.
________________________________________
🔹 About the Indicator:
This tool analyzes four different higher timeframes and shows:
• Current candle equilibrium levels
• Previous candle equilibrium levels (2 display options):
1. On Box – classic display
2. On Candle – equilibrium is linked to the last candle that includes the level, making those candles more meaningful or "strengthened"
• Alerts (standard) and on-screen warnings when price approaches previous equilibrium levels
• High/Low levels of previous HTF candles
• High/Low levels of live HTF candles
• Last Block: the upper or lower part of the candle that caused the breakout when price closes above/below the previous HTF high/low
• Countdown timer until the close of selected HTFs
________________________________________
🔹 Menus & Usage:
🔸 Show/Hide Tab:
• Toggle Previous Equilibrium display (On Candle / On Box)
• Toggle Live Equilibrium levels, color selection, and left extension
• Toggle Current Candle Equilibrium and colors
• Alert on Chart: flashing on-screen visual alert
• Approach Limit: sets how close price must be to trigger alert
• Remaining Time (RT): toggle countdown display for selected timeframes
________________________________________
🔸 HTF H/L Levels Tab:
• Show previous and live HTF candle highs/lows
• Customize colors, starting points, and left extension options
________________________________________
🔸 Timeframes & Options Tab:
• Select which timeframes to display
• Choose level colors
• Enable price alerts
• Control visibility in the time chart
• Toggle Last Block display (close-to-high/low)
________________________________________
🔸 Look Back HTF Candles Tab:
• Delete filled levels: removes invalidated zones; only unmitigated remain
• Back Control: set how many candles to look back per timeframe (unlimited if not set)
________________________________________
🔸 HTF Boxes Tab:
• Display HTF candles in boxes
• Set colors (single color or per timeframe)
• Adjust font sizes across the chart
________________________________________
🔹 Usage & Last Blocks:
The core idea behind both equilibrium levels and last blocks is:
Price should “gain” and respect them to validate continuation.
Viewing multiple timeframes together strengthens bias.
Each level is treated as part of the candle it's associated with — defining the “area to be gained.”
“Did price respect the level because of that candle, or did the candle gain significance because it aligned with the level? That’s open for debate.”
(In my opinion, the candle gains significance because it aligns with the level.)
When respected, these levels/blocks act as support; when lost, they act as resistance.
In suitable timeframes, reclaiming previous equilibrium levels may be interpreted as CHoCH / CISD / IDM depending on the context.
________________________________________
🔹 Usage Example – Last Blocks:
I personally trade on 1-minute and use Daily / H4 / H1 / 15m as selected timeframes.
For example, if price reclaims the previous 15m level, I view it as a Change of Character. I then expect the next candle to show respect in that direction.
Choose timeframes based on your trading style.
Sometimes, HTF levels (past and live) cluster tightly — these areas are key watch zones for me.
That’s the reason I decided to share this indicator.
________________________________________
🔹 Chart Examples:
🔸 Example 1:
Price closes above both the 12:45 15m candle and the 12:00 H1 equilibrium levels.
Last Block forms. After retracing, price mitigates the block and respects live equilibrium levels (H4/H1/15m).
🔸 Example 2:
Explained on chart – Levels that pushed price down in the bearish trend later acted as support.
🔸 Example 3 – CHoCH/CISD/IDM Alternative:
Explained on chart – Replacing structural signals with equilibrium levels.
I see this pattern often — very effective.
🔸 Example 4:
Many levels are clustered in a narrow range; price shows respect across the board.
________________________________________
🔹 Final Note:
Hope you like the tool. I’d love to hear your thoughts and suggestions.
"Keep in mind, strong price reverses from equilibrium."
Happy trading!
BG Ichimoku Tenkan MTFBG Ichimoku Tenkan MTF: Your Multi-Timeframe Trend Compass
Elevate your Ichimoku analysis with the BG Ichimoku Tenkan MTF indicator. This powerful tool provides a comprehensive view of the Tenkan-sen (Conversion Line) across multiple timeframes, helping you identify trends and potential shifts with greater clarity. It's ideal for all markets, including stocks, cryptocurrencies, Forex, and futures.
Key Features:
Main Tenkan-sen Plot: Visualize the Tenkan-sen for your active chart timeframe with adjustable color.
Multi-Timeframe Table: A dynamic table displays the Tenkan-sen's relationship to price (🔼 for above, 🔽 for below) and its current value for up to 7 timeframes.
Continuous MTF Lines: Plot the Tenkan-sen from higher timeframes directly on your current chart, providing clear support/resistance levels and trend confluence.
Fully Customizable Colors: Personalize the color for each individual timeframe in the table and for its corresponding MTF line, ensuring a clean and intuitive visual experience. You can also adjust the main Tenkan-sen color and the MTF line offset.
Gain a deeper understanding of market dynamics by analyzing the Tenkan-sen across different time scales, all in one intuitive indicator.
We created this indicator to help you better navigate the markets. Thank you for using it, and we hope it brings you value. Enjoy it in your daily analysis!
Bab

Lorentzian Classification - Advanced Trading DashboardLorentzian Classification - Relativistic Market Analysis
A Journey from Theory to Trading Reality
What began as fascination with Einstein's relativity and Lorentzian geometry has evolved into a practical trading tool that bridges theoretical physics and market dynamics. This indicator represents months of wrestling with complex mathematical concepts, debugging intricate algorithms, and transforming abstract theory into actionable trading signals.
The Theoretical Foundation
Lorentzian Distance in Market Space
Traditional Euclidean distance treats all feature differences equally, but markets don't behave uniformly. Lorentzian distance, borrowed from spacetime geometry, provides a more nuanced similarity measure:
d(x,y) = Σ ln(1 + |xi - yi|)
This logarithmic formulation naturally handles:
Scale invariance: Large price moves don't overwhelm small but significant patterns
Outlier robustness: Extreme values are dampened rather than dominating
Non-linear relationships: Captures market behavior better than linear metrics
K-Nearest Neighbors with Relativistic Weighting
The algorithm searches historical market states for patterns similar to current conditions. Each neighbor receives weight inversely proportional to its Lorentzian distance:
w = 1 / (1 + distance)
This creates a "gravitational" effect where closer patterns have stronger influence on predictions.
The Implementation Challenge
Creating meaningful market features required extensive experimentation:
Price Features: Multi-timeframe momentum (1, 2, 3, 5, 8 bar lookbacks) Volume Features: Relative volume analysis against 20-period average
Volatility Features: ATR and Bollinger Band width normalization Momentum Features: RSI deviation from neutral and MACD/price ratio
Each feature undergoes min-max normalization to ensure equal weighting in distance calculations.
The Prediction Mechanism
For each current market state:
Feature Vector Construction: 12-dimensional representation of market conditions
Historical Search: Scan lookback period for similar patterns using Lorentzian distance
Neighbor Selection: Identify K nearest historical matches
Outcome Analysis: Examine what happened N bars after each match
Weighted Prediction: Combine outcomes using distance-based weights
Confidence Calculation: Measure agreement between neighbors
Technical Hurdles Overcome
Array Management: Complex indexing to prevent look-ahead bias
Distance Calculations: Optimizing nested loops for performance
Memory Constraints: Balancing lookback depth with computational limits
Signal Filtering: Preventing clustering of identical signals
Advanced Dashboard System
Main Control Panel
The primary dashboard provides real-time market intelligence:
Signal Status: Current prediction with confidence percentage
Neighbor Analysis: How many historical patterns match current conditions
Market Regime: Trend strength, volatility, and volume analysis
Temporal Context: Real-time updates with timestamp
Performance Analytics
Comprehensive tracking system monitors:
Win Rate: Percentage of successful predictions
Signal Count: Total predictions generated
Streak Analysis: Current winning/losing sequence
Drawdown Monitoring: Maximum equity decline
Sharpe Approximation: Risk-adjusted performance estimate
Risk Assessment Panel
Multi-dimensional risk analysis:
RSI Positioning: Overbought/oversold conditions
ATR Percentage: Current volatility relative to price
Bollinger Position: Price location within volatility bands
MACD Alignment: Momentum confirmation
Confidence Heatmap
Visual representation of prediction reliability:
Historical Confidence: Last 10 periods of prediction certainty
Strength Analysis: Magnitude of prediction values over time
Pattern Recognition: Color-coded confidence levels for quick assessment
Input Parameters Deep Dive
Core Algorithm Settings
K Nearest Neighbors (1-20): More neighbors create smoother but less responsive signals. Optimal range 5-8 for most markets.
Historical Lookback (50-500): Deeper history improves pattern recognition but reduces adaptability. 100-200 bars optimal for most timeframes.
Feature Window (5-30): Longer windows capture more context but reduce sensitivity. Match to your trading timeframe.
Feature Selection
Price Changes: Essential for momentum and reversal detection Volume Profile: Critical for institutional activity recognition Volatility Measures: Key for regime change detection Momentum Indicators: Vital for trend confirmation
Signal Generation
Prediction Horizon (1-20): How far ahead to predict. Shorter horizons for scalping, longer for swing trading.
Signal Threshold (0.5-0.9): Confidence required for signal generation. Higher values reduce false signals but may miss opportunities.
Smoothing (1-10): EMA applied to raw predictions. More smoothing reduces noise but increases lag.
Visual Design Philosophy
Color Themes
Professional: Corporate blue/red for institutional environments Neon: Cyberpunk cyan/magenta for modern aesthetics
Matrix: Green/red hacker-inspired palette Classic: Traditional trading colors
Information Hierarchy
The dashboard system prioritizes information by importance:
Primary Signals: Largest, most prominent display
Confidence Metrics: Secondary but clearly visible
Supporting Data: Detailed but unobtrusive
Historical Context: Available but not distracting
Trading Applications
Signal Interpretation
Long Signals: Prediction > threshold with high confidence
Look for volume confirmation
- Check trend alignment
- Verify support levels
Short Signals: Prediction < -threshold with high confidence
Confirm with resistance levels
- Check for distribution patterns
- Verify momentum divergence
- Market Regime Adaptation
Trending Markets: Higher confidence in directional signals
Ranging Markets: Focus on reversal signals at extremes
Volatile Markets: Require higher confidence thresholds
Low Volume: Reduce position sizes, increase caution
Risk Management Integration
Confidence-Based Sizing: Larger positions for higher confidence signals
Regime-Aware Stops: Wider stops in volatile regimes
Multi-Timeframe Confirmation: Align signals across timeframes
Volume Confirmation: Require volume support for major signals
Originality and Innovation
This indicator represents genuine innovation in several areas:
Mathematical Approach
First application of Lorentzian geometry to market pattern recognition. Unlike Euclidean-based systems, this naturally handles market non-linearities.
Feature Engineering
Sophisticated multi-dimensional feature space combining price, volume, volatility, and momentum in normalized form.
Visualization System
Professional-grade dashboard system providing comprehensive market intelligence in intuitive format.
Performance Tracking
Real-time performance analytics typically found only in institutional trading systems.
Development Journey
Creating this indicator involved overcoming numerous technical challenges:
Mathematical Complexity: Translating theoretical concepts into practical code
Performance Optimization: Balancing accuracy with computational efficiency
User Interface Design: Making complex data accessible and actionable
Signal Quality: Filtering noise while maintaining responsiveness
The result is a tool that brings institutional-grade analytics to individual traders while maintaining the theoretical rigor of its mathematical foundation.
Best Practices
- Parameter Optimization
- Start with default settings and adjust based on:
Market Characteristics: Volatile vs. stable
Trading Timeframe: Scalping vs. swing trading
Risk Tolerance: Conservative vs. aggressive
Signal Confirmation
Never trade on Lorentzian signals alone:
Price Action: Confirm with support/resistance
Volume: Verify with volume analysis
Multiple Timeframes: Check higher timeframe alignment
Market Context: Consider overall market conditions
Risk Management
Position Sizing: Scale with confidence levels
Stop Losses: Adapt to market volatility
Profit Targets: Based on historical performance
Maximum Risk: Never exceed 2-3% per trade
Disclaimer
This indicator is for educational and research purposes only. It does not constitute financial advice or guarantee profitable trading results. The Lorentzian classification system reveals market patterns but cannot predict future price movements with certainty. Always use proper risk management, conduct your own analysis, and never risk more than you can afford to lose.
Market dynamics are inherently uncertain, and past performance does not guarantee future results. This tool should be used as part of a comprehensive trading strategy, not as a standalone solution.
Bringing the elegance of relativistic geometry to market analysis through sophisticated pattern recognition and intuitive visualization.
Thank you for sharing the idea. You're more than a follower, you're a leader!
@vasanthgautham1221
Trade with precision. Trade with insight.
— Dskyz , for DAFE Trading Systems
